AUDJPY: Key Resistance Ahead 🇦🇺🇯🇵
AUDJPY is approaching an important resistance cluster on a daily.
The price formed a cup and handle pattern on that on an hourly.
Its neckline has just been broken.
I expect a pullback at least to 92.55 level.
❤️Please, support my work with like, thank you!❤️
I am part of Trade Nation's Influencer program and receive a monthly fee for using their TradingView charts in my analysis.
Technical Analysis

NASDAQ INDEX (US100): Time for Pullback
There is a high chance that US100 will retrace from the underlined
blue daily resistance.
I spotted a double top pattern on a 4h time frame after its test
and a nice bearish imbalance candle that was formed
during the NY session yesterday as confirmations.
Goal - 19590
❤️Please, support my work with like, thank you!❤️

Silver Slips on Trade Optimism and Weak Economic Data Silver prices dropped over 1% on Thursday, slipping to around $32 per ounce, dragged by reduced safe-haven demand following Trump's optimistic remarks on potential trade deals with China, India, Japan, and South Korea.
Weak economic data further pressured prices, with the U.S. economy contracting by 0.3% and China’s manufacturing PMI falling to a 16-month low, raising concerns about industrial demand.
Today, silver is showing signs of recovery amid improved risk appetite, with the market focus on the $34.90–$35.00 resistance zone as a key technical level.
Narrow Range: $31.30 – $33.70
Wide Range: $28.50 – $34.90/35.00

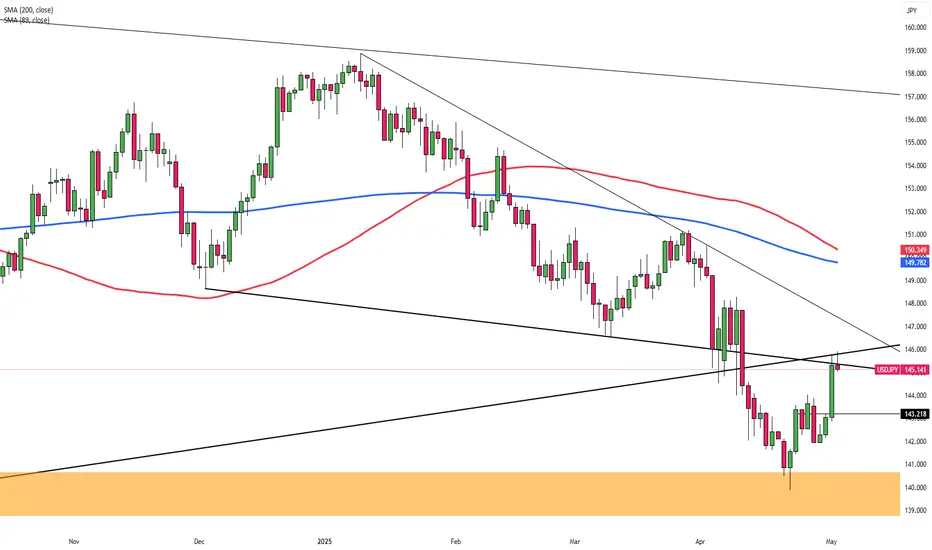
Yen Near 146 as Trade Hopes WeighThe yen hovered near 146 per dollar Friday after a 1.6% drop, pressured by weaker safe-haven demand amid improving US-China trade prospects. China is open to talks after repeated U.S. outreach, while Japan and the U.S. wrapped up a second round of bilateral talks, aiming for a June deal. Domestically, Japan’s jobless rate rose to 2.5% in March, but the labor market stayed tight. The Bank of Japan held rates at 0.5% and cut its growth and inflation outlooks, signaling limited chances of near-term hikes.
Resistance is located at 145.90, followed by 146.75 and 149.80. On the downside, support levels are at 139.70, then 137.00 and 135.00.
Gold on Edge – Will NFP Trigger the Next Big Move?🚨 Gold at a Crossroads – Will NFP & White House Comments Trigger a Volatility Spike? ⚡
🧭 Macro Overview
Gold enters the US session with a mild rebound after a sharp selloff, following its historic climb to $3,500/oz. The recent drop was driven less by fundamentals and more by aggressive profit-taking, especially from retail flows in Asia, notably China.
Rather than a trend reversal, this correction looks like a healthy technical reset, just ahead of two major catalysts:
1️⃣ US Non-Farm Payrolls (May edition)
2️⃣ White House remarks on tariffs and trade strategy
These two factors will likely define gold’s direction heading into next week — either toward deeper support zones or a potential recovery rally into resistance.
📊 DXY & Macro Market Lens
The US Dollar Index (DXY) has bounced off its base near 98.xx, currently testing the 100.00 level. Whether the dollar strengthens further depends largely on today’s labour data and fiscal signals from Washington.
Traders should remain tactically neutral, relying on intraday timeframes like H1/H2 and respecting key price structure.
🔺 Key Resistance Levels
3,260
3,275
3,285
3,312
🔻 Key Support Levels
3,244
3,230
3,215
3,200
🎯 Trade Plan – Friday 3rd May, 2025
🔵 BUY ZONE A:
Entry: 3,232 – 3,230
SL: 3,226
TP: 3,236 → 3,240 → 3,244 → 3,248 → 3,252 → 3,256 → 3,260
🔵 BUY ZONE B:
Entry: 3,214 – 3,212
SL: 3,208
TP: 3,218 → 3,222 → 3,226 → 3,230 → 3,235 → 3,240
🔴 SELL ZONE:
Entry: 3,276 – 3,278
SL: 3,282
TP: 3,272 → 3,268 → 3,264 → 3,260 → 3,250
⚠️ Final Notes
Volatility may spike sharply during the NY session as NFP and political news collide.
This is the kind of session where traders can either capitalize massively or get caught offside — stay disciplined.
Avoid emotional entries — let price come to you, wait for confirmation, and stick to your TP/SL.
📣 Conclusion
We’re likely in a calm-before-the-storm scenario. Gold hasn’t made its real move yet — but when it does, it’ll be swift.
Prepare. Execute. Protect your capital.

Equity Research Report – NEWGEN SOFTWARE TECHNOLOGIESShort-Term View: A strong breakout above key resistance at ₹1,100 with volume surge indicates bullish momentum. Price reclaimed the 50 EMA after consolidation. RSI at 60.87 supports strength; next resistance lies near ₹1,193.90.
Long-Term View: Structurally strong after correction. Sustaining above ₹1,020 (50 EMA) may attract fresh buying. Long-term targets can stretch to ₹1,300+ if earnings and demand trends remain favorable.
Conclusion: Bullish momentum likely to continue both short and long term. Watch for volume confirmation and hold above ₹1,100.
For Education Purpose only

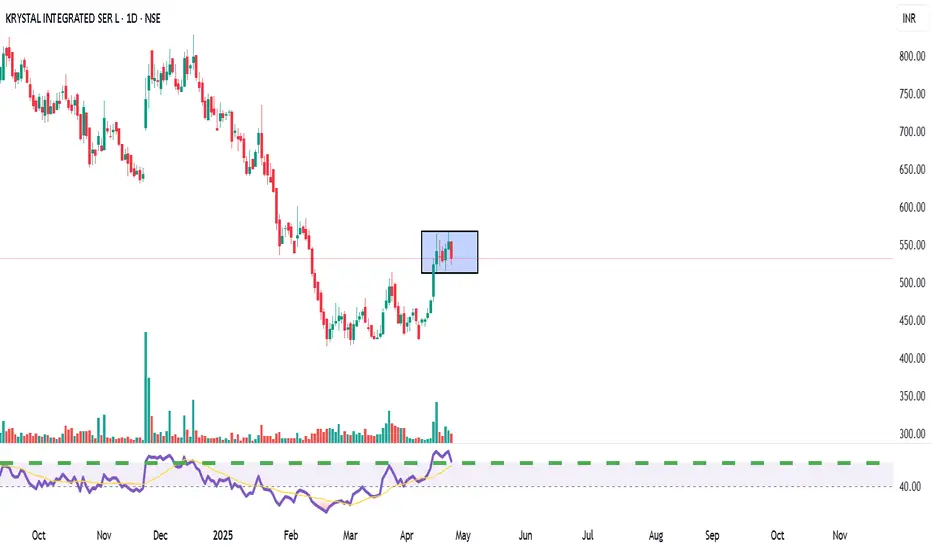
KRYSTAL Integrated Services LtdTechnical View: KRYSTAL is consolidating between ₹520–₹550 after a rally from March lows. A breakout above ₹560 could target ₹600+, while a dip below ₹500 may weaken momentum. RSI shows moderate bullishness.
Fundamental View: FY24 revenue grew ~44% YoY to ₹981 Cr; net profit rose ~26% to ₹48 Cr. ROE ~18%, ROCE ~20%. Recently secured a ₹349 Cr 3-year contract from Tamil Nadu Medical Services.
Action Plan:
Short-term: Buy above ₹560, target ₹600.
Long-term: Attractive valuation; accumulate on dips ₹450–₹500 zone.
#NIFTY Intraday Support and Resistance Levels - 02/05/2025Gap up opening expected in nifty near 24450 level. Currently nifty consolidating in the range of 24250-24500 level. After opening if nifty gives breakout and start trading above 24500 level then possible strong upside rally towards the 24750+ level in today's session. 24250 level will act as a strong support for today's session. Any major downside only expected if nifty starts trading below 24200 level. Below 24200 level downside can goes upto 24000 level.

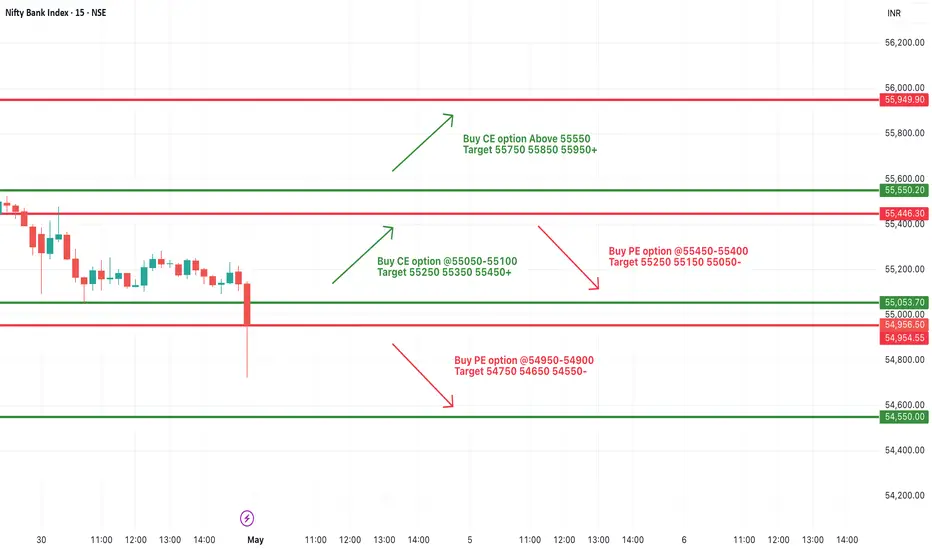
[INTRADAY] #BANKNIFTY PE & CE Levels(02/05/2025)Today will be gap up opening expected in banknifty. 55050-55450 zone will be consolidation for banknifty. 55450-55550 zone will act as a strong resistance for today's session. After opening if banknifty gives breakout and starts trading above 55550 level then expected strong upside rally upto 55950+ level in today's session. Any major downside only expected below 54950 level.
Nightly $SPY / $SPX Scenarios for May 2, 2025🔮 Nightly AMEX:SPY / SP:SPX Scenarios for May 2, 2025 🔮
🌍 Market-Moving News 🌍
🇺🇸 Rising Unemployment Claims Signal Labor Market Softening
Initial jobless claims increased by 18,000 to 241,000 for the week ending April 26, marking the highest level since late February. Continuing claims also rose to 1.916 million, indicating potential cracks in the labor market.
🏭 Manufacturing Sector Contracts Amid Tariff Pressures
The ISM Manufacturing PMI fell to 48.7 in April from 49.0 in March, indicating a second consecutive month of contraction. Tariffs on imported goods have strained supply chains and elevated input prices, contributing to the downturn.
📉 Construction Spending Declines
Construction spending decreased by 0.5% in March, reflecting reduced investments in both residential and nonresidential projects. This decline suggests caution in the construction sector amid economic uncertainties.
📊 Mixed Signals from Manufacturing Indices
While the ISM Manufacturing PMI indicates contraction, the S&P Global Manufacturing PMI remained steady at 50.2 in April, suggesting stability in some manufacturing segments despite broader challenges.
📊 Key Data Releases 📊
📅 Friday, May 2:
💼 Nonfarm Payrolls (8:30 AM ET)
Provides insight into employment trends and overall economic health.
📈 Unemployment Rate (8:30 AM ET)
Measures the percentage of the labor force that is unemployed and actively seeking employment.
💰 Average Hourly Earnings (8:30 AM ET)
Indicates wage growth and potential inflationary pressures.
🏭 Factory Orders (10:00 AM ET)
Reflects the dollar level of new orders for both durable and nondurable goods, indicating manufacturing sector strength.
⚠️ Disclaimer:
This information is for educational and informational purposes only and should not be construed as financial advice. Always consult a licensed financial advisor before making investment decisions.
📌 #trading #stockmarket #economy #news #trendtao #charting #technicalanalysis

Fri 2nd May 2025 NZD/USD Daily Forex Chart Sell SetupGood morning fellow traders. On my Daily Forex charts using the High Probability & Divergence trading methods from my books, I have identified a new trade setup this morning. As usual, you can read my notes on the chart for my thoughts on this setup. The trade being a NZD/USD Sell. Enjoy the day all. Cheers. Jim

Fri 2nd May 2025 XAG/USD Daily Forex Chart Sell SetupGood morning fellow traders. On my Daily Forex charts using the High Probability & Divergence trading methods from my books, I have identified a new trade setup this morning. As usual, you can read my notes on the chart for my thoughts on this setup. The trade being a XAG/USD Sell. Enjoy the day all. Cheers. Jim

XAUUSD Technical Analysis: Bullish and Bearish ScenariosGold (XAUUSD) has exhibited a strong bullish impulse, breaking out of established channel structures. Following a sharp ascent, the price action has entered a consolidation phase near recent highs. This analysis explores potential scenarios based on technical patterns, key levels, and underlying market psychology.
Chart Analysis and Market Psychology
The chart displays a distinct uptrend characterized by ascending channels. Recently, XAUUSD experienced a significant upward thrust, breaking decisively above the shorter-term orange channel. This move reached the projected target derived from this channel's height, near the 3405 level.
Following this peak, price action has formed a tighter consolidation range. This pattern, occurring after a sharp rally and on potentially decreasing volume (as is common in such formations), resembles a bullish continuation pattern, such as a pennant or flag. From a market psychology perspective, this suggests a temporary equilibrium:
Buying Pressure: Bulls who drove the initial breakout may be pausing, absorbing profits taken by earlier entrants, or accumulating new positions in anticipation of further upside. The sharp nature of the preceding rally indicates strong underlying demand and potentially FOMO (Fear Of Missing Out) among participants.
Selling Pressure: Sellers are attempting to cap the rally, potentially taking profits or initiating short positions. However, the observation that dips below 3259 were quickly bought suggests that selling pressure has been relatively weak compared to the buying interest defending this level. This rejection indicates that market participants still perceive value at or above this zone, viewing it as a potential support level following the breakout.
The key level currently in focus appears to be around 3259. The price interaction with this level could be crucial in determining the next directional move.
Bullish Scenario
Conditions: For a bullish continuation, the price would ideally need to hold above the 3259 support level. A decisive breakout above the upper boundary of the current consolidation pattern would serve as confirmation.
Psychology: This outcome would suggest that the consolidation phase was indeed accumulative, with buyers absorbing selling pressure and preparing for the next leg higher. It would reinforce the "impatient bulls" and "weak bears" narrative.
Potential Targets:
A retest of the recent highs near 3405.
The target derived from the breakout of the medium-term turquoise channel, located near 3640.
Given the aggressive nature of the preceding rally, an overshoot towards the higher projection at 3839 might become a possibility if bullish momentum remains exceptionally strong after breaking 3640.
Bearish Scenario
Conditions: A failure to hold the 3259 level, coupled with a break below the lower boundary of the consolidation pattern, could signal a potential reversal or a deeper pullback. This might involve price re-entering the previously broken orange channel.
Psychology: This scenario would suggest that the buying pressure was insufficient to sustain the breakout, potentially indicating a "bull trap" or simply a more significant profit-taking wave overwhelming demand at current levels.
Potential Support Zones:
The upper trendline of the orange channel (acting as support after being resistance).
The primary uptrend line (lower boundary) of the orange channel.
The channel line (upper boundary) of the broader turquoise channel, which could coincide with the orange channel's lower boundary, potentially forming a confluence of support.
Concluding Remarks
XAUUSD is at a potential juncture following a strong bullish breakout. The current consolidation pattern holds the key to the next immediate move. Holding above 3259 and breaking the consolidation high could pave the way for further upside towards targets at 3640 and potentially 3839. Conversely, a failure to maintain support at 3259 might trigger a pullback towards the support levels defined by the underlying channel structures. Traders often watch volume closely during the resolution of such patterns for confirmation.
Disclaimer: This report is for informational and educational purposes only and does not constitute financial advice or a recommendation to buy or sell any asset. Trading involves risk, and decisions should be based on your own research and risk tolerance.

SUSDT Potential UpsidesHey Traders, in today's trading session we are monitoring SUSDT for a buying opportunity around 0.4890 zone, SUSDT is trading in an uptrend and currently is in a correction phase in which it is approaching the trend at 0.4890 support and resistance area.
Trade safe, Joe.

GBPJPY: Consolidation Phase Targeting the Main TrendHey Traders, in today's trading session we are monitoring GBPJPY for a buying opportunity around 189.600 zone, GBPJPY is trading in an uptrend and currently is in a correction phase in which it is approaching the trend at 189.600 support and resistance area.
Trade safe, Joe.

BITCOIN (BTCUSD): Strong Bullish Signs?! ₿
Bitcoin has probably completed the accumulation
stage after a completion of a strong bullish wave a week ago.
I see a breakout of a resistance line of a symmetrical triangle
on a daily time frame.
It is an important sign of strength of the buyers.
The price may continue going up now and reach 98.180 level.
❤️Please, support my work with like, thank you!❤️

Fall Down to $70 ApproachingWith the RSI above average since mid-April 2025, the trend has been steadily rising up to $82 per share even breaking the highs from late February and March.
Price projected onto both (A and B) Inside pitchforks is well above the median line. In the pitchfork A the price is even directly touching the upper parallel line.
Reversal near the highest achieved price this year on 21st February is probable
Based on these indications, we can expect a fall to around $70 somewhere in the middle of May.
Key details:
RSI over "overbought" level
Price in both Inside pitchforks near the upper parallel line
Longer uptrend = breakdown necessary

NZDCAD: One More Bearish Forex Pair 🇳🇿🇨🇦
One more CAD pair that looks strongly bearish to me is NZDCAD.
Price action analysis speaks out loud on a daily.
The market was rallying nicely and started to slow down,
approaching a key horizontal resistance.
The price started to consolidate and dropped then violating
multiple horizontal supports and a rising trend line.
With a high probability, the market will drop even lower.
Next support - 0.81
❤️Please, support my work with like, thank you!❤️

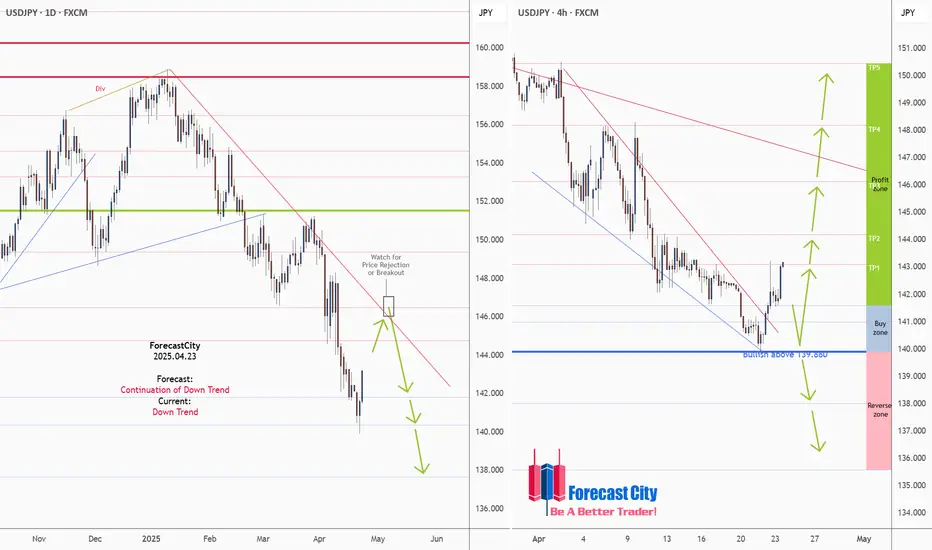
USDJPY Daily & H4 Forecasts, Technical Analysis & Trading IdeaTechnical analysis is on the chart!
No description needed!
FX:USDJPY
________________________________________________________________
❤️ If you find this helpful and want more FREE forecasts in TradingView,
. . . . . . . . Hit the 'BOOST' button 👍
. . . . . . . . . . . Drop some feedback in the comments below! (e.g., What did you find most useful? How can we improve?)
🙏 Your support is appreciated!
Now, it's your turn!
Be sure to leave a comment; let us know how you see this opportunity and forecast.
Have a successful week,
ForecastCity Support Team
EURCAD: Strong Bearish Pattern Spotted 🇪🇺🇨🇦
EURCAD formed a huge head and shoulders pattern on a daily time frame.
Its neckline was broken yesterday with a high momentum bearish candle.
I guess that the pair may drop much lower now.
Next support - 1.55
❤️Please, support my work with like, thank you!❤️
I am part of Trade Nation's Influencer program and receive a monthly fee for using their TradingView charts in my analysis.

LYFT, 3D Daily Breakout Confirms Potential Mid-Term ReversalOn the 3-day chart of Lyft, price action is developing within a potential mid-term reversal structure. The key trigger was the breakout of the descending trendline on the daily timeframe, signaling a shift in momentum after an extended downtrend.
The asset bounced from the long-term ascending support zone around $9.66, and the structure now points to a possible expansion toward key Fibonacci retracement levels:
Upside targets based on Fibo levels:
– $14.36 (0.5)
– $15.47 (0.618)
– $17.05 (0.786)
– Extended: $24.88 (1.618)
Technical Highlights:
– Breakout confirmed on daily chart trendline
– 3D chart shows tightening triangle pattern
– Stochastic momentum turning bullish from oversold levels
– Volume profile supports accumulation, not distribution
– Resistance zone: $14.30–$17.00
– Holding above the breakout trendline keeps the bullish setup valid
Fundamental Context:
Lyft is restructuring operations, with narrowed losses, improved efficiency, and customer retention focus. The company is regaining share in the ride-hailing segment, and investors are beginning to price in operational stabilization. The improving sentiment is reflected in growing institutional interest and mid-term positioning.
This is a potential mid-term bullish scenario, activated by the daily breakout and confirmed if price holds above the trendline. A push above $15.50–$17.00 could unlock the full target at $24.88. As long as structure holds, this remains a strong trend reversal setup.

Nightly $SPY / $SPX Scenarios for May 1, 2025 🔮 Nightly AMEX:SPY / SP:SPX Scenarios for May 1, 2025 🔮
🌍 Market-Moving News 🌍
🇺🇸 Q1 GDP Contraction Raises Recession Fears
The U.S. economy shrank for the first time in three years, down 0.3% in Q1. Weaker government spending and a rise in imports ahead of Trump’s tariff policies are weighing on growth outlook.
📈 Big Tech Lifts the Market
Strong earnings from Microsoft ( NASDAQ:MSFT ) and Meta ( NASDAQ:META ) have boosted sentiment. Meta’s revenue guidance and capex surge point to aggressive growth positioning in AI and infrastructure.
🏛️ Treasury Refunding Outlook in Focus
Markets are watching the quarterly refunding announcement for clues on upcoming bond issuance. This could influence rate volatility as the Treasury balances deficits and market demand.
🌐 Risk-On Mood Despite Macro Headwinds
Global stocks notched a 4-week high as traders bet on resilient earnings and central bank policy steadiness, even as U.S. macro data softens.
📊 Key Data Releases 📊
📅 Thursday, May 1:
📈 Initial Jobless Claims (8:30 AM ET)
Tracks new unemployment filings – a key gauge of near-term labor market stress.
📈 Continuing Jobless Claims (8:30 AM ET)
Measures ongoing unemployment benefit recipients, reflecting persistent joblessness.
🏗️ Construction Spending (10:00 AM ET)
Reports monthly change in total construction outlays — a direct measure of real economy investment.
🏭 ISM Manufacturing PMI (10:00 AM ET)
Provides a snapshot of U.S. factory activity. Readings below 50 suggest contraction.
⚠️ Disclaimer:
This information is for educational and informational purposes only and should not be construed as financial advice. Always consult a licensed financial advisor before making investment decisions.
📌 #trading #stockmarket #economy #news #trendtao #charting #technicalanalysis

Thu 1st May 2025 GBP/USD Daily Forex Chart Sell SetupGood morning fellow traders. On my Daily Forex charts using the High Probability & Divergence trading methods from my books, I have identified a new trade setup this morning. As usual, you can read my notes on the chart for my thoughts on this setup. The trade being a GBP/USD Sell. Enjoy the day all. Cheers. Jim
