TAO ANALYSIS📊 #TAOAnalysis
✅There is a formation of Descending Channel Pattern in daily time frame in #TAO .
Also there is a perfect breakout and retest. Now we can expect a bullish move. If the price sustains the major resistance zone then we will see more bullish move
👀Current Price: $349
🎯 Target Price : $460
⚡️What to do ?
👀Keep an eye on #TAO price action and volume. We can trade according to the chart and make some profits⚡️⚡️
#TAO #Cryptocurrency #Breakout #TechnicalAnalysis #DYOR
Technical Analysis

GOLD WEEKLY - Key Events to Watch: ADP, Core PCE, Non-Farm📌 Weekly Gold Outlook – Key Events to Watch: ADP, Core PCE, Non-Farm Payrolls 📉📈
🌍 Fundamental Overview
Last week, gold faced heavy selling pressure after failing to sustain its rally above the $3,450 level. Easing concerns over the US–China trade tensions and a stronger US Dollar — supported by stronger-than-expected Durable Goods Orders — triggered a sharp correction in Price.
The US Federal Reserve (Fed) continues to adopt a cautious stance, awaiting clearer economic data before adjusting its monetary policy. Meanwhile, recent figures from both the US and China show signs of economic resilience, reducing safe-haven demand for gold in the short term.
Key Events This Week:
ADP Non-Farm Employment Change
Core PCE Price Index m/m
Non-Farm Payrolls (NFP)
Volatility is expected to rise sharply as these major economic indicators are released.
📊 Technical Analysis – XAU/USD 2H Chart
Gold is currently undergoing a corrective phase after its strong rally earlier this month. Price is forming a descending channel and consolidating around critical support and resistance zones.
Immediate Resistance: 3,325 – 3,377
Immediate Support: 3,275 – 3,235
As long as Price remains capped below 3,325, the bearish bias will remain dominant.
🧩 Main Scenarios for This Week
Short-Term Rebound:
Price may retest the 3,275–3,277 area before sellers regain control.
Medium-Term Bearish Pressure:
If Price fails to reclaim the 3,325 resistance zone, it could break lower toward 3,235, 3,197, and potentially deeper into the 3,108 or 3,066 liquidity zones.
Bullish Reversal Scenario:
A sustained breakout and close above 3,377 would invalidate the bearish outlook and suggest a move toward the 3,420 target.
🔍 Key Price Zones for This Week
Resistance: 3,325 → 3,377 → 3,420
Support: 3,275 → 3,235 → 3,197 → 3,108 → 3,066
🧠 Suggested Trading Strategy
Prefer short positions when Price retraces toward the 3,275 – 3,325 resistance zone, aiming for downside targets at 3,235 and 3,197.
Be cautious with long positions: only consider buying if Price drops deeply into 3,108 or 3,066 and shows strong support reaction.
⚡ Note:
Given the upcoming releases of ADP, Core PCE, and Non-Farm Payrolls, the market is expected to experience significant volatility.
Stay disciplined and await detailed intra-week updates around key event times.

#BTC #BTCUSD #BTCUSDT #BITCOIN #Update #Analysis #Eddy#BTC #BTCUSD #BTCUSDT #BITCOIN #Update #Analysis #Eddy
I have identified the important support and resistance areas of the weekly timeframe for you.
I have identified the important resistance prices for the start of the decline with the red line and the important support prices for the start of the growth with the green line.
This analysis is based on a combination of different styles, including the volume style with the ict style.
Based on your strategy and style, get the necessary confirmations for this analysis to enter the trade.
Don't forget about risk and capital management.
The responsibility for the transaction is yours and I have no responsibility for your failure to comply with your risk and capital management.
💬 Note: An important analysis will be presented on the lower timeframe on Bitcoin soon, which, based on the chart and explanations sent in that analysis, you can hunt for Bitcoin's decline by getting confirmation, pay attention to the current chart and consider important liquidity, including the Decision and Extreme areas.
Be successful and profitable.
For altcoins, proceed according to my analysis on the Total 3 chart.
My analysis of the Total 3 chart:
You can also view and review my previous analyses on my TradingView page.
Please don't forget to like and follow, your support encourages me to continue on my path and provide more analysis and updates.

NZDUSD Potential DownsidesHey Traders, in today's trading session we are monitoring NZDUSD for a selling opportunity around 0.60000 zone, NZDUSD is trading in a downtrend and currently is in a correction phase in which it is approaching the trend at 0.60000 support and resistance area.
Trade safe, Joe.

EURUSD: Detailed Support & Resistance Analysis 🇪🇺🇺🇸
Here is my latest support and resistance analysis for EURUSD
for next week.
Consider these structures for pullback/breakout trading.
❤️Please, support my work with like, thank you!❤️
I am part of Trade Nation's Influencer program and receive a monthly fee for using their TradingView charts in my analysis.

Ethereum Up 30% — But Is This the Start of a Trend Reversal..?Ethereum Up 30% — But Is This the Start of a Trend Reversal..?
Ethereum has seen a notable bounce this month, climbing approximately 30% from its local bottom of $1,400 to its current level around $1,800. While this rally might appear promising at first glance, a deeper look at the daily timeframe reveals a more cautious picture.
Despite the recent price surge, Ethereum remains technically in a **downtrend**. A well-respected downtrend continues to hold as resistance, and ETH is currently **retesting this trendline**. This point of contact now sets the stage for two potential scenarios:
**Scenario 1: Rejection from the Trendline**
If Ethereum fails to break above the trendline, it’s likely to face **rejection**, which could send the price back toward the $1,400 level. A revisit to this support zone would form a **potential double bottom**, a classic reversal pattern. If that plays out, we could then start to look for signs of a genuine trend reversal.
**Scenario 2: Breakout Above the Trendline**
On the other hand, if ETH manages to **break through the trendline**, that alone shouldn't be a green light to go long just yet. There’s a significant resistance level sitting around **$2,100**, which has previously acted as a ceiling for price action. A true breakout would require Ethereum not only to cross this level but also to **sustain above it for 2–3 days**. Only then could a long position be considered relatively safer, with upside targets extending to **$2,800** and even **$4,000**.
**Final Thoughts**
While the recent rally is encouraging, it's essential to remain cautious. The downtrend isn't officially over until key technical levels are cleared and held. Until Ethereum breaks above both the downtrend and the $2,100 resistance zone — and proves its strength with sustained movement — the **best strategy may be to sit on the sidelines** and let the market play out.
Patience often pays in crypto — and right now, **watching closely** could be the smartest move.

INJ Is Nearing An Important SupportHey Traders, in today's trading session we are monitoring INJ/USDT for a buying opportunity around 9.90 zone, INJ/USDT is trading in an uptrend and currently is in a correction phase in which it is approaching the trend at 9.90 support and resistance area.
Trade safe, Joe.

Surge Energy (SGY) Elliott Wave Outlook26/04/25 SGY Update
I’ve been long Surge Energy since Jan 24. Price did move higher initially following my entry but has since ground lower in what looks like an ending diagonal pattern in red C of a larger ABC zig zag correction. There is RSI divergence on the weekly time frame which helps the case that SGY could be bottoming, but that will of course be effected by what the price of oil does.
Any further downside on SGY I will be looking at the yellow zone which contains the 786 retracement at $3.9, measured move target of the red A wave at $3.28 & 886 retracement at $2.64. There is an ending diagonal invalidation level at $3.2, if this is tagged, I will need to adjust the current count.
The completion of Red C will complete the (X) wave of the higher degree (W)(X)(Y) in yellow, from these levels the (Y) wave target will be $16-$17.

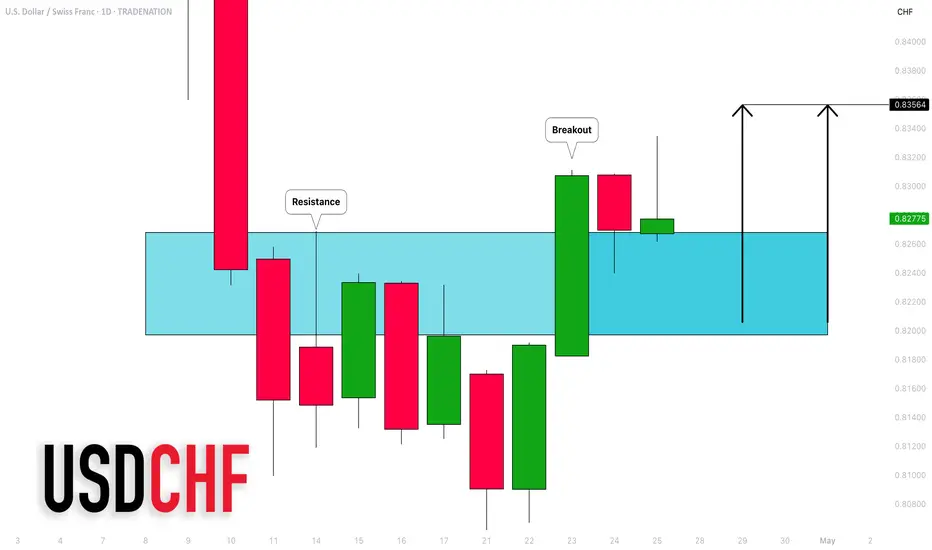
USDCHF: Important Breakout & Bullish Outlook Explained
USDCHF broke and closed above a key daily horizontal resistance area.
The broken structure most likely turned in a strong support.
I expect a bullish continuation from that next week.
Goal - 0.8356
❤️Please, support my work with like, thank you!❤️
I am part of Trade Nation's Influencer program and receive a monthly fee for using their TradingView charts in my analysis.
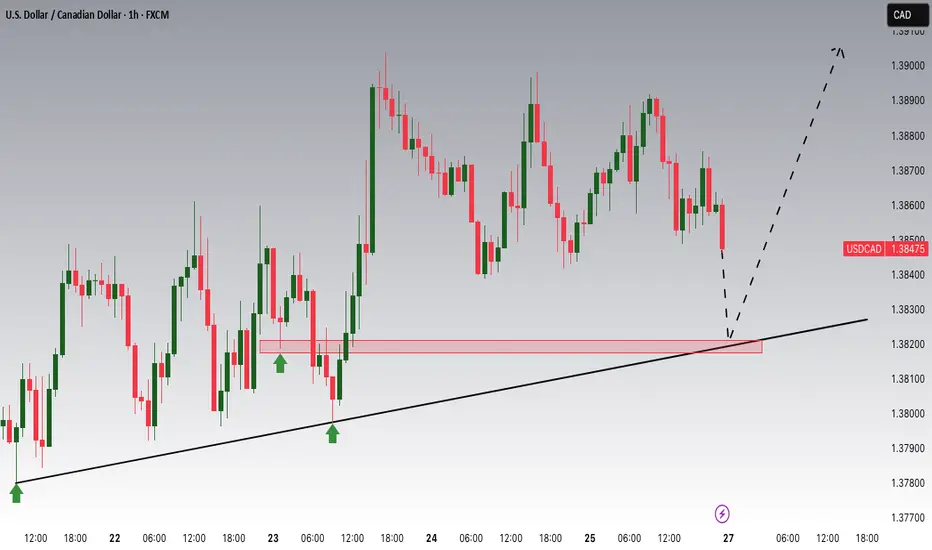
USDCAD Potential UpsidesHey Traders, in today's trading session we are monitoring USDCAD for a buying opportunity around 1.38200 zone, USDCAD is trading in an uptrend and currently is in a correction phase in which it is approaching the trend at 1.38200 support and resistance area.
Trade safe, Joe.
USDJPY: Bulls Eye Key Support as Trade Optimism Lifts DollarHey Traders, We are currently monitoring USDJPY for a potential buying opportunity as price approaches the 143.200 level, an important area that has acted as both support and resistance in recent sessions. Technically, the pair remains in a well-defined uptrend, and this pullback appears to be part of a healthy correction phase rather than a trend reversal. The 143.200 zone also aligns with a dynamic trendline support, increasing the likelihood of a bullish reaction if price holds above this level. From a fundamental perspective, recent developments have started to tilt in favor of the dollar. News of progress toward a trade agreement between the U.S. and India has sparked optimism, as it may lay the groundwork for similar deals with other key global partners. This has been compounded by unconfirmed reports out of China suggesting potential tariff exemptions in specific sectors, which has further boosted investor sentiment and triggered a broader “risk-on” shift in markets. As geopolitical tensions around trade show signs of easing, the U.S. dollar is regaining strength, fueling the case for further upside in USDJPY. Taken together, the convergence of technical support and improving macroeconomic signals presents a compelling opportunity for bulls, provided we see signs of price stability or a confirmed bounce near the 143.200 area.
Trade safe, Joe.

Bitcoin (BTC/USD) - Cup and Handle Breakout🔍 Pattern Identified: Cup ☕ & Handle 🏆 Pattern
🕒 Timeframe: 1-Hour Chart (1H)
💥 Breakout Level: Around $95,000
🎯 Projected Target: $97,073.75
📈 Technical Overview:
Bitcoin formed a rounded cup showing accumulation at lower levels.
After completing the cup, a small pullback (handle) indicated a healthy consolidation.
A strong breakout above the neckline resistance confirms the bullish pattern.
⚡ Actionable Insights:
As long as the price stays above the neckline, momentum remains positive.
A breakout generally leads to a strong continuation rally towards the projected target.
📊 Watch for volume confirmation for added strength.
⚠️ Caution if price slips back below the neckline – breakout may invalidate.
Disclosure: I am part of TradeNation's Influencer program and receive a monthly fee for using their TradingView charts in my analysis.

BTC ANALYSIS (update)📊 #BTC Analysis : Update
✅As we said earlier, #BTC performed same. Around 22% bullish move done after the analysis. Now we can see that #BTC is trading around a mmajor resistance. We could expect around 10% bullish move if it sustain above its major resistance area
👀Current Price: $94,590
🚀 Target Price: $1,04,476
⚡️What to do ?
👀Keep an eye on #BTC price action and volume. We can trade according to the chart and make some profits⚡️⚡️
#BTC #Cryptocurrency #TechnicalAnalysis #DYOR

COLPAL - Descending Channel Analysis | Key Resistance RejectionColgate Palmolive (NSE: COLPAL) is trading within a well-defined descending channel on the daily chart, indicating a sustained bearish trend. The stock recently tested the upper resistance zone of the channel near 2700–2750 and faced rejection, leading to a pullback. As long as the price remains below the resistance, the downside momentum towards the support zone near 2200–2300 may continue. A strong breakout above the channel resistance could signal a potential trend reversal. Traders should watch for confirmation before positioning.

Nokia:Inverted Head and Shoulders Structure + Retest of BreakoutOn the weekly chart of Nokia, a classic Inverted Head and Shoulders reversal pattern has formed. The breakout above the neckline occurred with increased volume, confirming the strength of the move. Currently, the price is undergoing a standard technical retest of the neckline from above — a typical phase before a potential continuation higher.
The structure remains active: the projected height (H) points to an initial target at $5.48, based on the distance from the neckline to the head. If momentum continues, Fibonacci extension targets are located at $6.18 (1.272), $6.55 (1.414), and $7.08 (1.618).
Technical view: the retest of the neckline is happening on declining volume, strengthening the probability of a bullish reversal. EMA 50/100/200 are beginning to align in a bullish crossover. The ascending channel structure also supports the upward movement.
Fundamentals: Nokia is progressing with its strategic programs in 5G and upcoming 6G network technologies, reinforcing its long-term growth prospects. Improved financial performance and the recovery in demand for telecommunications infrastructure amid global digitalization trends continue to support investor interest in the stock.
The Inverted Head and Shoulders pattern is confirmed by the breakout and current retest. As long as the price holds above the neckline, the bullish scenario toward $5.48 and beyond remains intact. This is a medium-term trend reversal structure — strong setups like this form the foundation for major moves. Don’t miss them.

Berger Paints at Make-or-Break Point:Descending Triangle PatternBerger Paints is currently testing the upper boundary of a long-term Descending Triangle on the weekly chart — a pattern known for sharp breakouts or breakdowns.
📊 Resistance Zone: 600 – A breakout above this level could trigger a powerful upside rally towards 825+, supported by the pattern's height projection.
🔻 Support Level: 543 – A breakdown below this level may lead to a sharp fall towards 400 levels.
⚠️ Bearish Pin Bar Candle at resistance signals caution; confirmation is key before entering any trade.
📌 Watch closely for a decisive move – this zone is critical for trend reversal or continuation.
This setup offers a high-reward opportunity for positional traders, with clear entry and exit zones. Manage your risk wisely and follow with volume confirmation.

CTSI Breaks Major Downtrend – Is the Next Leg Up Here?CTSI/USDT – Bullish Breakout in Play
CTSI has broken out of a long-term descending trendline, signaling a major shift in market structure. After reclaiming the $0.063–$0.068 resistance zone as support, bulls are clearly in control.
Key Highlights:
✅ Downtrend broken after months of lower highs.
✅ Minor resistance flipped to support, confirming strength.
✅ RSI at 75.62 shows strong bullish momentum.
✅ Structure is now forming higher highs and higher lows — a key trend reversal sign.
🎯Upside Targets:TP1: $0.085
TP2: $0.110
Support to hold: $0.063
CTSI is gaining momentum — if support holds, the next leg up could be explosive.

EURUSD Potential UpsidesHey Traders, in today's trading session we are monitoring EURUSD for a buying opportunity around 1.13400 zone, EURUSD is trading in an uptrend and currently is in a correction phase in which it is approaching the trend at 1.13400 support and resistance area.
Trade safe, Joe.

SOL ANALYSIS🔮 #SOL Analysis 🚀🚀 Update
💲💲 As we said #SOL performed the same. #SOL is trading in a Ascending Broadening Wedge Pattern and there was a breakdown of the pattern. Now we can expect a breakout of the resistance and a bullish move
💸Current Price -- $151
⁉️ What to do?
- We have marked crucial levels in the chart . We can trade according to the chart and make some profits. 🚀💸
#SOL #Cryptocurrency #DYOR

GBPUSD Potential UpsidesHey Traders, in today's trading session we are monitoring GBPUSD for a buying opportunity around 1.32600 zone, GBPUSD is trading in an uptrend and currently is in a correction phase in which it is approaching the trend at 1.32600 support and resistance area.
Trade safe, Joe.

Gold Retreats After Trump Confirms China Talks 📌 Gold Retreats After Trump Confirms China Talks – Political Noise Drives Volatility 🧨📉
Gold (XAU/USD) saw a sharp intraday drop following comments from President Trump, who confirmed that trade talks with China are “ongoing” — despite China denying any official negotiations had taken place. The market interpreted this as a signal of de-escalation, prompting a short-term price correction.
Gold had previously rallied past $3,500/oz, supported by a weaker USD and strong demand from bargain hunters after last week’s sharp decline. However, the current political contradictions and tariff headlines are creating erratic moves across all asset classes.
🌍 Fundamental Context
The USD weakened, stocks lost momentum, and risk sentiment shifted after a confusing round of statements from the US and China.
Meanwhile, US jobless claims rose slightly, reflecting a resilient labour market amid tariff-related headwinds.
Today’s Core Retail Sales data in the US could add more volatility heading into the weekly candle close.
It’s Friday — expect possible liquidity sweeps and aggressive price spikes as the market prepares for weekend risk-off moves.
📊 Trading Outlook – 26 April
We're seeing signs of a tactical pullback, but long setups should be delayed until political headlines stabilise. Focus on intraday reaction zones — not aggressive positioning.
🔻 SELL ZONES
3384 – 3386
• SL: 3390
• TP: 3380 → 3376 → 3372 → 3368 → 3364 → 3360 → ???
3406 – 3408
• SL: 3412
• TP: 3400 → 3396 → 3392 → 3388 → 3384 → 3380 → 3370 → 3360
🟢 BUY ZONES
3288 – 3286
• SL: 3282
• TP: 3292 → 3296 → 3300 → 3304 → 3310
3270 – 3268
• SL: 3264
• TP: 3274 → 3278 → 3282 → 3286 → 3290
🛡️ Final Notes & Strategy
Avoid rushing BUY entries — allow Price to complete its corrective phase and wait for structure and confirmation.
Today’s Core Retail Sales (US) could trigger a fresh wave of volatility.
It’s also weekly close Friday, so prepare for potential false breaks and stop hunts.
✅ Stick to your TP/SL. Protect your capital first — clarity will come when the dust settles.
💬 Are you watching for a short-term bounce or planning to fade strength near resistance? Let us know in the comments below! 👇👇👇

USDJPY - Analysis and Potential Setups (Intraday- 25.04.25)Overall Trend & Context:
This pair is in an overall uptrend and has reacted off the 140.00 support levels (as well as the 200 EMA on the Daily chart).
Technical Findings:
Price is trading above 25, 50,100 and 200 EMA's on intraday charts.
Powerful break of structure which leaves no question about bullish force.
Current consolidation - Demand needs to be built before continuation.
Notes:
Price is currently at a historic support level however has not closed above daily supply, we are still in the area of doing so.
Manage your risk, take the trade with confirmations only.

USOIL Potential UpsidesHey Traders, in today's trading session we are monitoring USOIL for a buying opportunity around 60.80 zone, USOIL is trading in an uptrend and currently is in a correction phase in which it is approaching the trend at 60.80 support and resistance area.
Trade safe, Joe.
