TSLA - Up ChannelAn Up Channel on TSLA
This is on the Weekly timeframe.
I expect another move up towards the top of the channel.
Moves up in the grey rectangles.
Bullish long.
Tesla

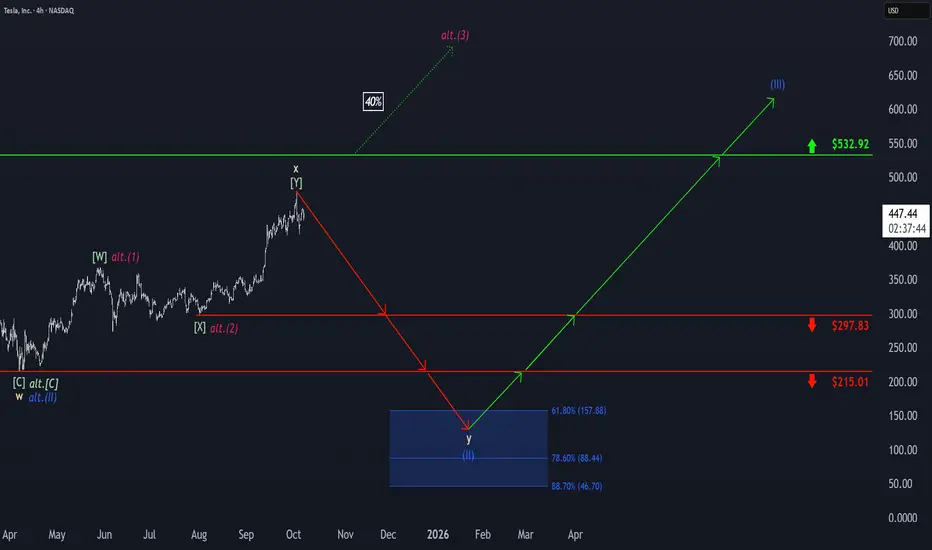
Tesla: Top Established!Tesla initially hit a new high before quickly reversing course with a notable move to the downside. As a result, we now view the corrective upward movement of beige wave x as complete and anticipate further sell-offs as part of wave y. The stock is expected to gradually break below the support levels at $297.83 and $215.01, ultimately reaching our blue Target Zone between $157.88 and $46.70, which we have identified for the final corrective low of blue wave (II). However, there remains a 40% chance that TSLA will not reach the blue zone at all but instead will break out directly above resistance at $532.92. In this case, we would consider blue wave alt.(II) already complete and locate the stock in a sustained (magenta) upward impulse. Even in our primary scenario, the new uptrend of the regular wave (III) is ultimately expected to surpass the $532.92 resistance.
Here is the Palantir / Telsa Fractal on current 15 min timeframeFractals are a mathmatical anomaly, if you understand linear equations (and believe the market is "random"). All assets are doing the same patterns over and over, on all time frames. You just need to see it for what it is.
May the trends be with you.
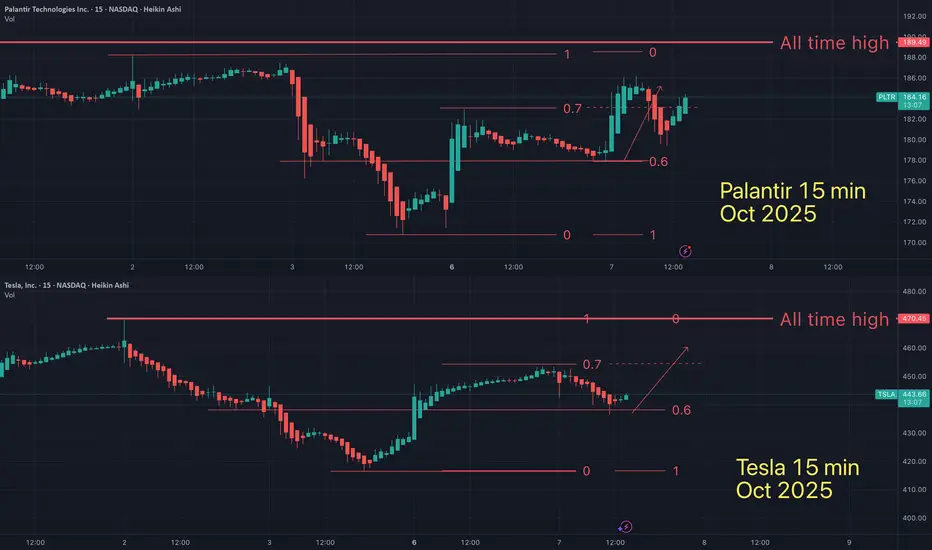
Is this Tesla / Palantir fractal showing both will hit ATH soon?Fractals are a mathmatical anomaly, if you understand linear equations (and believe the market is "random"). All assets are doing the same patterns over and over, on all time frames. You just need to see it for what it is.
May the trends be with you.

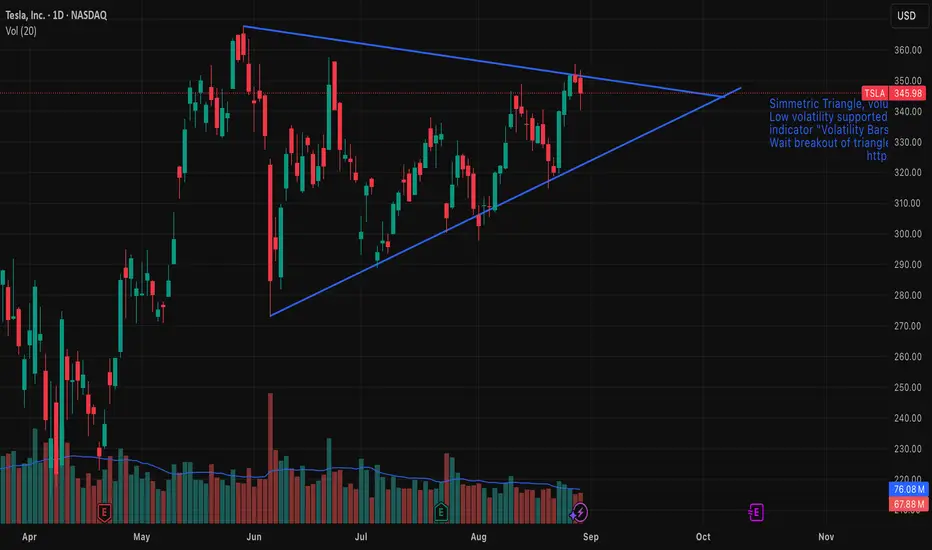
Tesla (TSLA) — Symmetrical Triangle Breakout IdeaSummary
Pattern: Symmetrical triangle on daily chart.
Expected timeframe for breakout: Within 1–2 weeks.
Targets: $367 on an upside breakout; $273 on a downside breakout.
Risk management: Use a stop-loss just outside the triangle after breakout confirmation; position size per your risk rules.
Setup & Rationale
A well-defined symmetrical triangle has formed on TSLA’s price action, characterized by converging trendlines connecting lower highs and higher lows. Volume has contracted inside the pattern, consistent with consolidation. Symmetrical triangles are neutral continuation/reversal patterns; the breakout direction provides the trading signal.
Key technical points:
Price is approaching the apex, increasing the likelihood of a decisive breakout in the next 1–2 weeks.
Volume decline during the consolidation and a volume spike on breakout would confirm conviction.
The breakout should be taken after a daily close beyond the upper or lower trendline (or after a retest), not merely intraday probes.
Entry Criteria
Upside trade: Enter long on a daily close above the upper trendline (or on a confirmed retest).
Downside trade: Enter short on a daily close below the lower trendline (or on a confirmed retest).
Targets & Measurement
Measure the pattern height (vertical distance between the initial high and low of the triangle) and project it from the breakout point.
Upside target (projected): $367.
Downside target (projected): $273.
Adjust targets proportionally if you use a measured move from the actual breakout point rather than the pattern’s maximum height.
Stops & Risk Management
Place stop-loss slightly outside the opposite trendline or beyond a recent swing point to avoid false breakouts.
Preferred approach: fixed-risk percent per trade (e.g., 1–2% of portfolio) and scale position size accordingly.
Consider tightening stops to breakeven after price clears ~50% of the distance to the target.
Confirmation: daily close beyond trendline plus above-average volume (up or down depending on direction).
Symmetrical triangles are neutral; false breakouts occur. Wait for confirmation.
News, earnings, or market-wide events can invalidate technical setups quickly—monitor catalysts.
Adjust targets/stops if volatility expands or if the breakout lacks volume confirmation.
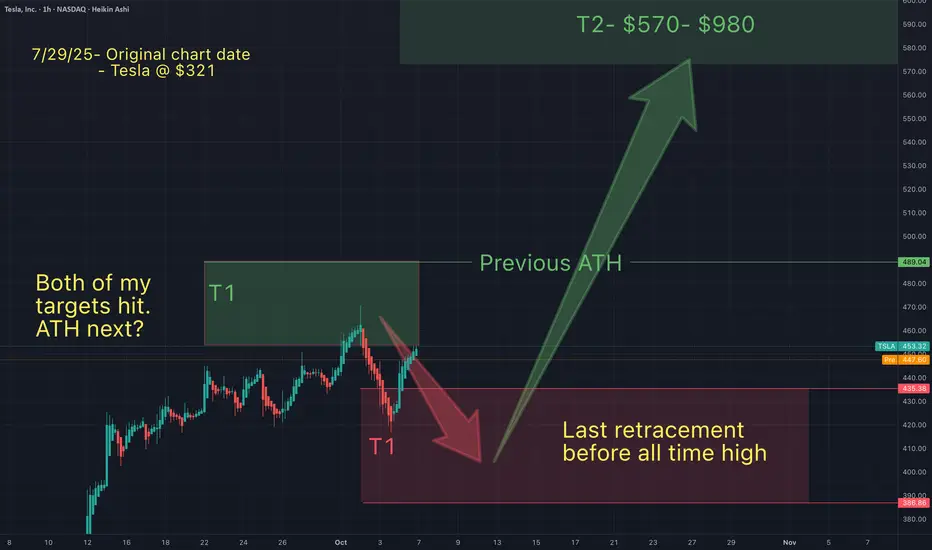
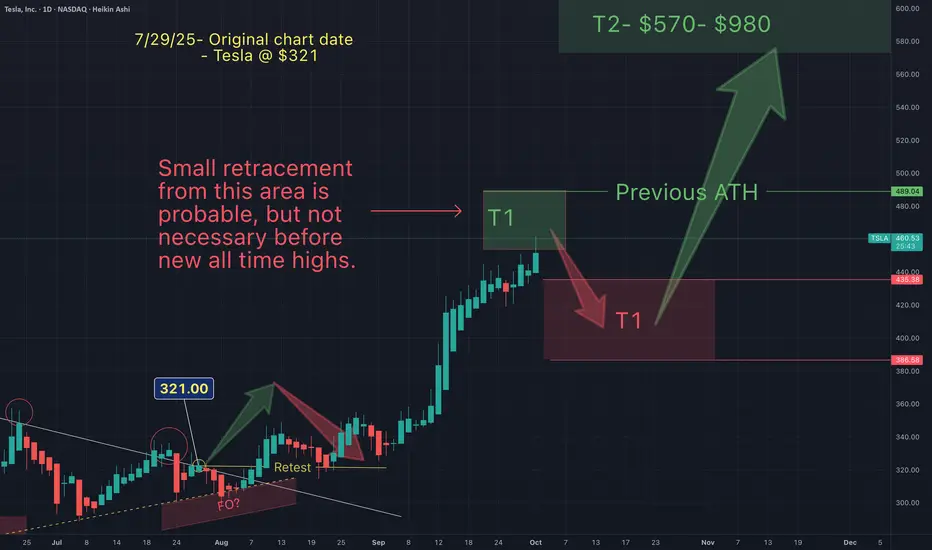
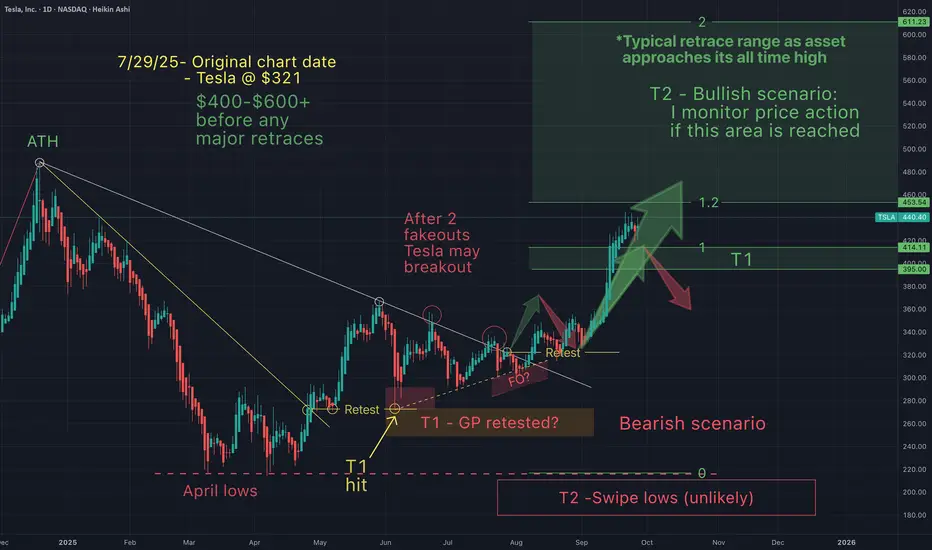
You will ask yourself "how did he know Tesla would do that"?On July 29th I suggested Telsa would follow a predicatble path. Price action has unfolded as anicipated every step of the way.
After a long run up, on Oct 1st I suggested that Tesla had topped at my green T1 and would retrace into my red support zone and bonce.
Now that this has played out, the only question that remains is Tesla going lower into my red T1...or simply all time highs from here?
Either way, Tesla may be about to melt faces (few & small retracements). For the next 2-10 weeks Tesla may form a blow off top (*"IF" Telsa continues this pattern). This blow off, will be the end of this bull pattern that I have been following since the April lows. Once Tesla hits my next range ($570-980) I expect a huge dump. I will monitor price action closely, once Tesla is in this next range.
May the trends be with you.
TESLA PRICE ACTION 5th OCTOBER 2025Price action for Tesla is here. I have clearly explained my plan on how to trade tesla considering every factor in market.
NOTE: OPTION WILL BURN YOUR CAPITAL

Tesla (TSLA) – Final Wave 5 to Complete Cypher HarmonicTesla is progressing through its final impulsive Wave 5, with upside targets aligning at $563–$564, confluencing with the 1.272–1.618 Fib extensions and the completion of the Cypher harmonic (point D). Once this target is reached, a corrective decline is anticipated, forming the Cypher retracement and potentially filling untested gaps below.
Key levels to watch:
Upside target: $488.5, then $563–$564 zone (Cypher completion).
Downside retracement: possible move back toward the $350–$360 region (0.618–0.786 support).
Invalidation:
A breakout above $565 would invalidate the Cypher completion zone and suggest extended bullish continuation.
A breakdown below $400 before reaching $488 invalidates the Wave 5 structure.
This scenario blends Elliott Wave 5 projections with harmonic Cypher confluence for a potential high-probability setup.

Why DraftKings (DKNG) Stock Could Reach $57 by End of 2025DraftKings Inc. (NASDAQ: DKNG), a leading U.S. online sports betting and iGaming operator, is positioned for potential upside to $57 per share by December 31, 2025, based on analyst consensus, robust growth projections, and market tailwinds. As of early October 2025, the stock trades around $42–$43, implying roughly 32–36% appreciation from current levels. This target aligns closely with the average analyst price target of $57.57 (from 30 reports), which reflects a "Strong Buy" consensus (1.25 ABR on a 1–5 scale, with 26 buys, 0 holds, 0 sells).
Below, I'll outline the key drivers, supported by recent data.1. Strong Revenue and Profitability Guidance for FY 2025 DraftKings has guided for FY 2025 revenue of $6.2–$6.6 billion (31% YoY growth at midpoint) and adjusted EBITDA of $900 million–$1.0 billion, reaffirming prior estimates after Q3 2024 results (revenue up 39% YoY to $1.095 billion).
2 sources
This trajectory is fueled by:User Growth and Engagement: 41% YoY increase in monthly unique payers in Q3 2024, with average revenue per user rising due to enhanced in-play betting and NBA/iGaming expansions.
Market Share Gains: DraftKings holds ~35% of U.S. online sports betting handle, benefiting from NFL/NBA seasons and new launches (e.g., Missouri pending approval).
Analysts like those at Goldman Sachs note the company's "resilience in online gambling during economic downturns" and positive momentum in customer acquisition, supporting EBITDA beats.
Metric
FY 2024 Guidance (Updated)
FY 2025 Guidance
YoY Growth (Midpoint)
Revenue
~$4.7B
$6.2–$6.6B
+31%
Adjusted EBITDA
$240–$280M
$900M–$1.0B
+250%+
This path to profitability (positive free cash flow expected in 2025) reduces valuation discounts, with forward P/S multiples at ~3.5x (below peers like Flutter at 4x).2. Analyst Optimism and Price Target Momentum Wall Street's consensus points to $57 as achievable, with recent upgrades reflecting confidence in 2025 holds (11–13% in Q1 2025) and parlay/in-play product strength.
Key updates:Zacks: $57.57 average (high $68, low $35), +49.77% upside from ~$38 close.
TipRanks: $54.25 average, 26.93% upside; 53 buys in the past month.
Recent Raises: Truist ($60), Oppenheimer ($65), Piper Sandler ($60), Stifel ($57), JMP ($60), Barclays ($60).
Citizens JMP ($60) cites "materially shifted investor sentiment" post-Q4 2024 beats.
JPMorgan (Overweight, $50 PT) highlights digital gaming's insulation from macro risks like tariffs, unlike land-based peers.
2 sources
High-end forecasts (e.g., $65–$70 from independent models) assume sustained 17–20% revenue CAGR through 2027, driven by iGaming expansion.
3. Strategic Tailwinds and Market ExpansionRegulatory Wins: Full U.S. rollout in 25+ states, plus Jackpocket lottery integration (adding $200M+ revenue potential). Missouri launch could add 2–3% to FY 2025 top line.
Partnerships: Multi-year NBCUniversal deal for sports sponsorships boosts visibility; Larry Fitzgerald Foundation tie-up enhances brand.
Product Innovation: Live betting features and NFT marketplace (DraftKings Marketplace) drive retention; Q3 2025 NFL metrics show 12–14% YoY handle growth in key states like New York.
Macro Resilience: Online gaming weathers consumer slowdowns better than physical casinos, with 37% Q2 2025 revenue growth despite headwinds.
Potential Risks to ConsiderWhile bullish, challenges include:Hold Volatility: Early 2025 NFL outcomes could pressure Q3/Q4 EBITDA (e.g., customer-friendly results trended low per analysts).
Competition: Prediction markets (Kalshi/Polymarket) pose niche threats, prompting a Northland downgrade to Underperform.
2 sources
However, Benchmark and Jefferies counter this with Buy ratings ($53–$54 PT), emphasizing DraftKings' scale.
2 sources
Taxes/Regulation: Higher state taxes (e.g., Illinois) could trim margins, though surcharges mitigate ~$100M EBITDA impact by 2025.

TSLA – Watching for Wave 3 Extension Toward 455–460 Zone Tesla (TSLA) is completing a contracting triangle (ABCDE) as wave (iv), setting up for a potential wave (v) of 3. With delivery numbers scheduled for Thursday, momentum could build into the report, creating a rally toward the 455–460 zone, which also aligns with channel resistance and the 1.618 extension. This would complete a ABCD harmonic pattern.

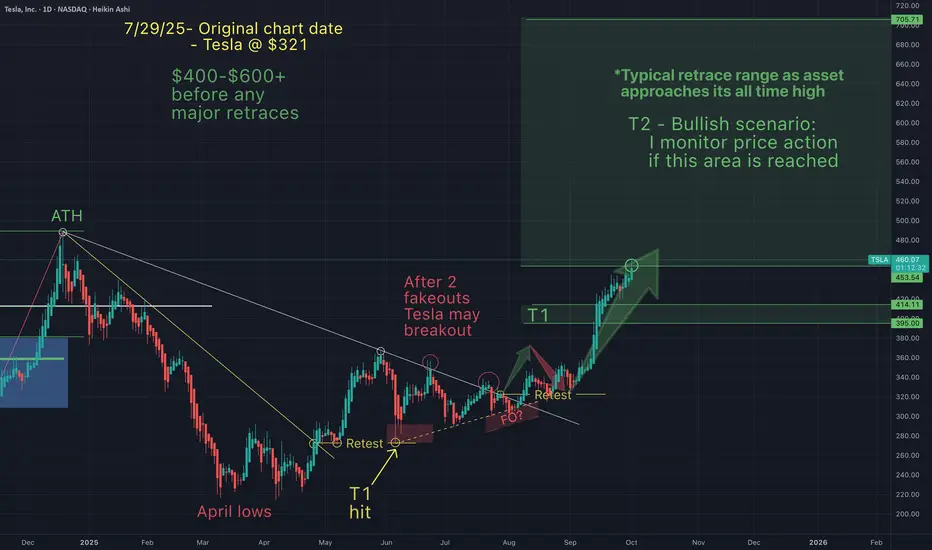
Telsa - NEW ALL TIME HIGHS INCOMING (price action simplified)Here's a simplified version of my short term targets. On July 29th Tesla was around $321 and I suggested that after a long downtrend, Tesla would breakout, retest and continue up ("without any major retraces)", to between $400-$600.
Tesla has now hit my T2 (currently $460) and I am anticipating a small retracement, before new all time highs in the near term.
Congrats to all of you who have made gains from my charts.
May the trends (continue) to be with you.
Tesla - NEW ALL TIME HIGH INCOMING (small pullback first?)On July 29th Tesla was around $320 and I suggested that after a long downtrend, Tesla would breakout, retest and continue up ("without any major retraces)", to between $400-$600.
Tesla has now hit my T2 (currently $460) and I am anticipating a small retest before new all time highs in the near term.
Congrats to all of you who have made gains from my charts.
May the trends (continue) to be with you.
Tesla - Here we goooooo!🚗Tesla ( NASDAQ:TSLA ) is finally breaking out:
🔎Analysis summary:
Finally, after a consolidation of four years, Tesla is attempting another all time high breakout. With the bullish triangle coming to an end, bulls are dominating this stock. It just comes down to the next couple of months but a triangle breakout remains far more likely.
📝Levels to watch:
$400
SwingTraderPhil
SwingTrading.Simplified. | Investing.Simplified. | #LONGTERMVISION

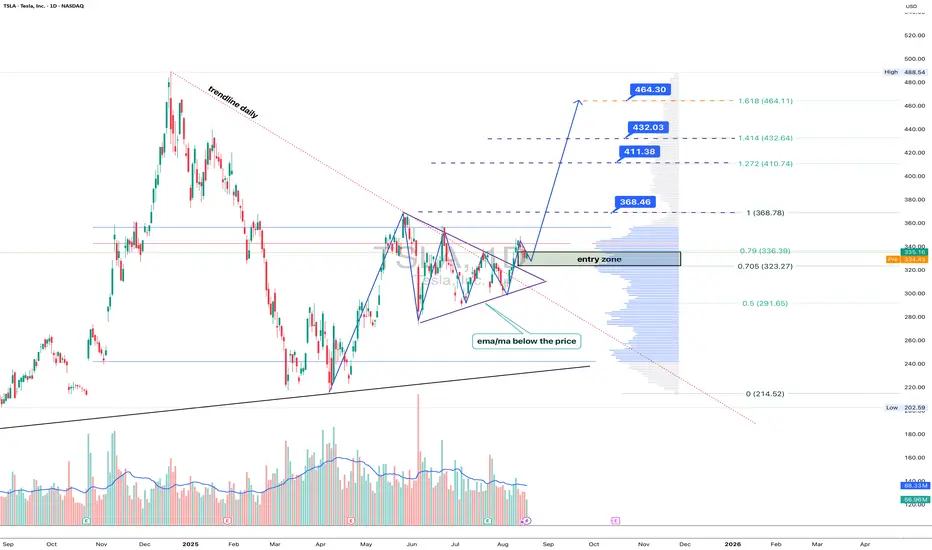
Tesla: breakout mode, Elon’s rocket fuel for the chartTechnically , Tesla broke out of a symmetrical triangle while holding above EMA/MA supports, which confirms bullish control. The breakout unlocks targets at 368.46 (Fibo 1), followed by 411.38, 432.03, and the 1.618 extension at 464.30. Volume profile confirms strong accumulation below, leaving the upside path less crowded.
Fundamentally , Tesla keeps investor attention alive. EV sales stabilized, but the focus has shifted to AI and robotaxi — Musk’s latest promises of disruption. With Fed rates peaking and yields easing, growth stocks regain momentum. Risks remain from Chinese competitors, yet Tesla’s margins are still leading the industry.
Tactical plan : entry zone stands at 323–336. As long as price holds above it, buyers target 368.46 → 411.38 → 464.30. A break below 323 would flip the bias back toward 291.
Bottom line: Tesla’s chart looks ready for lift-off. Musk might be dreaming of Mars, but for now, bulls are happy if he just launches the stock a few hundred dollars higher.
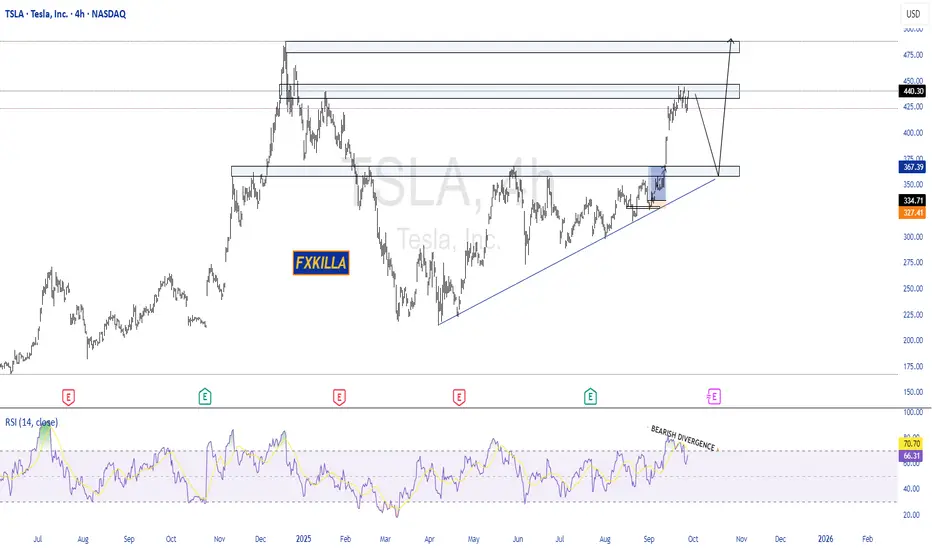
TESLA HIGH PROBABILITY SETUPS SOON!!!🚨 TESLA HIGH PROBABILITY SETUPS 🚨
* Here We Can See The Next Potential Moves For TSLA Coming Hours/Days.
* Keep Your Eyes Close On Your Trading Positions.
* Happy PIP Hunting Traders.
FXKILLA.
TESLA: Short Trading Opportunity
TESLA
- Classic bearish formation
- Our team expects pullback
SUGGESTED TRADE:
Swing Trade
Short TESLA
Entry - 440.32
Sl - 443.84
Tp - 432.53
Our Risk - 1%
Start protection of your profits from lower levels
Disclosure: I am part of Trade Nation's Influencer program and receive a monthly fee for using their TradingView charts in my analysis.
❤️ Please, support our work with like & comment! ❤️

Tesla bullish 📊 NASDAQ:TSLA Weekly Chart – Sept 27, 2025
Tesla is pushing higher, now trading at $440.40 (+4.02%), challenging major resistance levels.
🔴 Key Resistance Zones:
$488–$495 → Multi-top rejection zone
$580 → Macro resistance (2021 highs)
Watch for potential rejection unless strong volume confirms breakout
🟢 Strong Support Levels:
$420 / $400 / $390 → Key short-term demand
$332 / $322 → Previous resistance flipped to support
$288 / $259 / $247 → High confluence support cluster
Long-term trendline still intact (white diagonal line)
⚠️ If $488 breaks, TSLA could revisit $580
✅ Holding $420–$400 keeps bulls in control
📉 Below $332 could trigger broader pullback
#TSLA #Tesla #Stocks #Trading #TechnicalAnalysis #Investing #NASDAQ

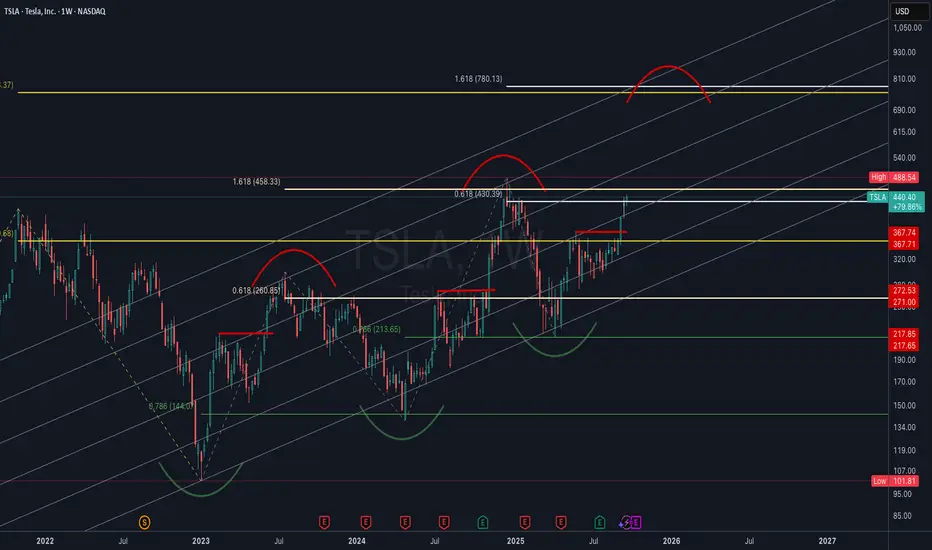
TSLA Weekly | Log Channel Analysis with Fibonacci ConfluenceThis chart presents Tesla (TSLA) on the weekly timeframe, plotted in logarithmic scale using a custom trend channel (not a pitchfork). The analysis combines price structure with key Fibonacci retracement and extension levels to highlight major inflection points in Tesla’s long-term trend.
Channel Structure: The log channel has consistently guided price swings, showing respect for both upper and lower boundaries across multiple cycles. This provides a framework for projecting potential tops and bottoms.
Fibonacci Confluence:
• Price is currently reacting around the 0.618 retracement ($430) from the previous major swing, a historically significant level for Tesla.
• Upside targets align with the 1.618 extensions ($753–$780), creating a strong confluence zone for a potential long-term resistance.
• Key downside supports sit at $367, $272, and $218, each coinciding with fib retracements and historical pivot zones.
Market Structure: The chart highlights repeating rounded top and bottom formations, suggesting cyclical behavior in Tesla’s price action. Rounded bottoms have historically marked accumulation zones, while rounded tops have aligned with distribution phases.
Current Outlook: After reclaiming the mid-channel region and pushing through significant resistance, Tesla is now at a pivotal stage. A confirmed breakout above $488 could open the path toward the higher channel range and eventual fib targets. Failure to hold $430, however, risks a retrace back to $367 or lower channel support.
You will ask yourself "how did he know Tesla would do that"?On July 29th Tesla was $321 and I suggested (after a breakout & retest) Tesla would pump straight to low $400s (without any retraces). Now that the trading week has closed here's an update:
Things are still going according to what I expected. But how is this possible...I don't have a crystal ball! How could I have predicted this even *before Elon claimed to have invested 1B into Tesla?
Did Elon know something that we didn't or did I know something you didn't?
Is it the "narative" or the ongoing, repeating, predicable chart patterns?
TA works!
TESLA Set To Fall! SELL!
My dear friends,
TESLA looks like it will make a good move, and here are the details:
The market is trading on 440.30 pivot level.
Bias - Bearish
Technical Indicators: Supper Trend generates a clear short signal while Pivot Point HL is currently determining the overall Bearish trend of the market.
Goal - 432.72
Recommended Stop Loss - 444.15
About Used Indicators:
Pivot points are a great way to identify areas of support and resistance, but they work best when combined with other kinds of technical analysis
Disclosure: I am part of Trade Nation's Influencer program and receive a monthly fee for using their TradingView charts in my analysis.
———————————
WISH YOU ALL LUCK

Can $TSLA push to new highs?TSLA looks like it's still bullish as it retested this support level and is now pushing back above it.
I think it's possible that we see a large move, potentially up to the $600 levels, but I've marked off key resistances to the upside as well incase we stop before that.
Let's see how it plays out over the coming weeks.

TESLA - Expected drop to 350 area following newswassup guys its Tommy here, its been a while i know.
With less time on my hands to scalp gold as i did, i have been looking at stocks and applying my skills in different areas like swing trading and investing short and long term.
Its easier on the mind for me as i can research in my own time and not a slave to the charts as i once was.
Tesla has faced some news today of the new model Y problems and falling of european sales, along with hitting major resistance, i think we can come down to lower prices.
I have shares in tesla that i will be selling at this price and leaving the majority in just in case.
Should we get the pull back to 350 i will buy again.
Hope you're all good out there my beloved gold gang! im coming back for you soon
Tommy <3

Tesla - SHOW ME THE CHART AND I WILL TELL YOU THE NEWS!Back in June and July, Elon and Tesla were STILL getting a lot of bad press (Elon fighting with President Trump, people burning Tesla cars etc). Those that follow me may recall on July 29th I wrote the following:
"Tesla just needs a narrative shift (ie -new invention etc), & price action changes in a heart beat.
Yet, price action really has less to do with the news making Elon a hero, then a villain and then back and forth...but moreso to do with price action patterns that just keep repeating".
And you'll note that my July chart suggested that the huge pump to $400+ would begin around Sept 1st (Huge green arrow after the retest). What a coincidence that 2 weeks later Elon announces a $1Billion dollar Tesla stock buy (the new anticipated "narrative"). My huge green arrow was there many weeks before this "news". How could I have known?
SHOW ME THE CHART AND I WILL TELL YOU THE NEWS.
On July 29th Tesla was $321 and I suggested that Tesla was about to have a major breakout to at least $400 "with no major retraces". That target has now been hit. Is it because of the news or is it the patterns that just keep repeating?
My T1 targets are probable targets, so I anticipate them almost always getting hit. My ideal buy and sell targets are T2. Tesla now appears to be headed into my T2 target, so it's time to start monitoring price action closely.
