TESLA WILL KEEP GROWING|LONG|
✅TESLA is going up
Now and the stock made a bullish
Breakout of the key horizontal
Level of 346.00$ and the breakout
Is confirmed so we are bullish
Biased and we will be expecting
A further bullish move up
LONG🚀
✅Like and subscribe to never miss a new idea!✅
Tesla

Tesla, Nio, XPEV breakout ahead of NVdA earnings tomorrowTesla is breaking out of a daily chart wedge pattern.
This pattern suggest a move to 400 could occur as long as the indices don't fall on NVDA earnings.
If you look at how some of the China ADR EV companies have performed, Tesla could be well on its way to replicating a move.
All eyes on NVDA earnings tomorrow. Heading into the print with a 58 PE and looking like it wants new highs.
NVDA guidance will once again be crucial for the market. $46B revenue estimate is likely to be beat.
We secured profits on the massive nuclear pop today. SMR calls printed over 100%

TESLA Will Collapse! SELL!
My dear friends,
Please, find my technical outlook for TESLA below:
The instrument tests an important psychological level 339.97
Bias - Bearish
Technical Indicators: Supper Trend gives a precise Bearish signal, while Pivot Point HL predicts price changes and potential reversals in the market.
Target - 332.22
Recommended Stop Loss - 344.40
About Used Indicators:
Super-trend indicator is more useful in trending markets where there are clear uptrends and downtrends in price.
Disclosure: I am part of Trade Nation's Influencer program and receive a monthly fee for using their TradingView charts in my analysis.
———————————
WISH YOU ALL LUCK
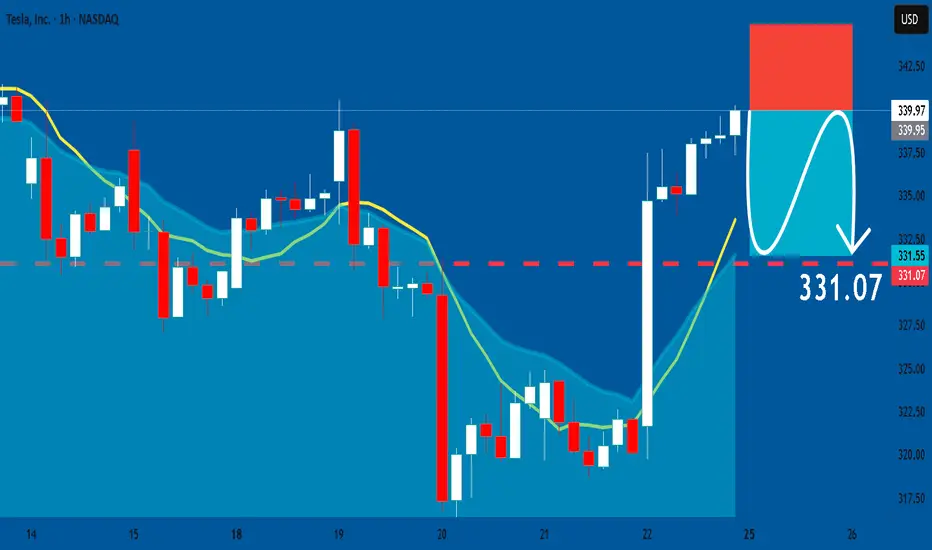
TESLA: Short Trading Opportunity
TESLA
- Classic bearish formation
- Our team expects fall
SUGGESTED TRADE:
Swing Trade
Sell TESLA
Entry Level - 339.97
Sl - 344.91
Tp - 331.07
Our Risk - 1%
Start protection of your profits from lower levels
Disclosure: I am part of Trade Nation's Influencer program and receive a monthly fee for using their TradingView charts in my analysis.
❤️ Please, support our work with like & comment! ❤️
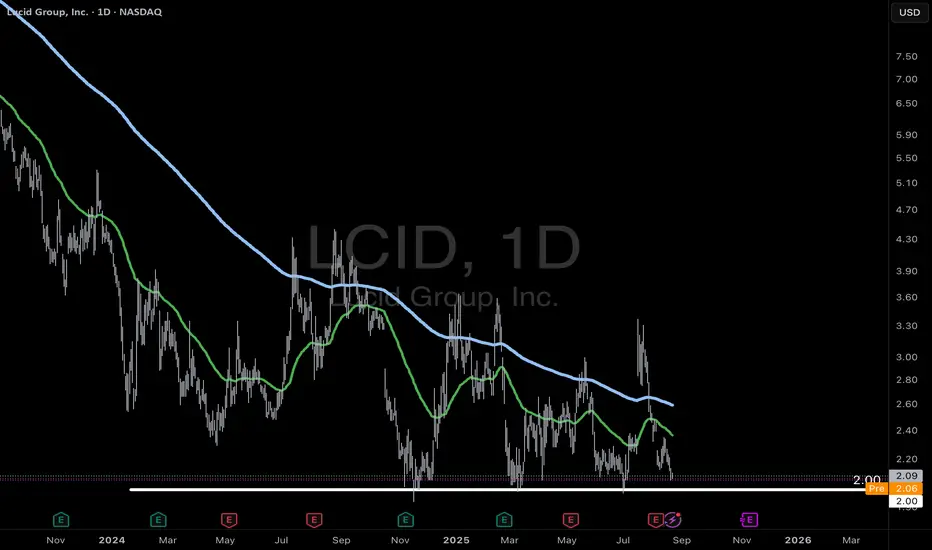
Lucid approaching the $2 support level?Will the $2 support level hold this time? Or will Lucid need to consider a reverse split to raise the stock price?
$TSLA looks "Cheap" but it can always get cheaperTSLA has been consolidating in a flag here. While price could break up out of it, I actually lean towards price breaking to the downside. The reason is because there have been more tests on the downside, and I think if price falls and tests it again, it'll break.
That and, if you turn on Heikin Ashi candles, it looks like bearish momentum is starting on higher timeframes (1D-4D) and Ichimoku giving bearish warning signals in the cloud formation.
I think the most likely outcome is that we break lower and go test the box below for a new low. Everyone would get bearish down there, but that will be a great level to buy for the long term.

TSLA (Tesla) LONG SET UPEntry Price 1: $324.00
Entry Price 2: $314.00
Stop Loss: $294.00
Take Profit 1: $340.00 (Close 25%)
Take Profit 2: $354.00 (Close 50%)
Take Profit 3: $368.00 (Close 75%)
Take Profit 4: $384.00 (Close 100%)

New Bear Market? Heavy Tech SelloffToday the markets were shattered by weakness in mega cap tech.
All major leading companies in the QQQ were severely down.
We saw the majority of the S&P 500 sectors green with health care leading the charge.
Despite all indices closing negative this was not a full fledge market sell.
Commodities were hit across the board. Gold, Nat gas, Oil, Uranium, Silver were all down.
It seems the market is de risking into J Powell Jackson Hole meeting on Thursday / Friday.
Today we closed out NASDAQ:MSFT NASDAQ:PLTR short & trimmed AMEX:MSOS puts for over 105%
We were very active on the option and swing trading side of the market.

Tesla, Inc. $TSLA ~ Very Concerning (Not much left)...Tesla, Inc. engages in the design, development, manufacture, and sale of electric vehicles and energy generation and storage systems. It operates through the Automotive and Energy Generation and Storage segments. The Automotive segment includes the design, development, manufacture, sale, and lease of electric vehicles as well as sales of automotive regulatory credits. The Energy Generation and Storage segment is involved in the design, manufacture, installation, sale, and lease of solar energy generation, energy storage products, and related services and sales of solar energy systems incentives. The company was founded by Jeffrey B. Straubel, Elon Reeve Musk, Martin Eberhard, and Marc Tarpenning on July 1, 2003 and is headquartered in Austin, TX.
TESLA My Opinion! BUY!
My dear subscribers,
My technical analysis for TESLA is below:
The price is coiling around a solid key level - 330.63
Bias - Bullish
Technical Indicators: Pivot Points Low anticipates a potential price reversal.
Super trend shows a clear buy, giving a perfect indicators' convergence.
Goal - 335.80
My Stop Loss - 327.44
About Used Indicators:
By the very nature of the supertrend indicator, it offers firm support and resistance levels for traders to enter and exit trades. Additionally, it also provides signals for setting stop losses
Disclosure: I am part of Trade Nation's Influencer program and receive a monthly fee for using their TradingView charts in my analysis.
———————————
WISH YOU ALL LUCK

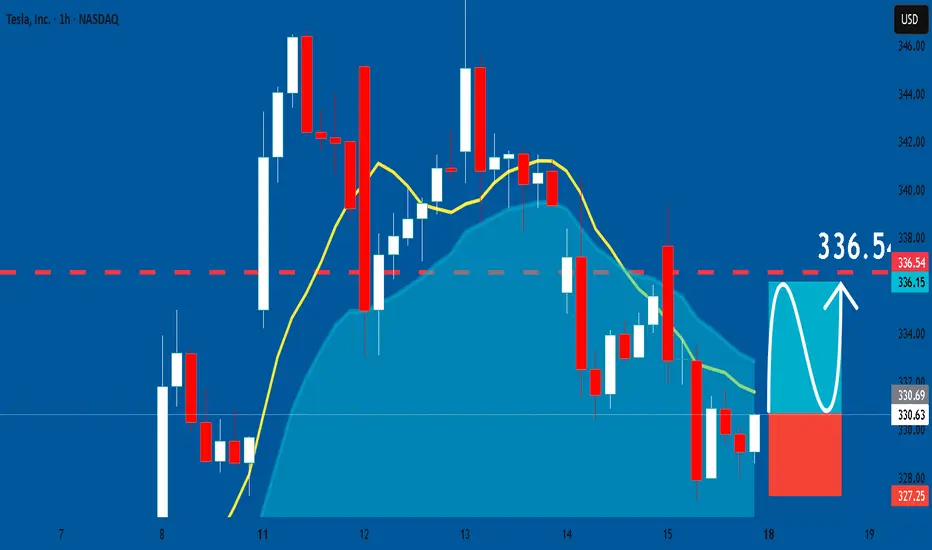
TESLA: Long Signal with Entry/SL/TP
TESLA
- Classic bullish formation
- Our team expects pullback
SUGGESTED TRADE:
Swing Trade
Long TESLA
Entry - 330.63
Sl - 327.25
Tp - 336.54
Our Risk - 1%
Start protection of your profits from lower levels
Disclosure: I am part of Trade Nation's Influencer program and receive a monthly fee for using their TradingView charts in my analysis.
❤️ Please, support our work with like & comment! ❤️
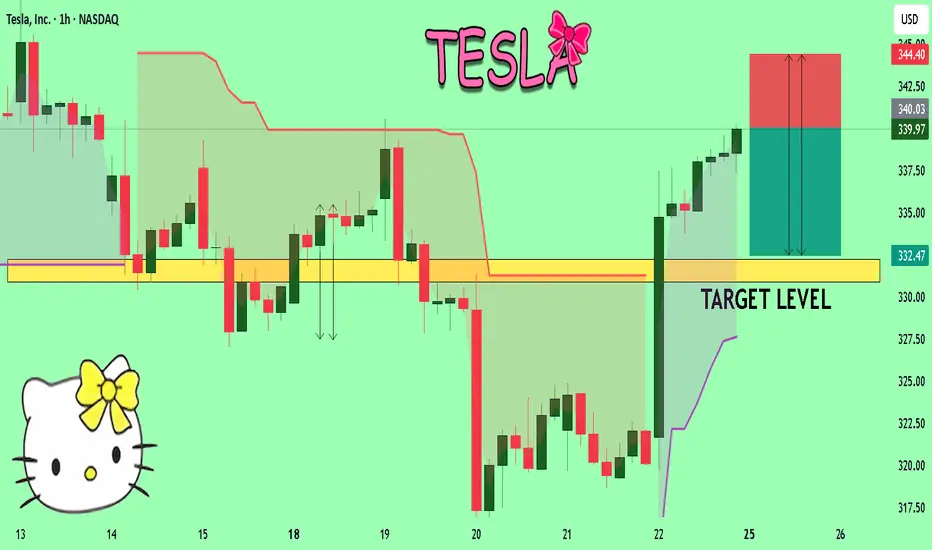
TESLA BREAKOUT -- TARGET LEVELSHello Traders! Tesla recently broke out of its wedge pattern, with price currently consolidating just outside the breakout trendline.
Price should continue to the upside based on the technicals.
I have charted the target levels for Tesla for an upside move.
Thanks everyone!
Tesla possible LongTesla’s recent breakout above the long-term descending trendline is a positive technical signal, suggesting that market sentiment may be shifting toward a bullish phase. However, the breakout lacks strong volume confirmation, leaving the possibility of a false breakout on the table.
The key battle zone now lies between USD 349.29 and 367.40 — if bulls can push and sustain the price above this range, the door opens for a larger rally toward the USD 400+ area. On the other hand, failure to hold above USD 331 would put the breakout at risk, potentially sending the price back into the USD 308–290 support zone.
In short, Tesla stands at a technical crossroads: momentum favors buyers, but confirmation through sustained price action and volume is essential before a strong uptrend can be confirmed.

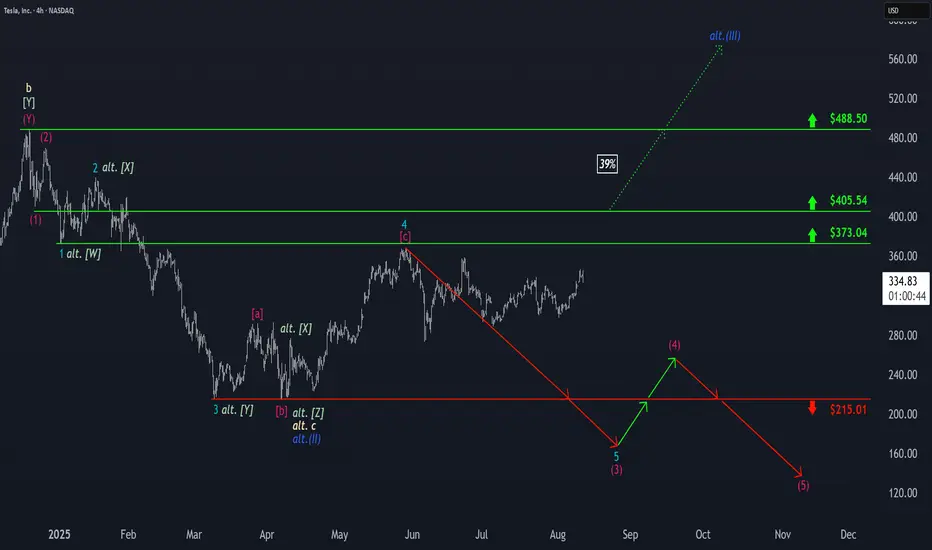
Tesla: Upward Pressure, but Bears May Soon Regain ControlTesla has once again faced upward pressure, which pushed the stock toward resistance at $373.04. However, our primary expectation is that the bears will soon regain control, setting off further sell-offs within the ongoing downward impulse. Step by step, this magenta five-wave move is expected to break below support at $215.01. If price moves above the $373.04 level, our alternative scenario will become significantly more relevant. If the stock even surpasses the higher threshold at $405.54, we will ultimately shift to this alternative view and classify Tesla as being in a sustained uptrend of blue wave alt.(III) , which would extend beyond $488.50. In this 39% likely scenario, wave alt.(II) would already be complete.
TSLA, Beyond the candlesPrice is bouncing off the support zone where a previous rebound signal was triggered.
A short-term overbought signal is more likely to appear if the market rallies sharply in the near term, but recent momentum in equities looks weak.
Adding a layer of technical analysis.

Can One Company Turn Global Tensions Into Battery Gold?LG Energy Solution has emerged as a dominant force in the battery sector in 2025, capitalizing on geopolitical shifts and market disruptions to secure its position as a global leader. The company's stock has surged 11.49% year-to-date to 388,000 KRW by August 12, driven by strategic partnerships and a pivotal $4.3 billion deal with Tesla for LFP battery supply from its Michigan facility. This partnership not only reduces Tesla's dependence on Chinese suppliers but also strengthens LG's foothold in the critical US market amid escalating trade tensions.
The company's strategic expansion in US manufacturing represents a calculated response to changing geopolitical dynamics and economic incentives. LG is aggressively scaling its Michigan factory capacity from 17GWh to 30GWh by 2026, while repurposing EV production lines for energy storage systems (ESS) to meet surging demand from renewable energy projects and AI data centers. Despite a global slowdown in EV demand, LG has successfully pivoted to capitalize on the booming ESS market, with Q2 2025 operating profits rising 31.4% to KRW 492.2 billion, largely attributed to US production incentives and strategic positioning.
LG's technological leadership and intellectual property portfolio serve as key differentiators in an increasingly competitive landscape. The company is pioneering advanced LMR battery technology, promising 30% higher energy density than LFP batteries by 2028, while maintaining over 200 LMR patents and aggressively enforcing its IP rights through successful court injunctions. Beyond technology, LG's commitment to sustainability through its RE100 initiative and integration of high-tech solutions for smart grids and AI-enabled energy systems positions the company at the forefront of the clean energy transition, making it a compelling investment opportunity in the rapidly evolving battery and energy storage sector.

Next Volatility Period: Around August 21
Hello, traders.
Please "Follow" to get the latest information quickly.
Have a nice day today.
-------------------------------------
#TSLA
We need to see if it is rising along the rising channel.
The key is whether it can rise with support near 311.48 to break out of the downtrend line.
The key is whether it can rise along the short-term uptrend line and break through the short-term downtrend line after passing through this volatility period around July 25.
Therefore, we need to see whether it can rise above the 347.21-382.40 range with support near 311.48.
The next volatility period is expected to be around August 21.
-
The important thing is to maintain the price above the M-Signal indicator on the 1M chart.
If not, there is a possibility of a long-term downtrend.
Therefore, if it shows support in the 268.07-311.48 range, it is a time to buy.
-
Thank you for reading to the end.
I hope you have a successful trade.
--------------------------------------------------

$TSLA – Wedge Breakout with Rotation PotentialNASDAQ:TSLA – Breaking Out of a Big Wedge After Earnings Reversal
Tesla ( NASDAQ:TSLA ) just broke its wedge pattern after a strong post-earnings recovery, and the price action says a lot about where sentiment is shifting.
🔹 Earnings Flush → Strong Absorption
Earnings reaction was ugly — big gap down and heavy selling.
Since then, NASDAQ:TSLA has been shrugging off negative news — sales data, guidance cuts, analyst downgrades — all absorbed without breaking down.
This tells me buyers are quietly accumulating.
🔹 Rotation Narrative
The rest of the Mag 7 has been ripping for months.
NASDAQ:TSLA is the laggard — and now traders are rotating into the one big name that hasn’t moved yet.
If it holds here, the upside could be sharp.
🔹 My Trade Plan:
1️⃣ Starter Long: Took an entry on the wedge trendline break.
2️⃣ Why Not Full Size Yet? This is day 4 of the move — in my playbook, that’s a starter size only.
3️⃣ Add Trigger: If we get an inside day or small dip that holds above the 9 EMA, I’ll add the rest of the position.
4️⃣ Stop: Under the wedge breakout level for now.
Why I Like This Setup:
Wedge break + rotation narrative + strong news absorption.
Market psychology turning — when a stock stops going down on bad news, it’s often about to go up.
Starter now, add on the dip = structured risk.
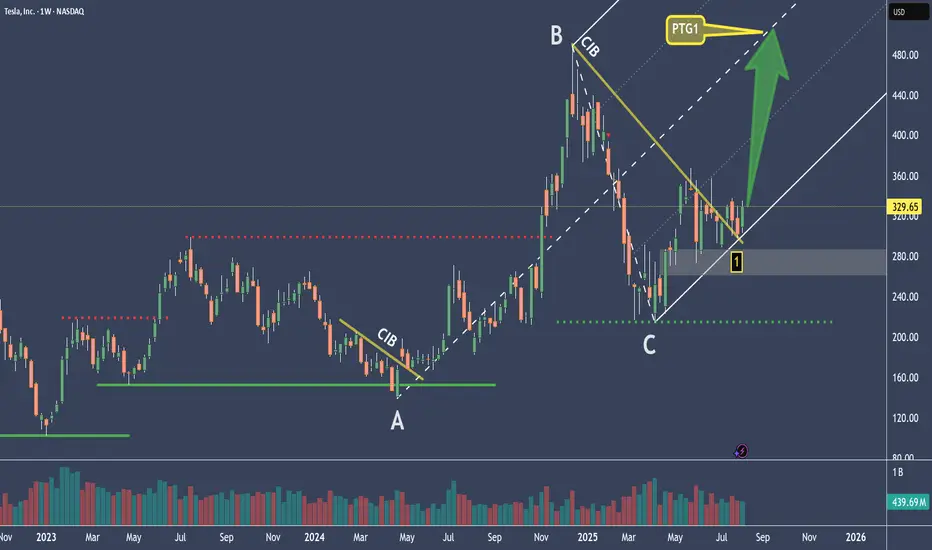
TESLA Is Counting Down The Clock – Moonshot?The red and green lines nicely illustrate what true support and resistance look like.
At the moment, it appears that the market has formed support again (1), but we can’t really confirm this since we don’t have a higher high that has been broken. So we can only assume that the base is at the C point.
We’ve been trading within the fork for several months now, which suggests that we’re once again in a longer-term upward movement.
If that’s the case, then we look for a nice profit target (PTG1) at the CL, because we know there’s over an 80% chance of reaching it.
An open and close outside the fork would be an exit signal, and could indicate a possible reversal to a short position.
I’ll explain further details in the YT video.
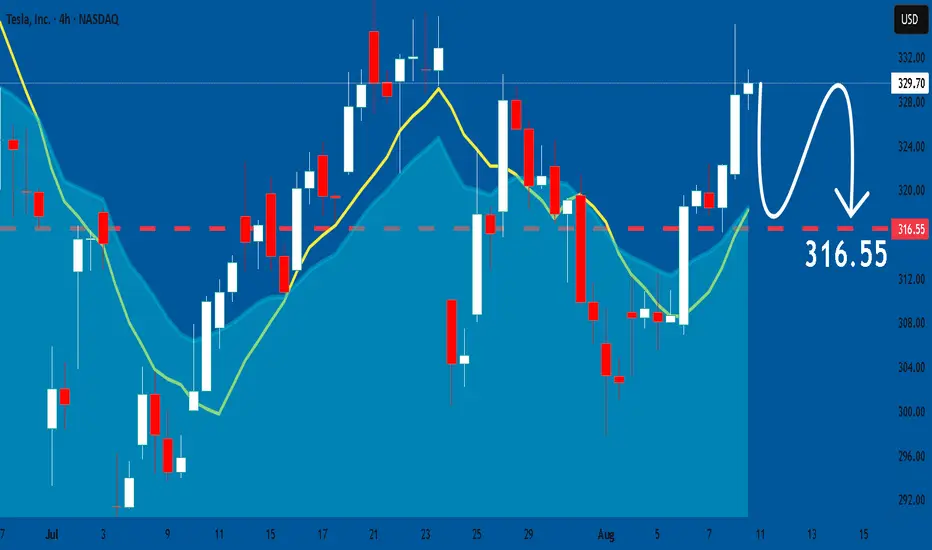
TESLA What Next? SELL!
My dear friends,
My technical analysis for TESLA is below:
The market is trading on 329.70 pivot level.
Bias - Bearish
Technical Indicators: Both Super Trend & Pivot HL indicate a highly probable Bearish continuation.
Target - 319.77
Recommended Stop Loss - 335.01
About Used Indicators:
A pivot point is a technical analysis indicator, or calculations, used to determine the overall trend of the market over different time frames.
Disclosure: I am part of Trade Nation's Influencer program and receive a monthly fee for using their TradingView charts in my analysis.
———————————
WISH YOU ALL LUCK

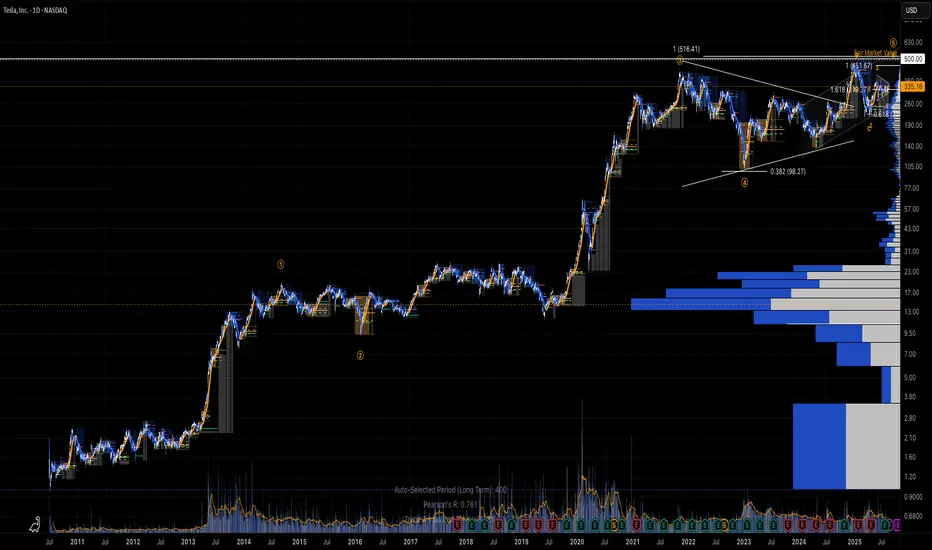
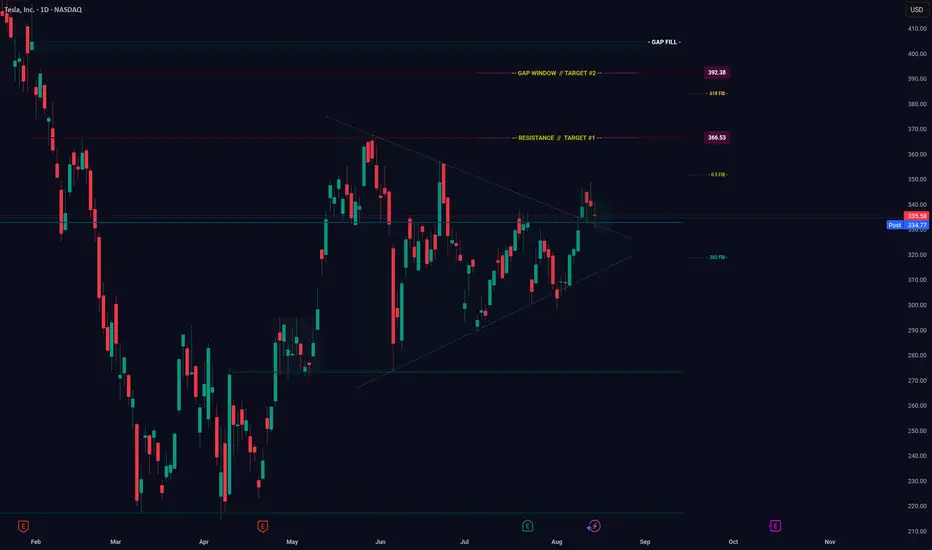
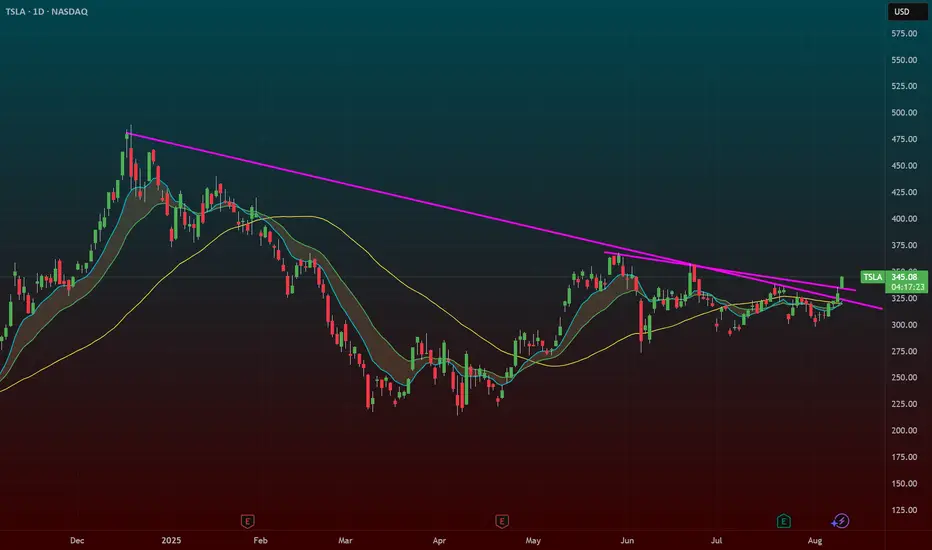
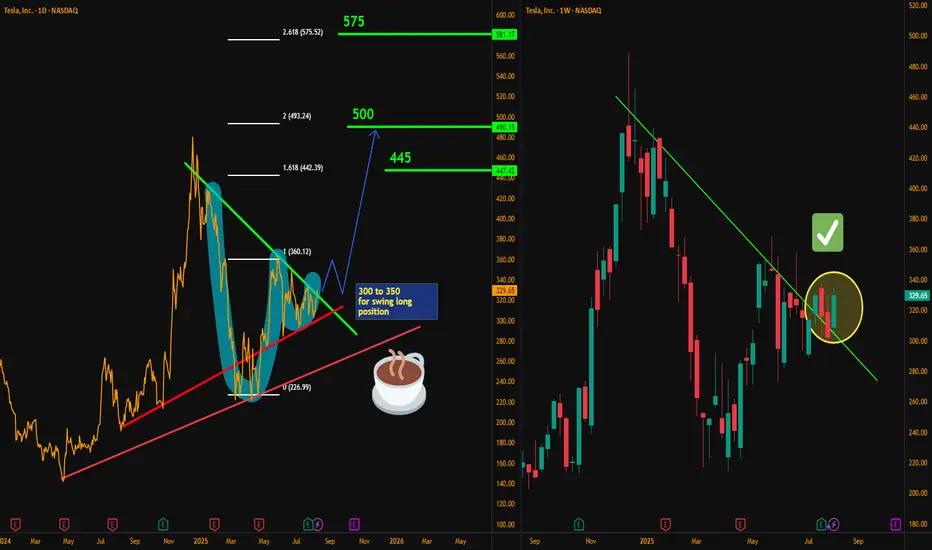
Tesla Roadmap: From $300 Zone to $575Hello traders, here’s my latest analysis on Tesla (TSLA) based on the weekly and daily timeframes. On the weekly chart, I have drawn a downtrend line starting from December 2024, and the recent price action shows a breakout above this line on a weekly close. This breakout is a promising sign that an uptrend may be developing in the medium term.
On the daily chart, we can see a cup & handle pattern forming, which is a bullish continuation structure. However, the daily downtrend drawn from the December 2024 highs remains unbroken, so I will need to see a weekly close above the $332 resistance level to confirm a swing long setup.
My preferred positioning zone for longs is between $300 and $350, using a multi-entry approach to average into the trade. My upside targets are $366, $445, $500, and finally $575. These levels align with inverse Fibonacci projections, with “safety 1” at $360 and “0” at $227, pointing toward the 161, 200, and 261 extensions as key objectives.
For stop-loss placement, patient traders who are willing to hold through volatility may consider a weekly close below $265 as their invalidation point. For faster or more short-term oriented traders, a weekly close below $300 could be used as a tighter stop level. Although I believe it is unlikely for price to drop this far, even if it does, I expect strong buying interest and a potential rebound from the $265 support zone.
Risk management remains crucial for this setup. I recommend not risking more than 10% of your capital, scaling in over multiple entries, and always confirming with your own strategy before committing to the trade. Position sizing and discipline will be key to managing volatility and protecting capital.
NASDAQ:TSLA
TESLA: Expecting Bearish Movement! Here is Why:
Balance of buyers and sellers on the TESLA pair, that is best felt when all the timeframes are analyzed properly is shifting in favor of the sellers, therefore is it only natural that we go short on the pair.
Disclosure: I am part of Trade Nation's Influencer program and receive a monthly fee for using their TradingView charts in my analysis.
❤️ Please, support our work with like & comment! ❤️
TESAL HEADING TO $500+ RANGE ANALYSIS HERE Afternoon Trading Fam
So here is our in-depth look at Tesla: Currently the monthly trend is bullish giving us levels of $500 and above.
Locally though we can break this $338 top expect to see $444 and $480 getting hit next
If we need to correct and we break the lows of $319 expect to see the levels of $307 then $301 being hit
Happy Trading
Trade Smarter Live Better
Kris
