USDT Dominance Update (12H)It seems it can drop a bit more. Upon reaching the green box, it could reverse upwards and lead to a market correction in crypto.
In the green zone, caution is needed, and new purchases in the crypto market should be accompanied by precise capital management.
For risk management, please don't forget stop loss and capital management
Comment if you have any questions
Thank You
Tetherdominance

Tether Dominance, TA» There is a lower high on the chart. This is a long-term timeframe. The signals are very strong here.
» There is a strong rejection at SMA200, this level being confirmed as resistance.
» There is a very strong decline in volume.
» There are three consecutive weeks closing red.
These are all very powerful bearish signals.
» This week wicked lower compared to 24-March.
Tether Dominance just produced the lowest reading on a drop since November 2024. When USDT.D was moving down in November 2024, everything Crypto was moving up. The conditions are similar today.
Tether Dominance can be seen moving down as a continuation of a bearish trend. This is happening after a lower high is fully in and confirmed.
Short-term, there can be a small pullback followed by lower prices.
For example, several days can close green but by the time next week ends, the action turns full red. Just as it happened on the 7-April week. The action started strongly bullish but USDT.D ended with a bearish week and the start of a decline that will lead to a lower low.
We are likely going to see the lowest reading on this index since March 2022 or December 2021. It is a long process but the chart is pointing down. That is what the chart says.
Thank you for reading.
Namaste.

$USDT.D Cycle Top ProjectionI could see CRYPTOCAP:USDT.D playing out like this.
This November data also coincides with my BTC Cycle Thesis in November.
Lotsa other macro factors and indicators at play for a cycle top, but this lines up nicely and where I'll be taking a heavy chunk of profits.

BREAKING: Tether at Decisive point! Rejection means Reversal!$Tether is approaching a key resistance level.
A rejection here could trigger a temporary recovery in the broader market.
This rejection may signal a potential trend reversal if confirmed on higher timeframes.
However, a break above this resistance would likely mean no altseason for the next few months possibly until the end of the year.
If you found this helpful, please hit that like button.
I’ll update this chart and share insights you can use in your trading decisions.
Also, drop your thoughts in the comments I’d love to hear what you think.
Thank you.
#Peace ✌️

USDT Dominance Confirms Bull Run ContinuationHello, Skyrexians!
Yesterday we shared the analysis when told you that the first confirmation of altcoin season has been received. For sure, Bitcoin dominance still has not confirmed reversal. Today we will show the third important chart. CRYPTOCAP:USDT.D also can help us to predict altseason.
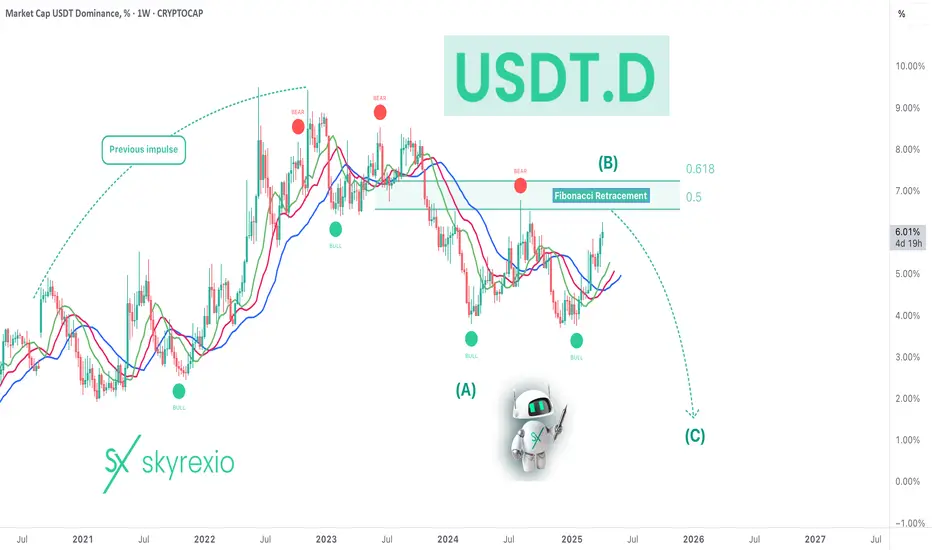
Let's take a look at the weekly chart. Tether dominance has been in the large uptrend wave and now it's in the major correction. Wave A has been finished, wave B has the flat shape and it's also almost done. Fibonacci target area has been almost reached. We want to see the red dot on the Bullish/Bearish Reversal Bar Indicator as a huge confirmation, but it's not obligatory.
Best regards,
Skyrexio Team
___________________________________________________________
Please, boost this article and subscribe our page if you like analysis!
USDT DOMINANCE is bullish (8H)We have a bullish structure on the chart, and in a broader view, there is a double-bottom pattern. The price is currently supported by these formations.
Recently, the price has also reached a demand zone, so a pump is expected soon. Be cautious with buy/long positions.
A daily candle closing below the invalidation level will invalidate this outlook.
Do not enter the position without capital management and stop setting
Comment if you have any questions
thank you

USDT DOMINANCE NEW UPDATE (8H)This analysis is an update of the analysis you see in the "Related publications" section
From the upper green zone, Wave F of this bullish diametric is expected to complete, leading to Wave G. Wave G is a bullish wave that will likely cause the market to turn red.
Let's see what happens
For risk management, please don't forget stop loss and capital management
Comment if you have any questions
Thank You

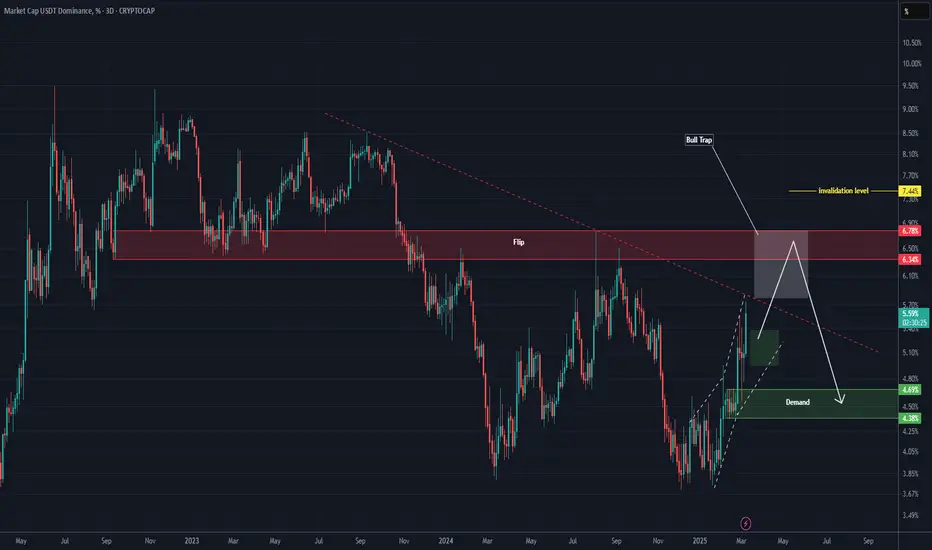
USDT.D Analysis (3D)With buying pressure and a twin tower pattern at the bottom, the downtrend line might experience a fakeout, creating a bull trap, leading to a strong rejection from the red zone downward.
We expect a rejection from the red zone to the downside.
Bitcoin's bottom seems to be around 74K to 68K.
Let’s see what happens.
A daily candle closing above the invalidation level will invalidate this analysis.
For risk management, please don't forget stop loss and capital management
When we reach the first target, save some profit and then change the stop to entry
Comment if you have any questions
Thank You
When Bitcoin Goes Up, Tether Dominance Goes Down!I was wondering, does the Tether Dominance (USDT.D) index chart supports a bullish Bitcoin and a bullish Altcoins market? It does. Let's look at this chart together.
Bullish volume has been dropping steadily. Bearish volume is very high.
Tether Dominance has been in a downtrend, lower highs, since August 2024. Obviously, when Bitcoin hit bottom, USDT.D peaked. This index has been producing lower highs since. There is a clear downtrend on the chart.
A bearish hammer came on the 28-Feb. session. This is followed by another bearish signal 4-March. A continuation. Lower highs long-term and lower highs short-term.
The chart is pointing lower, has been going lower and will continue lower. This means that Bitcoin is going up.
Thank you for reading.
The signals are everywhere.
Namaste.

USDT Dominance Update (4H)The large bullish pattern appears to be a symmetrical one, and we are currently in wave I of this structure.
Wave I seems to need a bit more time to complete. The candles are expected to reject from the red zone down to the SS (Static Support) line.
If the candles attack the red zone once again, it could be a good opportunity to buy Bitcoin and altcoins.
Let’s follow the market step by step instead of making predictions. Let’s see what happens.
For risk management, please don't forget stop loss and capital management
Comment if you have any questions
Thank You

USDT DOMINANCE UPDATE (4H)First of all you should know that "USDT Dominance" is always moving inverse of BTCUSDT .
To be honest with you, the market is in terrible condition. Buying pressure on Tether dominance is high. The recent pumps in altcoins were mainly to liquidate short positions; otherwise, the overall trend for altcoins remains bearish.
Tether dominance seems to be aiming to hunt higher supply zones. In high-volume altcoins like Ethereum, key levels have been lost, so we can rely on this Tether dominance analysis.
We will either move up from this area or from the green lines.
This move may take several months.
For risk management, please don't forget stop loss and capital management
Comment if you have any questions
Thank You

TradeCityPro | USDT Dominance Key Levels & Market Impact👋 Welcome to TradeCityPro!
In this analysis, I will break down USDT.D, one of the most critical indicators in crypto, which reflects the amount of money held in Tether dominance.
🔑 The higher the dominance, the more altcoins are being sold and converted into USDT. Conversely, when dominance decreases, USDT is being sold and converted into other cryptocurrencies. As a result, this chart usually moves inversely to Total2 and other crypto assets—when USDT dominance rises, Total2 typically declines, and vice versa.
📅 Weekly Timeframe
In the weekly timeframe, we observe an uptrend that followed an ascending trendline. However, after getting rejected at the 8.68 resistance, the trendline was broken, initiating a bearish leg that closely followed a descending curved trendline, reacting strongly to it. After reaching 3.87, the price made a deep pullback to the previous ascending trendline. Given the PRZ formed by the confluence of the trendlines, the 6.20 resistance, and the SMA99, the next bearish leg began.
🔍 Currently, the price has once again reacted to 3.87 and pulled back to the curved trendline. If this zone holds as resistance, the probability of 3.87 breaking on the next test increases significantly, potentially triggering the next bearish leg. This leg could extend down to 2.61, although considering the current liquidity in USDT, such a deep drop seems unlikely but remains technically possible.
🔼 If the curved trendline is broken and the trigger activates at 4.61, the price may form a consolidation box between 3.87 and 6.20. Upon breaking 4.61, we could see a movement toward the top of the range. The SMA99 has been a strong dynamic resistance, with multiple price reactions to it, so it could play a key role if USDT dominance increases.
📅 Daily Timeframe
In this timeframe, we see an accumulation box forming between 3.87 and 4.36, which was broken a few days ago. If the price stabilizes above 4.36, a move toward 4.99 is likely, with the ultimate target at 6.20, as mentioned in the weekly timeframe.
📉 If the price re-enters the accumulation box and this breakout turns out to be a fake move, strong bearish momentum could enter the market, significantly increasing the probability of a 3.87 breakdown.
✨ There are no other notable points in the daily chart—this timeframe has provided clear triggers. Now, let’s move on to the 4-hour timeframe for futures trade triggers.
⌛️ 4-Hour Timeframe
In this timeframe, we can see the recent price movements in more detail. As shown, the price has formed a key resistance at 4.60, which could be a decisive level. If this area is broken, it will confirm the accumulation box breakout, increasing the likelihood of a move toward 4.99.
✔️ On the other hand, if the price drops below 4.44 and re-enters the accumulation box, the entire upward move will be invalidated. In that case, breaking 4.23 could trigger further declines, leading to a test of the bottom of the accumulation range.
📝 Final Thoughts
This analysis reflects our opinions and is not financial advice.
Share your thoughts in the comments, and don’t forget to share this analysis with your friends! ❤️

USDT Dominance - Short-Term Analysis (1H)The correction appears to be a symmetrical pattern. This formation is suspicious, and we should expect the possibility of this index reaching the upper red box.
Once wave i is completed, a major stop hunt on altcoins will occur, allowing the market maker to accumulate more liquidity.
Let’s see what happens.
For risk management, please don't forget stop loss and capital management
Comment if you have any questions
Thank You

Bad news... Tether Dominance is bullish!#usdt #tether dominance made W bounce in about 1 year period and in weekly candle stick size, #usdtd also formed bullish divergence. This movement seems not good for #crypto and #altcoins in mid term.

USDT Dominance - Short-Term Analysis (1H)In lower and smaller timeframes, it appears that USDT dominance has entered a correction. This correction started from the point where we placed the red arrow on the chart.
It seems that the candles are currently in wave B.
A bearish wave C is expected, which could push the candles toward the TP levels.
The closure of a 4-hour candle above the invalidation level will invalidate this analysis.
For risk management, please don't forget stop loss and capital management
Comment if you have any questions
Thank You

Tether Dominance still looks bullish#tether #usdt dominance chart the #usdtd looks bullish and may aid the wick it left upside. Bullish CRYPTOCAP:USDT dominance is bearish for #altcoins and #btc

The Stablecoin Revolution: Is the Dollar's Reign Over?
The Future of the Global Cryptocurrency Market: Navigating the Rise of Stablecoins and the Shifting Sands of Global Finance
The cryptocurrency market has exploded in popularity over the past decade, evolving from a niche interest to a global phenomenon. While Bitcoin remains the dominant player, the landscape is rapidly diversifying, with stablecoins like USDC and Tether playing an increasingly crucial role. This article explores the future of the global cryptocurrency market, examining the growing influence of stablecoins and their potential impact on the traditional financial system, particularly in relation to the US dollar and the DXY index.
The Rise of Stablecoins: Bridging the Gap Between Crypto and Fiat
Stablecoins are cryptocurrencies designed to maintain a stable value, typically pegged to a fiat currency like the US dollar. This stability makes them attractive for everyday transactions and as a safe haven within the volatile crypto market. USDC and Tether are the two largest stablecoins, with market capitalizations in the tens of billions of dollars.
The appeal of stablecoins lies in their ability to combine the benefits of cryptocurrencies – such as speed, low transaction costs, and 24/7 availability – with the stability of traditional currencies. This makes them ideal for a variety of use cases, including:
• Remittances: Sending money across borders using stablecoins can be faster and cheaper than traditional methods.
• Payments: Stablecoins can be used for everyday purchases, both online and in physical stores.
• Trading: Stablecoins provide a stable asset for traders to use when navigating the volatile cryptocurrency market.
• Decentralized Finance (DeFi): Stablecoins are a key component of DeFi protocols, where they are used for lending, borrowing, and trading.
The Impact on the US Dollar and the DXY Index
The growing adoption of stablecoins has raised questions about their potential impact on the US dollar and the DXY index, which measures the dollar's strength against a basket of other major currencies. Some analysts believe that the widespread use of stablecoins could weaken the dollar's dominance in global trade and finance.
However, it's important to note that most stablecoins are currently pegged to the US dollar. This means that their value is directly tied to the dollar's performance. As a result, the rise of stablecoins could actually strengthen the dollar's position in the short term.
In the long run, the impact of stablecoins on the dollar will depend on several factors, including:
• Regulation: Governments around the world are beginning to pay close attention to stablecoins. The regulatory frameworks that are developed will play a significant role in shaping the future of these digital assets.
• Adoption: The widespread adoption of stablecoins will be a key factor in determining their impact on the dollar. If stablecoins become a major force in global finance, they could challenge the dollar's dominance.
• Competition: The emergence of other stablecoins pegged to different currencies, or even central bank digital currencies (CBDCs), could reduce the reliance on dollar-pegged stablecoins.
Opportunities and Challenges in the Cryptocurrency Market
The future of the cryptocurrency market is full of opportunities and challenges. The continued growth of stablecoins is likely to play a significant role in shaping this future. Other key trends to watch include:
• Institutional adoption: More and more institutional investors are entering the cryptocurrency market. This is bringing increased legitimacy and liquidity to the market.
• Technological innovation: The cryptocurrency market is constantly evolving, with new technologies and applications being developed all the time. This innovation is driving the growth of the market.
• Regulatory clarity: As governments around the world develop clearer regulatory frameworks for cryptocurrencies, this will help to reduce uncertainty and encourage further adoption.
However, there are also challenges that the cryptocurrency market must overcome, including:
• Volatility: The cryptocurrency market remains highly volatile, which can make it risky for investors.
• Security: There have been a number of high-profile hacks and scams in the cryptocurrency market, which have raised concerns about security.
• Environmental concerns: The energy consumption of some cryptocurrencies, such as Bitcoin, has raised concerns about their environmental impact.
Conclusion
The future of the global cryptocurrency market is bright, with stablecoins playing an increasingly important role. While the impact on the US dollar and the DXY index remains to be seen, it's clear that stablecoins are changing the landscape of global finance. As the market continues to evolve, it will be important to keep an eye on the latest developments and to be aware of the opportunities and challenges that lie ahead.

$USDT February Local Top Hit!well well well... look at that.
TA PERFECTION 💯
Should I start charging for my calls? 😂
I couldn't imagine anyone not following my account at this point 🧐
(see prior USDT chart for the original call).

USDT DOMINANCE Update (8H)Wave G extended, and the market maker executed the worst-case scenario.
As it hit the resistance zone, a very heavy rejection is expected. Keep in mind that reaching the lower green zone will take several months, with significant fluctuations along the way, but it seems to be following the yellow circle.
Both Tether dominance and Bitcoin dominance have reached important levels. For now, the focus should be on looking for buy/long setups on altcoins over the coming months.
For risk management, please don't forget stop loss and capital management
Comment if you have any questions
Thank You

Tether Dominance Update (8H)This analysis is an update of the analysis you see in the "Related publications" section
First of all you should know that "USDT Dominance" is always moving inverse of BTCUSDT .
According to the previous analysis, wave G has formed, and the price is now dropping.
For the next move, there is a possibility of a pullback toward the red box, followed by a deeper correction.
Overall, the price could drop further.
For risk management, please don't forget stop loss and capital management
Comment if you have any questions
Thank You

USDT Dominance Breakdown = Crypto Rally?USDT dominance has broken a long-term trendline and is now testing a critical support zone around 4.0%. If it drops below 3.8%, we could see a strong shift towards a risk-on environment, fueling a major rally in Bitcoin and altcoins.
However, if this level holds, we might see temporary consolidation before the next move. Historically, a decline in USDT dominance signals capital rotation into crypto, increasing the chances of an altseason breakout.
The coming days are crucial—watch this level closely!
Thank You!

What is the current structure of USDT.D (8H)?This analysis is an update of the analysis you see in the "Related publications" section
It seems the structure is a diametric, and wave F is nearing completion. Wave F was a bearish wave.. A bullish G wave remains in this structure. Let's see which direction the market will take.
For risk management, please don't forget stop loss and capital management
Comment if you have any questions
Thank You

The broader outlook of Tether dominance (8H)First of all you should know that "USDT Dominance" is always moving inverse of BTCUSDT
Many are asking about a broader perspective on Tether dominance. Our outlook from a zoomed-out perspective is as follows.
The green zone is very strong and unbreakable!
For risk management, please don't forget stop loss and capital management
Comment if you have any questions
Thank You
