XTZ 1WIf a pattern is formed, Based on Strong Price Action, I think the trend line is a good place to enter
Tezos

XTZ Ready To Move Up!!Tezos is continuing to move upwards within the ascending channel even though we have seen some decent downside recently, we are still comfortably in the channel and have some strong supports still that are likely to hold us up, we are currently sitting directly on support coming from a little bit ago and then we also have right below us a nice uptrend support line coming from a previous bottom in our ascending channel, not to mention the bottom of this channel is also support for us and then finally a very solid support at the 0.5 FIB level, so as you can probably tell it is going to take a hell of a lot to breakthrough to the downside here especially past the 0.5 FIB level. but what im looking for is an overdue bounce off of support and a rebound to the upside, i think this isn't far off to say at all we have seen incredible price movements from XTZ recently somedays even leading the entire market and coming from some massive news that involves multiple banks! Looking at the bollinger bands we are currently trading in the bottom half underneath the midline and if i had to make a bet of if we will break the supports or breakthrough this midline im choosing the upside all day, we don't have too much resistance to the upside the main two are for sure the BB midline and then the 0.3 FIB but if we see a rebound here soon and some good momentum i don't think we will have much trouble at all smashing through these levels, XTZ has already shocked many investors and people and more institutions are starting to wake up to Tezos potential and overall the great project! Looking at the RSI we have slightly broken below the midline and what we are looking for here is a bounce off of the current support we are sitting on and rebound upwards pushing us back up above this midline so we can retain this very nice uptrend XTZ has going! Now the RMI we also are currently sitting on support and im looking for once again a nice bounce upwards and ultimately get this reversal with the blue getting back ontop of the orange, i don't think we should have much trouble doing so since we have had a decent drop here and we we're a hair away already from getting that bullish reversal and aswell as all the factors i talked about earlier mainly being the many support levels we have! Not financial advice just my opinion!

XTZ is going to break up the trendline and explode 🤯🚀Xtz has been going down for a while and has found its support on 6.81. I think accumulation is done and soon it will break up the trendline 🚀
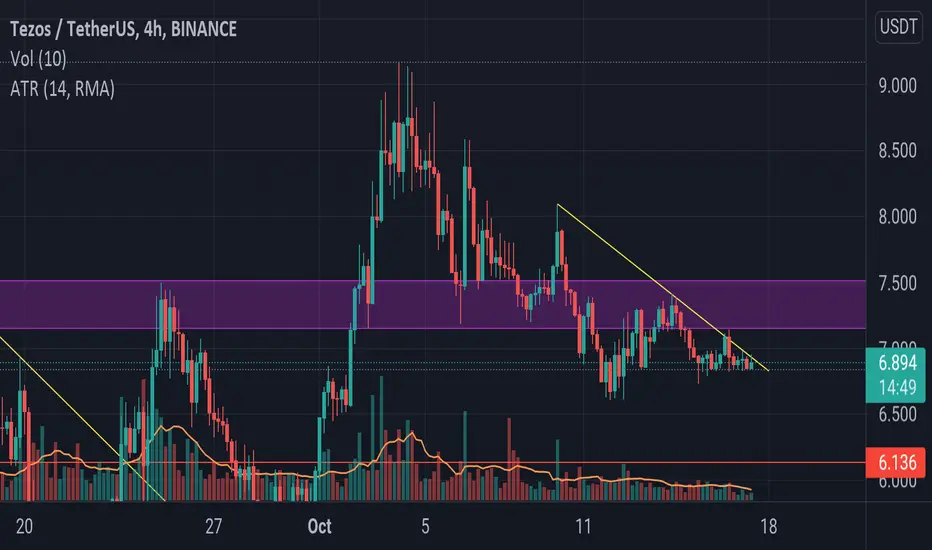
XTZ close to breakout downtrendGood support of 200 MA on 4h.
Expect to break a downtrend on Monday the latest.

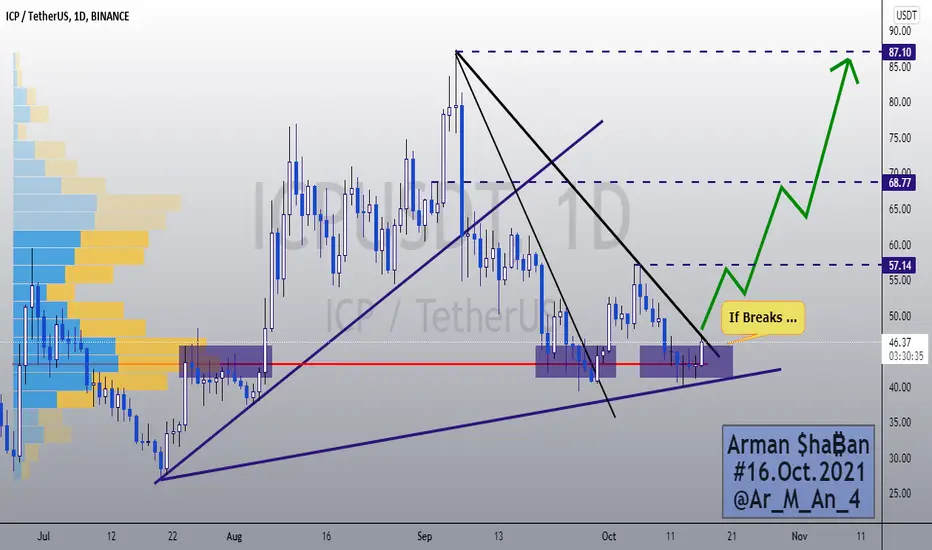
₿ ICPUSDT 1D ₿ : 16.Oct.2021This analysis is a check of the chart in a Daily time frame and everything is clear on the chart and does not need additional explanation ... However, if you have any questions, be free to ask .
⚠️ This Analysis will be updated ...
👤 Arman Shaban : @Ar_M_An_4
📅 16.Oct.2021
⚠️(DYOR)
₿ SUSHIUSDT 1D ₿ : 16.Oct.2021This analysis is a check of the chart in a Daily time frame and everything is clear on the chart and does not need additional explanation ... However, if you have any questions, be free to ask .
⚠️ This Analysis will be updated ...
👤 Arman Shaban : @Ar_M_An_4
📅 16.Oct.2021
⚠️(DYOR)

🔥 XTZ Long-Term Bullish Channel: UpdateOver 2.5 months ago, I made a long-term analysis on XTZ and the bullish channel it has been trading in since it's inception.
It appears that investors were watching the exact same channel. Since the price touched the upper resistance of the channel, XTZ has seen a bearish move to the downside.
Assuming that the price will follow the channel in the coming weeks, I'm expecting a move towards the green reversal area. This would also be the area where potential investors will be stepping in again.
However, I'm aware that the current market outlook is overly bullish. So there's a decent chance that the price will never reach this reversal area. In case of a bullish move, I'm looking for a break out of the channel and the re-test following that break out. A positive re-test would be a great signal for the price to continue going up.
Long term bullish target: $20.
Happy trading!

₿ BNBUSDT 1D ₿ : 15.Oct.2021Well, as we can see, the price started to grow exactly according to the previous analysis with the failure of its resistances, and so far it has grown by more than 10% ... The next target is $ 518 and the next target is $ 690 ...
⚠️ This Analysis will be updated ...
👤 Arman Shaban : @Ar_M_An_4
📅 15.Oct.2021
⚠️(DYOR)

TEZOS UP 20% WITHIN DAYSTezos has break a resistance of descending channel perfectly matching a handle in a cup and handle formation (only broken by the China crackdown news just to re-enter the channel). Already confirmed WAVES 1,2,3 of an 12345 ELLIOT WAVE with retracements and corrections matching the expected FIB levels.
A minor correction is expected ( WAVE 4) to be followed by the final ascending wave 5.. (100% fib)
OPEN POSITION @ 7.75
STOP LOSSES @ 6.85
TAKE PROFITE @ 9.00
We ve been tracking this coin a long time and it is one of the most promising coins out there due to technicalities and marketing.
This is not a financial advise, just my oppinion

Bank Of America Likes Tezos How about You? (REDO Chart)Technically we have some bullishness going on here with good rsi and macd slightly lagging. I am hoping we can gain some momentum here and ride this wave up! I would also like to see more volume coming in. None the less, BOA is touting this project as being undervalued. Details below, directly quoted from crypto daily.
www.cryptodaily.co.uk
"The cryptocurrency industry is about much more than Bitcoin and Ethereum. Although alternative currencies - or altcoins - are often dismissed by those two communities, they can still offer tremendous potential. Tezos is one of those tokens that Bank of America mentions in its “Digital Assets Primer.”
An Interesting Opinion By Bank Of America
Until a few years ago, banks and other financial institutions would dismiss digital currencies as a "fad" no one needs to pay attention to. Today, these same service providers try to tap into this market. Consumers of all kinds have shown an interest in exploring Bitcoin, Ethereum, and other currencies. However, BoA takes a unique approach by looking at developer interest in alternative cryptocurrencies.
BoA officials now believe crypto assets should become a new asset class altogether. Although the current Bitcoin market cap is impressive, the broader crypto ecosystem represents even more value. Tapping into the unexplored markets can prove viable for investors, although it remains crucial to do your own research.
Figuring out how to evaluate digital assets remains the tricky part. For Bank of America, developer interest and activity is a crucial metric. As more developers express an interest in building on a particular blockchain, there is a chance demand for the native asset will increase. Of course, this equation has much more than just developer activity, although it can serve as a viable metric.
Going by the recent developer activity, it appears Tezos is one of the blockchain ecosystems to keep an eye on. It notes a strong increase in organizations and repositories, putting it ahead of The Graph, IOTA, NEAR protocol, EOS, Stellar, and others. It seems Tezos is finally getting recognition for its ever-expanding ecosystem that rivals the top competing blockchains while being vastly more energy-efficient due to its PoS consensus mechanism.
Tezos Price Performs Well
The value of Tezos' native asset XTZ has risen greatly in the past year. A 248.9% price increase in a year is very impressive and highlights the price potential of cryptocurrencies. Tezos is on par with other major currencies on that front, lending credibility to Bank of America’s new framework. Although the current developer activity seems to offer some hope on that front, whether that momentum can continue remains unclear.
More than 100 projects maintain a market cap of over $1 billion in the current cryptocurrency landscape. Tezos ranks high on that list with its valuation of over $6.37 billion. The project ranks 33rd out of all cryptocurrencies, putting it on a lot of people's radars. If developers continue to find ways to leverage Tezos’ smart contracts - and more users continue to stake XTZ - interesting things can happen in the future.
Disclaimer: This article is provided for informational purposes only. It is not offered or intended to be used as legal, tax, investment, financial, or other advice."

XTZ Ready For a Leg Up!!Tezo's and most of the market has been feeling the BTC rise and the dominance rise in turn pushing altcoins to the downside, XTZ has actually held up very strong compared to some other coins. We are still comfortably in our ascending channel with us just recently pushing into the lower half. Looking at the bollinger bands we are actually sitting right on that midline which is currently support and holding us up, im looking for a daily close above this level tonight and hopefully a bit of a pivot off of here, aswell the bands seem to coming in and could be starting to squeeze down on price action, if this happens we will likely see some sideways movement with momentum building up stronger and stronger each day until we have an explosive move in either direction. Keep in mind BTC is always a huge factor for altcoins so we must watch this aswell. Taking a look at the EMA ribbons we are still moving in the right direction with the green ribbons on top and with some decent separation, if altcoins start to take off to the upside we can likely get a hint from the EMA ribbons by them starting to open up wider and spread out further showing growing bullish momentum! As far as significant support and resistance go we are dead center inbetween the 0.3 FIB (Resistance) and the 0.5 FIB (Support) i think it is likely that before we move another leg up we will probably go to test that 0.5 FIB level and my thoughts are that we will hold it, unless of course BTC crashes the party. Now the RSI, as i always talk about the midline is a very key level, not only does is act as support (Currently) it signals the overall trend we are in, if we remain above this midline we are still considered in a confirmed uptrend, but if we fall below and fail to get back up and above we will be considered in a confirmed downtrend whether its a short term one or longer term one, i would say shorter term is the most likely option as i believe this bullrun is not over for alts. But we are seeing a curl to the upside slightly above this midline and its looking like we could actually hold here going into daily close, and like i said before if we can hold onto the midlline on the BB aswell, we are looking very good! Not financial advice just my opinion!

Tezos U.S. Dollars (T)Tezos is 1) approaching/already landed on a firm support 2) approaching the 50MA which it has previously skipped off of on three prior occasions 3) gearing up to retest it's September - October pennant.
Wicks are also suggesting a good response to to this support level
Look below for analysis of its BTC pairing
This is all contingent on BTC continuing its uptrend or if Tezos begins to counter trade BTC
RSI is also approaching 50 (Could bounce off)
Nothing is FERCLY confirmed so this is mostly a gamble also considering the previously mentioned contingency

TEZOS shows nice Price action trading SIGNALThis is textbook example of our signal. By The Way our students as much more premium quality content!
XTZ/USDT - LIMIT ORDER
LONG
20x
Risk 0,5% - small position
Entry around 6.120
TP1 6.454
TP2 7.153
TP3 7.976
TP4 8.527
SL 4.386

Tezos (XTZ-USD) $12 PT by DecemberBULLISH | Tezos has been seeing a massive increase in volume the past 6 months. Overall, based on the trend of higher highs and higher lows, Tezos will test $6.24 in the next couple days. Once the new low/support has been confirmed, the next stop will be $8 then $9.25 then $12+. The chart is created using the 4hr candles. I expect the $12 PT to hit by December.
Like and follow for more updates :)

Tezos is preparing the next pump.This is a good moment to make the first entry for tezos.
I think the price could be better, maybe 6.5 usdt, but for the people who sold over 9 usd, buy again in 7 it's ok.

XTZ Descending Triangle (BEARISH)Hello traders hope everyone is having a great Sunday!
XTZ bearish trade setup with a 10% drop likely to happen today
Breakdown should happen after XTZ is below $7.15 and from there
we can expect a sell off all the way down to around $6.5 - $6.6 area
which is our (Buy zone) in the chart. Expect a bounce back up to previous
support ($7.15) which likely will turn into newfound resistance.
Best of luck on your trades figured i would share my idea out
there so now we just wait and see what happens. Cheers!

XTZUSDT TEZOS READY TO PUMPWe saw Tezos reclaim support and now ready for a breakout with 30% return.

5th extension eliot wave for 1 weeksupported by Gann fan, there is a bullish 5th wave on XTZUSDT for the next week.
decreasing volume and RSI also confirm this prediction.
Caution: I take no responsibility for this analysis. its just personal analysis
KUCOIN:XTZUSDT

XTZUSDT 1DHi everyone
Ascending triangle pattern
If XTZ can be maintained above the $ 7.44 support, the uptrend will be achieved directly
However, it seems that the price falls below that and is looking for a suitable level in the direction of its jump
The $ 6.75 and $ 5.95 barriers are good levels for such a jump
On the other hand, if the XTZ price drops to $ 5.95 and closes below $ 5.34 as the downtrend continues, the uptrend scenario will be nullified
In that case, the price is likely to fall further and the $ 4.68 demand barrier will be tested again, where the uptrend can be resumed
What do you think the price trend will be?
Thankful

XTZ symmetrical triangleXTZ broke out from that green big triangle that you see on 12hr chart
now in symmetrical blue one on you could see on 1hr chart
SMA looks ok on 12hr (I would like them closer) and on 1hr chart I am just waiting that we cross above that 20sma
until that we could see even 200sma retested...
Measured move of this breakout is at 11.4
Good luck traders

TEZOS (XTZ/USD) | Buy The Strength!Hi,
Tezos have made a breakout from quite a strong and clean resistance level which now should act as a support. Use partial entries from the current price because the chances are that it may go from the current area but the ideal entry should stay around $6.10 to $6.8:
Do your own analysis and if it's matching with mine then you are ready to go!
Regards,
Vaido

Tezos (XTZ) breakout from cup and handle: +70%Bitcoin made its move and yes I shouldve sticked with my original analysis of the TOTAL2 cup and handle; which did work out like predicted. The last dump did throw me off a bit but its not a big deal, we did not miss out. We just missed out on BTC and a bit on ETH.
XTZ (and most alts) are yet to move and XTZ will break its ATH soon and has a breakout target of well above 10$ per coin. Tezos has strong fundamentals, technology and is increasingly popular: could we see a Solana-type run for Tezos? We need to clear ATH for that and we are in full on price discovery!
IMPORTANT: this is not financial advice, trade or invest based on your own risk and research.

Tezos XTZ is challenging his lifetime resistanceXTZUSDT reached a new ATH at 9.171, and was fall sharply to 7.2.
Look at the XTZBTC chart you will see a 3-year trend line play as a resistance which stopped XTZ from going higher.
I can't tell you when XTZ will break this line. But this pattern reminds me of Bitcoin price action back in late July 2020:
After Bitcoin broke-out from its 3-year resistance, it went up 6x within several months, and is still in uptrend.
As I as before, we have never seen a REAL pump on Tezos before. It is in accumulating for years.
Watch closely on XTZBTC. When it breakout, it is a must-buy. NFA.
COINBASE:XTZUSD
BINANCE:XTZUSDT
BINANCE:XTZBTC
