XTZ Daily chart potential to breakoutTezos played well in this recent period of time and its almost broke the major resistance of 4$ , however it looks after Bitcoin to moving on like rest of the crypto market .
If tezos close daily candle above 4.05 resistant , it will reach 4.50 and probably goes to 4.80 for the second run .
XTZ LONG :
entry: 4.08
Tp 1: 4.48
Tp 2: 4.74
Tp 3: 5.120
Sl:3.85
Its not a financial advice ,DYOR
I would love to hear your ideas about TEZOS
Tezos

Tezos long time consolidation... waiting a breakoutXTZ daily chart... how much time for big movement? After long time ago consolidating in this levels... we can expect fib levels above for target.

XTZ Cup and Handle 2xHello everyone,
This is my first time doing a public analysis, so I hope you won't be too harsh on me. :)
I have analyzed Tezos (XTZ), and the idea based on the daily chart, I have observed a cup handle formation that has been trying to form for a long time and I wanted to share it with you.
As can be seen in the graphic, the cup part is completed, the handle part scrapes the bottom.
Even though I took it as the bottom part of the cup and made an approximate date and price estimate, it may not be exactly the same.
2x (8.500ish and beyond) might be expected for Tezos, which I have foreseen for a period of about 2-2.5 months.
Farewell

What Is Tezos (XTZ)?What is Tezos? Still in a downtrend, the local level of $ 4.5, until it is broken, you should not buy.

XTZ/USDT BUYING SET UPXTZ Breakout Descending Triangle pattern
Potential continue upward movement🚀
Target mentioned in the chart
Accumulation zone : $3.550 - $3.7
Stoploss : $3.4
Risk : 6%

XTZUSDT 4H One of the fantastic coin. fantastic fundamental on it and have good news in future.
👤SecondChanceCrypto
📅26.March.22
⚠️(DYOR)

🆓Tezos (XTZ) Mar-24 #XTZ $XTZ
XTZ has conquered the $3.2 zone and with the current buying force, it is possible for XTZ to continue to rise to the $4 and $4.8 zone in the near future. The risk is quite low but we still need to watch out in case XTZ loses the $3.2 area and will fall into a long-term downtrend.
📈RED PLAN
♻️Condition : If 1-Day closes ABOVE 3.2$ zone
🔴Buy : 3.2
🔴Sell : 4 - 4.8
📉BLUE PLAN
♻️Condition : If 1-Day closes BELOW 3.2$ zone
🔵Sell : 3.2
🔵Buy : 2.6 - 2
❓Details
🚫Stoploss for Long : 10%
🚫Stoploss for Short : 5%
📈Red Arrow : Main Direction as RED PLAN
📉Blue Arrow : Back-Up Direction as BLUE PLAN
🟩Green zone : Support zone as BUY section
🟥Red zone : Resistance zone as SELL section


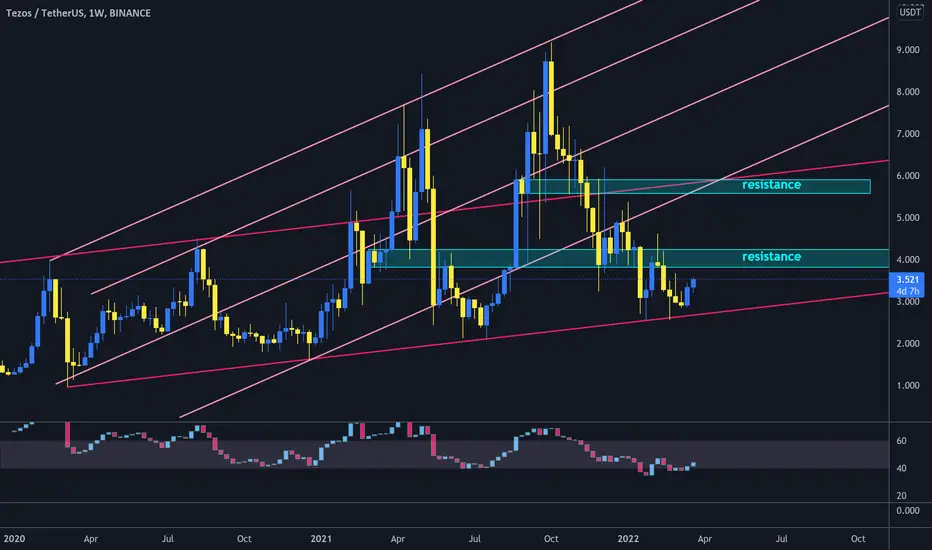
XTZ inside broadening wedge#XTZ/USDT
$XTZ touched the lower line of broadening wedge and hold it as support. and now try to break out from descending resistance in daily time frame.
🐮 price can head up to resistance zone around $4.
break out from $4.3 can increase price to resistance zone around $6 that is the same with 2 ascending trend lines.
Buy Tezos/ XTZUSDTLooking at the market, Tezos looks nice to buy at this current moment on the 15 minute chart based on market trends.

Tezos (XTZUSDT) TA: 22.2.27Tezos is located at the bottom of the canal for a long time, which is well supported every time it hits the bottom of the canal. If it leaves the red channel, it can continue its long-term upward trend. But if it leaves the blue channel, it can see 1.85 support.
⚠️ This Analysis will be updated ...
👤 Sadegh Ahmadi: @SDQ_Crypto
📅 27.Feb.22
⚠️(DYOR)
❤️ If you apperciate my work , Please like and comment , It Keeps me motivated to do better

TEZOS TA : 02.26.22 : $XTZ : +35% ✅As you can see the price after reaching and returning to The Bullish Order Blocks reacted positively and increase more than 35% . the Next targets are $ 3.9 , $ 4.32 and $ 5.36 .
All the supports and resistances are marked on the chart and everything is clear in this analysis , but , just in case , if you had any questions or doubts Please feel free to ask in the Comment section .
Follow us for more analysis & Feel free to ask any questions you have, we are here to help.
⚠️ This Analysis will be updated ...
👤 Arman Shaban : @ArmanShabanTrading
📅 26.Feb.22
⚠️(DYOR)
❤️ If you apperciate my work , Please like and comment , It Keeps me motivated to do better ❤️

XTZ - Detailed Video Analysis!Hello everyone, if you like the idea, do not forget to support with a like and follow.
Here is the top-down analysis for XTZ , feel free to request any pair/instrument or ask any questions in the comment section below.
Best of luck!

XTZ/BTC Fractal. Potential trend initiation. Big pumpingXTZ / BTC Timeframe 1 week. I deliberately made a large timeframe to show the entire section of the chart, which is necessary for the clarity of the formation. Fractal. The possible start of the trend, possibly near the minimum price values.
The coin is suitable for accumulation, which means for positional trading. The previous price inflation was about + 300%. This time, if a bullish trend develops, we have every chance of seeing a much larger percentage increase in prices. Let's hope that April-May will make smart people obscenely rich, and stupid as always ...
My idea of learning how to work with market cycles, where I showed potential work using this coin as an example, which is quite successfully implemented in reality.
Pivot points (zones) of Tezos (XTZ) / USDT market cycles. Psychology
Those people who count on quick profits without effort and waste of time are doomed to give their modest contribution to the smarter and more hardworking ones.

Ethereum/TetherUS.4h.BINANCE:20.02.2022As you can see, the price has reacted to the uptrend line and seems to be pullback to the desired level to continue the trend to lower or higher levels.
👨🏫 vahid soltani : @Vahidsoltanitrading
📆 : 20.02.2022
⚠️(It is a personal analysis and not a buy or sell signal).

XTZ bearish at $3.5The Tezos price analysis is bearish as the cryptocurrency has experienced a crash in the past few days. Bears have engulfed the market, and the coin value fell from $3.9 on January 17, 2022, and capped at $3.5 on January 19, 2022; bears continue to rule the market today, as well as a further decrease in price is imminent. The market has shown bearish dynamics. The price for XTZ is currently available at $3.5, struggling just the $3.6 mark.

XTZ Tezos at 10$ soonFollowing the path I can say that XTZ can reach $10 within this summer. There are signals that the bulls will be trying within a month.
Hopefully no wars or any catastrophe that influences the momentum.

XTZ a low risk midterm investmentHi guys,
XTZ has a key position at current prices, It's experiencing an expanding harmonic pattern and in the midterm, can have a decent profit.
Follow and comment

$XTZ two cases.$XTZ broke the biggest bearish trendline, but:
We have two scenarios right here:
-Retest the trendline;
-W pattern at 2.53;
Or I am wrong in both cases:))

XTZ/USDT Technical Overview#XTZ/USDT Technical Overview:-
$XTZ trading at $4.04
This is Good support.
If $XTZ prize hit $4.40 thats would be good price to Enter because of Confirmations.
I am buying some here around $4.00
If Price go below $3.90 then I will exit.
Targets:- $4.40
If Hit $4.50 then New Target would be $6
Need to break White TL.
Support:- $4
Resistance:- $4.60/$5.60

XTZ Midterm Movement Analysis 📊 XTZUSDT (TEZOS)
💹 Time Frame: Daily (Update)
➖➖➖➖➖➖➖➖
🟡 XTZ broke the downward trend line and is trying to hold above it. we have 2 scenarios for Tezos!!
✅ The current trend may retest dynamic support and bounce to S/R level and start another bullish Cycle to 0.618 Fibonacci level.
✅ The current trend directly heading forward to retest S/R key level and reject and break the dynamic support the pullback and start another bearish Cycle.
➖➖➖➖➖➖➖➖
👤 AmirHossein
📅 02.09.2022
⚠️ (DYOR)
BINANCE:XTZUSDT

Correction complete time to long TEZOS XTZUSDTThis setup like any ALT/Derivative or Spot setup is and always will be dependable on how BTC is trading .
Please ensure you understand this as I have been trolled by individuals whom dont understand the distinction and thus probably lose money and take it out on me .
Ok well here we have the XTZ/USDT Pair on Bybit Perpetual contract .
As you can see from the drawing we have completed a full retracement down to the .886 fib and made a nice reaction off of this level ,
with a back test of the .382 back on the 5th Of Feb and now we are slowly building on some upwards movement again .
If you are looking to enter I would suggest that you set some alerts and maybe we pull back to the .382 when BTC throws a wobbly or the .236 if we were to
fast wick down ... again revolving around BTC !
Sitting at the .786 level is the POC so i would not expect to go straight through it as i anticipate a fair level of resistance here .
My targets would be around the 1-1 as marked and around the VAH .
Ensure to take profits on the way up in increments of 25% for example .
.Always use a SL and know your Invalidation

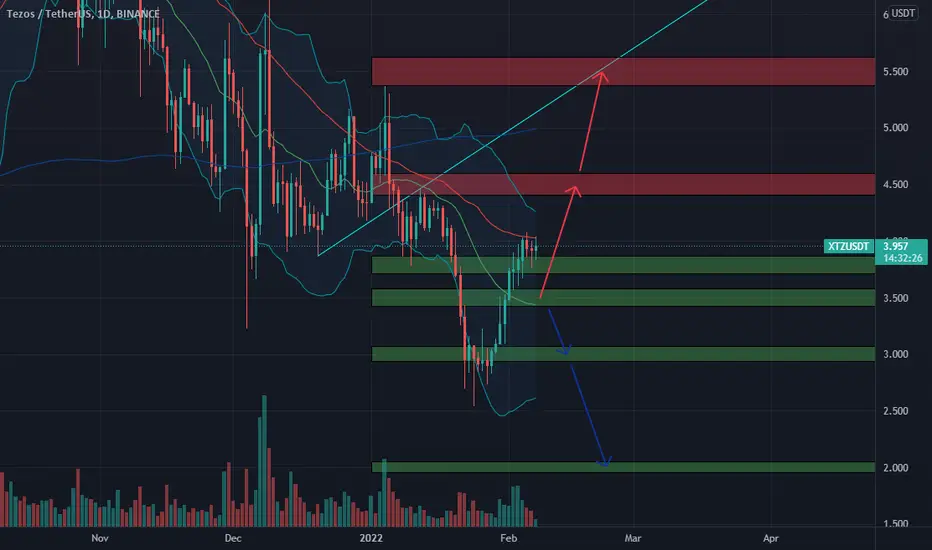
🆓Tezos (XTZ) Feb-07 #XTZ $XTZ
.
📈RED PLAN
♻️Condition : If 1-Day closes ABOVE 3.5$ zone
🔴Buy : 3.8 - 3.5
🔴Sell : 4.5 - 5.5
📉BLUE PLAN
♻️Condition : If 1-Day closes BELOW 3.5$ zone
🔵Sell : 3.5
🔵Buy : 3 - 2
❓Details
🚫Stoploss for Long : 10%
🚫Stoploss for Short : 5%
📈Red Arrow : Main Direction as RED PLAN
📉Blue Arrow : Back-Up Direction as BLUE PLAN
🟩Green zone : Support zone as BUY section
🟥Red zone : Resistance zone as SELL section