TIAUSDT 1D AnalysisTIA ~ 1D Analysis
#TIA Buy after successfully penetrating this resistant line with a short -term target of at least 10%+.
TIAUSD

TIAUSDT — 2025 Technical RoadmapTIAUSDT — Daily Technical Roadmap
🕞 60-Second Read
Trend on the 1-D chart is still structurally bearish ; price (spot 2.865 USDT) just carved a higher-low off the 2.44 vector block and is knocking on the Yearly BC lid. Two large upside voids now beckon.
Hot-Zone #1 – 2.60 → 2.44 (1 D + 4 H vector demand): stacked fresh liquidity, 9-15 % under spot.
Hot-Zone #2 – 2.985 (Yearly BC): first breaker & range cap, only 4 % above; a daily close above here opens the air-pocket to 4.27.
Hot-Zone #3 – 4.932 → 6.947 (Yearly Pivot ↔ Yearly TC): macro supply shelf guarding a 72-142 % rally window.
💧 Liquidity & Imbalance
Daily vector 7.85 (77 % fill-rate inside 60 d).
Stacked 4 H vectors 9.86 / 9.83 = 2.5 % supply shelf.
Demand stack 2.69 – 2.44 only 18 d old.
⚡ Volatility & Momentum
GMMA Z-Score curling up from −2 σ; short ribbons still under long ribbons – suggests pause, not reversal.
🎲 Probability Dashboard
HTF Structure −3
Liquidity voids +1
Momentum −1
Vol-regime 0
Bear / Neutral / Bull ≈ 42 % / 33 % / 25 %
📈 Trade Playbook
Strategy 1
1. Layered Limit Grid – Aggressive Counter-Trend Long
Entry layers (size %):
2.60 – 40 % of your allocated TIAUSDT size
2.44 – 30 %
2.05 – 20 %
1.90 – 10 %
SL = 1.75 (≈ 1 ATR below extreme demand)
TP ladder:
2.985 – 25 % off-load
3.722 – 25 %
4.932 – 25 %
6.947 – 15 %
7.849 – 10 %
Weighted R:R ≈ 4.3
Strategy 2
2. Layered Limit Grid – Conservative Breakout Long
Trigger: daily close > 3.722 (Yearly Low reclaim), then place grid orders.
Entry layers (size %):
3.75 – 40 %
3.55 – 30 %
3.25 – 20 %
2.985 – 10 %
SL = 2.70
TP ladder:
4.932 – 30 %
6.947 – 30 %
7.849 – 20 %
9.860 – 15 %
12.432 – 5 %
Weighted R:R ≈ 3.8
⚠️ Risk Radar
Low-float token – slippage risk on size.
Macro event: FOMC 1 May → volatility spike possible.
BTC options IV rising – spill-over risk to alts.
Price must conquer 2.985 to open the upside magnet trail toward 4.27 → 4.93. Failure keeps 2.60 → 1.90 demand stack in play before any durable markup.
Not financial advice – do your own research & manage risk.

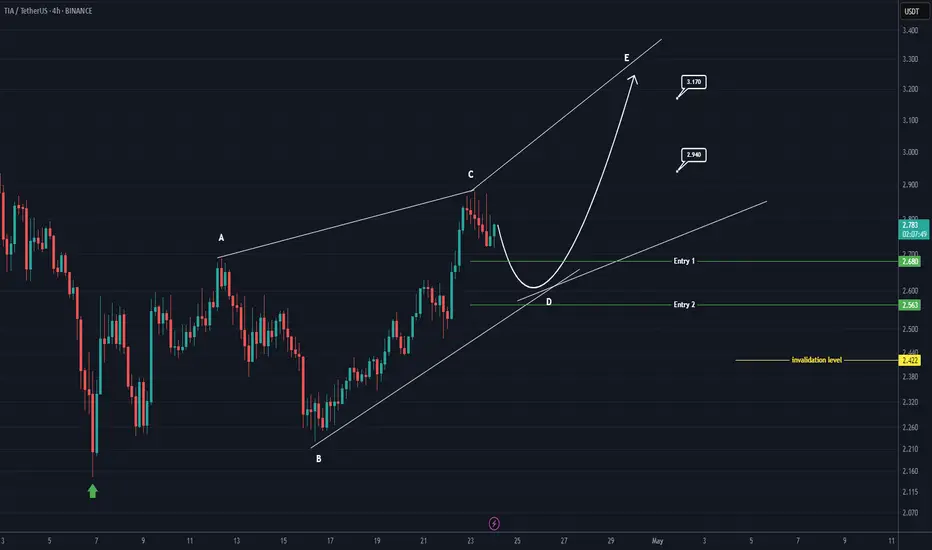
TIA buy/long setup (4H)TIA seems to be in the middle of a bullish pattern, especially as it has reclaimed key levels and there is an order block located below the current price.
Two entry points are marked on the chart, indicating where we’re looking for buy/long positions.
Targets are specified on the image.
A 4-hour candle closing below the invalidation level would invalidate this setup.
For risk management, please don't forget stop loss and capital management
When we reach the first target, save some profit and then change the stop to entry
Comment if you have any questions
Thank You
#TIA/USDT#TIA
The price is moving within a descending channel on the 1-hour frame, adhering well to it, and is heading towards a strong breakout and retest.
We are experiencing a rebound from the lower boundary of the descending channel, which is support at 2.18.
We are experiencing a downtrend on the RSI indicator that is about to be broken and retested, supporting the upward trend.
We are looking for stability above the 100 Moving Average.
Entry price: 2.27
First target: 2.36
Second target: 2.42
Third target: 2.53

TIAUSDT | Still No Buyers—Maintaining a Bearish Outlook
TIAUSDT has been one of today’s top volume movers, with 24‑hour trading volume hitting around $63.6 million—a 48.7 percent jump from the previous day.
Yet despite this surge, genuine buying interest remains absent, and price action is unable to find footing.
🔴 First Resistance: The Red Box
• This red box marks the first major zone where sellers have consistently defended price.
• Any rally into this area should be treated as a short opportunity—provided you see clear lower‑time‑frame breakdowns and CDV confirming sell‑side dominance.
📉 How Much Further Could It Fall?
I can’t predict the exact bottom—no one can. What I do know is that until buyers step up, downward pressure is likely to continue. Watch for each bounce to stall at resistance and use that as your cue to enter or add to shorts.
🤝 Key Trading Rules to Follow
Confirmation is Everything
Wait for a clean LTF breakdown inside the red box, with CDV divergence or rising sell volume. No confirmation means no trade.
Adaptive Bias
I will not insist on my short idea. If TIA breaks above this red box with volume and then retests it as support, I will shift to a long bias. Otherwise, my view stays bearish.
Risk Management
Keep stops just above the red box. Trade only what the market shows you—never chase.
This approach is built on watching real order flow and market behavior, not guessing. If you want to align yourself with a strategy that filters out noise and focuses on high‑probability setups, you’re in the right place.
📌I keep my charts clean and simple because I believe clarity leads to better decisions.
📌My approach is built on years of experience and a solid track record. I don’t claim to know it all but I’m confident in my ability to spot high-probability setups.
📌If you would like to learn how to use the heatmap, cumulative volume delta and volume footprint techniques that I use below to determine very accurate demand regions, you can send me a private message. I help anyone who wants it completely free of charge.
🔑I have a long list of my proven technique below:
🎯 ZENUSDT.P: Patience & Profitability | %230 Reaction from the Sniper Entry
🐶 DOGEUSDT.P: Next Move
🎨 RENDERUSDT.P: Opportunity of the Month
💎 ETHUSDT.P: Where to Retrace
🟢 BNBUSDT.P: Potential Surge
📊 BTC Dominance: Reaction Zone
🌊 WAVESUSDT.P: Demand Zone Potential
🟣 UNIUSDT.P: Long-Term Trade
🔵 XRPUSDT.P: Entry Zones
🔗 LINKUSDT.P: Follow The River
📈 BTCUSDT.P: Two Key Demand Zones
🟩 POLUSDT: Bullish Momentum
🌟 PENDLEUSDT.P: Where Opportunity Meets Precision
🔥 BTCUSDT.P: Liquidation of Highly Leveraged Longs
🌊 SOLUSDT.P: SOL's Dip - Your Opportunity
🐸 1000PEPEUSDT.P: Prime Bounce Zone Unlocked
🚀 ETHUSDT.P: Set to Explode - Don't Miss This Game Changer
🤖 IQUSDT: Smart Plan
⚡️ PONDUSDT: A Trade Not Taken Is Better Than a Losing One
💼 STMXUSDT: 2 Buying Areas
🐢 TURBOUSDT: Buy Zones and Buyer Presence
🌍 ICPUSDT.P: Massive Upside Potential | Check the Trade Update For Seeing Results
🟠 IDEXUSDT: Spot Buy Area | %26 Profit if You Trade with MSB
📌 USUALUSDT: Buyers Are Active + %70 Profit in Total
🌟 FORTHUSDT: Sniper Entry +%26 Reaction
🐳 QKCUSDT: Sniper Entry +%57 Reaction
📊 BTC.D: Retest of Key Area Highly Likely
📊 XNOUSDT %80 Reaction with a Simple Blue Box!
📊 BELUSDT Amazing %120 Reaction!
I stopped adding to the list because it's kinda tiring to add 5-10 charts in every move but you can check my profile and see that it goes on..

TIAUSDT Bottoming Out?TIAUSDT Technical analysis update
TIAUSDT has been trading within the longest descending channel. The price has once again touched the channel support and also retested the November 2023 support level or bottom. A strong bounce from this zone is likely, and we could potentially see a 100–150% move from the current level.

TIA Coin: Unlock 118% Profit Potential (1D)From the point where we placed the red arrow on the chart, it appears the TIA correction has begun.
Despite the current bullish market trend, TIA has not yet experienced a pump, and it seems the price hasn't reached its bottom yet. This correction seems to follow a large, time-consuming diamond-shaped diametric pattern, and we are currently in the early or middle stages of wave G.
Recently, the price lost a minor trendline, marked with a red dotted line, indicating that wave G might continue its path.
We have identified a low-risk buy zone on the chart for catching the next bullish wave in TIA. We are targeting buy/long positions in this zone.
Price targets are clearly indicated on the chart.
A daily candle close below the invalidation level will invalidate this analysis and suggest a potential reversal.
invalidation level: 1.089$
For risk management, please don't forget stop loss and capital management
When we reach the first target, save some profit and then change the stop to entry
Comment if you have any questions
Thank You

Is TIA About to Break Down Hard? Traders Beware Before It’s lateYello, Paradisers! Did you catch the recent bullish rally on #TIAUSDT? It’s been delivering solid gains over the past couple of days, giving traders reason to celebrate. But what if we told you that this rally might just be setting up a classic trap—one that smart money is already preparing to take advantage of? The technical structure forming right now suggests a high probability of a reversal, and if you’re not paying attention, you might end up on the wrong side of the move.
💎#TIAUSDT, at the core of setup is a developing a probable Bearish Gartley pattern. These harmonic structures are rare but extremely powerful when they align with multiple technical confirmations and that’s exactly what we’re seeing here. With the recent move upward, TIAUSDT appears to have completed its C leg, a critical part of the Gartley structure. This sets the stage for the D leg, which typically completes much lower. The price reacted strongly from the C leg area, which also happens to line up perfectly with a previous local high adding even more probability to the resistance at that zone.
💎This resistance isn't just horizontal there's a dynamic element at play as well. The 21-period EMA on multiple timeframes is currently acting as a ceiling for price action. When a key moving average starts rejecting price repeatedly, it often signals that the current trend is losing steam and this dynamic resistance only strengthens the case for a downside move from here.
💎Looking deeper, the bearish signs are confirmed by momentum indicators. The RSI on lower timeframes is not only overbought but also showing clear signs of bearish divergence. This divergence occurs when the price continues to make higher highs while RSI starts forming lower highs a classic sign that momentum is weakening. It’s one of the more reliable early warnings that a reversal may be near. In this case, RSI is flashing that warning now, suggesting that buyers may soon run out of fuel.
💎If this bearish probable scenario plays out as expected, the first key level to watch on the downside sits around the 3.278 zone. This minor support may offer a temporary bounce, but if the D leg of the Gartley is to be completed, we could see even deeper price action. This makes the current area extremely sensitive—any weakness from bulls could trigger a fast move downward.
💎However, no pattern is complete without an invalidation level, and for the Bearish Gartley, that comes in around the 3.805 resistance zone. A strong, sustained close above this level would invalidate the bearish setup and signal renewed bullish momentum. Until then, all technical signals are pointing toward caution, especially for those still riding long positions without a tight risk plan.
Stay alert, Paradisers. The market is about to decide. This is a textbook moment where emotions can take over, and late buyers get punished for chasing green candles. That’s why, we are playing it safe right now. If you want to be consistently profitable, you need to be extremely patient and always wait only for the best, highest probability trading opportunities.
MyCryptoParadise
iFeel the success🌴

TIAUSDT 3DTIA ~ 3D Analysis
#TIA Key support that must be maintained. Loss of this support, LSE:TIA price will be more depressed lower.

TIA | Next Altcoin to MOON ??In the macro, it's clear that TIA has been in a downward trend for an extended period of time. This means, it's a great place to buy - because the bullish cycle is up next.
In an earlier publication, I made an update about the ideal entry point for TIA:
A key indicator to watch is the daily timeframe, when the price begins to trade ABOVE the moving averages - that's when you'll have the first confirmation of a bullish turn around. It is a bullish sign to see the gradual higher lows.
Moving Averages:

TIAUSDT – Weak at Key Weekly Level! More Downside Ahead?TIAUSDT – Weak at Key Weekly Level! More Downside Ahead?
“This chart looks weak—momentum favors the downside. But is there a bounce first?”
🔥 Key Insights:
✅ Sitting at a Critical Weekly Zone – A breakdown here could be brutal.
✅ Momentum Looks Bearish – No real strength from buyers.
✅ Only Considering Low-Risk Buys – Fibonacci Green Zone (0-0.5) is the ideal cheap area.
💡 The Smart Plan:
Looking for a Break & Retest Downward – If support cracks, shorts become clear.
Small Risk Buys from the Fibonacci Zone – Only for aggressive traders.
CDV & Volume Profile Must Confirm – No buyers? No trade.
“Weak price action, heavy risk. Only the right levels matter here—watch closely!” 📉🔥⚠️
A tiny part of my runners;
🌊 WAVESUSDT.P: Demand Zone Potential
🟣 UNIUSDT.P: Long-Term Trade
🔵 XRPUSDT.P: Entry Zones
🔗 LINKUSDT.P: Follow The River
📈 BTCUSDT.P: Two Key Demand Zones

TIA | PERFECT Bottom??In the macro, it's clear that TIA has been in a downward trend for an extended period of time. This means, it's a great place to buy - because the bullish cycle is up next.
Trend based indicators are great to identify the immediate predominant pressure on the chart, in this case, bearish. A "Buy" signal in the weekly timeframe would be the first step in the right direction (reversal).
Trend Based Indicator:
Another key indicator to watch is the daily timeframe, when the price begins to trade ABOVE the moving averages - that's when you'll have the first confirmation of a bullish turn around.
Moving Averages:
______________________
BINANCE:TIAUSDT

Breaking: $TIA Surges 17% Eyeing A Move to $5 The first modular blockchain network that enables anyone to easily deploy their own blockchain with minimal overhead by rethinking blockchain architecture from the ground up broke out of a falling wedge patten soaring 17% albeit the crypto market is highly volatile with CRYPTOCAP:BTC reclaiming the FWB:83K pivot.
Celestia Network Native token ( LSE:TIA ) has shocked the mainstream crypto market after breaking out of a falling wedge escaping the gasp of the support point holding it at the $2 zone.
With building momentum, LSE:TIA is eyeing a move to the $5 zone should it break the $4 resistant zone a move to the $5 target isn't far-fetched. With the Relative Strength Index (RSI) at 58, LSE:TIA is poised for a bullish run should the crypto market stabilize.
Celestia Price Live Data
The live Celestia price today is $3.74 USD with a 24-hour trading volume of $220,357,891 USD. Celestia is up 17.41% in the last 24 hours. with a live market cap of $2,091,803,371 USD. It has a circulating supply of 558,964,944 TIA coins and the max. supply is not available.

Celestia TIA price analysis🟣 For the second day in a row, the LSE:TIA price is showing growth
But would we risk buying OKX:TIAUSDT now - rather no than yes...
🟡 Above the orange trend line, purchases will be safer.
🟢 And during the $3 retest in the blue scenario, it's even safer)
Although, in the medium term, seeing #Celestia at $9 again is more than a realistic task.
_____________________
Did you like our analysis? Leave a comment, like, and follow to get more

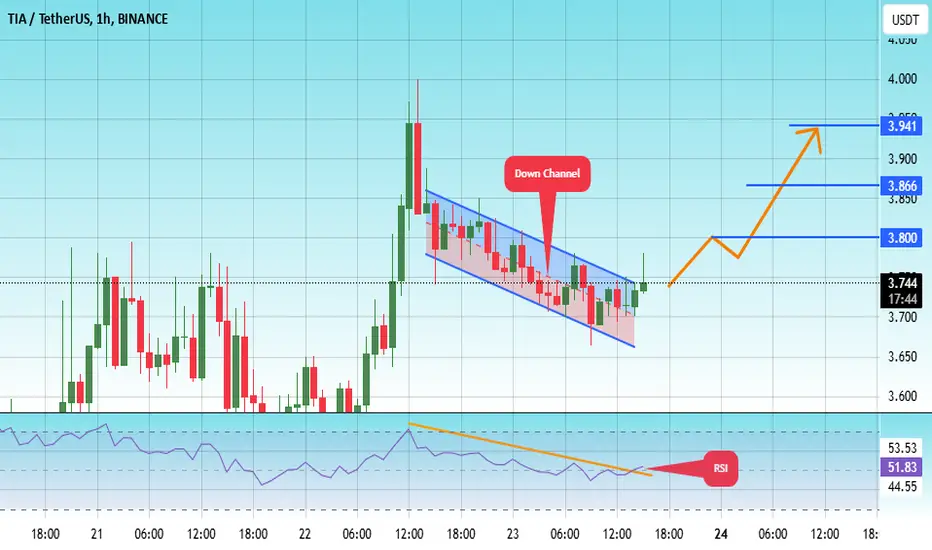
#TIA/USDT#TIA
The price is moving in a descending channel on the 1-hour frame and is adhering to it well and is heading to break it upwards strongly and retest it
We have a bounce from the lower limit of the descending channel, this support is at a price of 3.67
We have a downtrend on the RSI indicator that is about to break and retest, which supports the rise
We have a trend to stabilize above the Moving Average 100
Entry price 3.74
First target 3.80
Second target 3.86
Third target 3.92
TIA target $5.64h time frame
-
Entry: $2.96
TP: $5.64
SL: $2.66
RR: 8.77
-
(1) TIA is still correcting and building the bottom structure after dump on 3rd Feb.
(2) Double bottom is one of the possible structure, the potential right leg is $2.9
(3) Fibonacci provides first target at $4.5 and final target at $5.6
(4) Stop loss once going below $2.66

TIA/USDThello friends
According to the arrival of buyers, we can enter into the transaction with capital and risk management.
*Trade safely with us*

TIAUSDT 3DTIA ~ 3D Analysis
#TIA This is the lowest support block for now. Buy gradually from here with a minimum target of 15%++.


#TIA/USDT#TIA
The price is moving in a descending channel on the 1-hour frame and is expected to continue upwards
We have a trend to stabilize above the moving average 100 again
We have a descending trend on the RSI indicator that supports the rise by breaking it upwards
We have a support area at the lower limit of the channel at a price of 4.33
Entry price 4.72
First target 4.90
Second target 5.12
Third target 5.47

#TIA/USDT#TIA
The price is moving in a descending channel on the 1-hour frame and is expected to continue upwards
We have a trend to stabilize above the moving average 100 again
We have a descending trend on the RSI indicator that supports the rise by breaking it upwards
We have a support area at the lower limit of the channel at a price of 4.65
Entry price 4.70
First target 4.91
Second target 5.10
Third target 5.32

TIA (Celestia) Main trend. Maximum targets of the cycle. XXL+10XLogo of rhymes. Time frame 3 days. Everything is shown and described on the price chart of this pre-planned super hype, to earn super profits out of nothing.
"Collected" (principle and scheme of deception) for 7 rounds of financing (the principle of the "access pyramid") - $ 156.5 million. This is the principle of super pumping and listing on exchanges for super huge profits of almost all hype assets since 2020.
Under the logic of the chart, as a rule, they pull under the general trend of the market cycle by another + 800-1000%. According to the chart, the average price between accumulation and distribution of the cycle is usually 500-800%. The main thing is to keep the logic of the chart under the general market cycle (for constant small, imperceptible sales). Such assets are constantly sold in trend, which is logical, there is no difference between 50x -100x - 1000X.
No matter how funny and illogical it may sound, while the “whales” are selling, you can be in the asset and be safe. When sales stop, that is, there is no interest in maintaining the hype, the prospects of the legend and the liquidity of the asset for sales, - a sharp (hack, break-in, or other fiction - justification for "closing the project") or slow death (the asset loses major players and demand / supply is given into the hands of “the majority of those waiting for XXX, who will never be”), that is, depreciation and scam.
The previous legend of prospects does not matter, as the focus of attention of the crowd shifts to other freshly created similar assets and marketing to attract “fresh blood” of new stupid money. All new assets are created, and most importantly advertising, at the expense of profits from the previous ones, only on a large scale. This is a disguised Ponzi scheme, which everyone agrees with, as they are sure that they will not be “the last”.
Linear for clarity.
Local game.
