TIAUSDT 1D AnalysisTIA ~ 1D Analysis
#TIA Buy after successfully penetrating this resistant line with a short -term target of at least 10%+.
Tiausdtperp

TIAUSDT — 2025 Technical RoadmapTIAUSDT — Daily Technical Roadmap
🕞 60-Second Read
Trend on the 1-D chart is still structurally bearish ; price (spot 2.865 USDT) just carved a higher-low off the 2.44 vector block and is knocking on the Yearly BC lid. Two large upside voids now beckon.
Hot-Zone #1 – 2.60 → 2.44 (1 D + 4 H vector demand): stacked fresh liquidity, 9-15 % under spot.
Hot-Zone #2 – 2.985 (Yearly BC): first breaker & range cap, only 4 % above; a daily close above here opens the air-pocket to 4.27.
Hot-Zone #3 – 4.932 → 6.947 (Yearly Pivot ↔ Yearly TC): macro supply shelf guarding a 72-142 % rally window.
💧 Liquidity & Imbalance
Daily vector 7.85 (77 % fill-rate inside 60 d).
Stacked 4 H vectors 9.86 / 9.83 = 2.5 % supply shelf.
Demand stack 2.69 – 2.44 only 18 d old.
⚡ Volatility & Momentum
GMMA Z-Score curling up from −2 σ; short ribbons still under long ribbons – suggests pause, not reversal.
🎲 Probability Dashboard
HTF Structure −3
Liquidity voids +1
Momentum −1
Vol-regime 0
Bear / Neutral / Bull ≈ 42 % / 33 % / 25 %
📈 Trade Playbook
Strategy 1
1. Layered Limit Grid – Aggressive Counter-Trend Long
Entry layers (size %):
2.60 – 40 % of your allocated TIAUSDT size
2.44 – 30 %
2.05 – 20 %
1.90 – 10 %
SL = 1.75 (≈ 1 ATR below extreme demand)
TP ladder:
2.985 – 25 % off-load
3.722 – 25 %
4.932 – 25 %
6.947 – 15 %
7.849 – 10 %
Weighted R:R ≈ 4.3
Strategy 2
2. Layered Limit Grid – Conservative Breakout Long
Trigger: daily close > 3.722 (Yearly Low reclaim), then place grid orders.
Entry layers (size %):
3.75 – 40 %
3.55 – 30 %
3.25 – 20 %
2.985 – 10 %
SL = 2.70
TP ladder:
4.932 – 30 %
6.947 – 30 %
7.849 – 20 %
9.860 – 15 %
12.432 – 5 %
Weighted R:R ≈ 3.8
⚠️ Risk Radar
Low-float token – slippage risk on size.
Macro event: FOMC 1 May → volatility spike possible.
BTC options IV rising – spill-over risk to alts.
Price must conquer 2.985 to open the upside magnet trail toward 4.27 → 4.93. Failure keeps 2.60 → 1.90 demand stack in play before any durable markup.
Not financial advice – do your own research & manage risk.

#TIA/USDT#TIA
The price is moving within a descending channel on the 1-hour frame, adhering well to it, and is heading towards a strong breakout and retest.
We are experiencing a rebound from the lower boundary of the descending channel, which is support at 2.18.
We are experiencing a downtrend on the RSI indicator that is about to be broken and retested, supporting the upward trend.
We are looking for stability above the 100 Moving Average.
Entry price: 2.27
First target: 2.36
Second target: 2.42
Third target: 2.53

TIAUSDT Bottoming Out?TIAUSDT Technical analysis update
TIAUSDT has been trading within the longest descending channel. The price has once again touched the channel support and also retested the November 2023 support level or bottom. A strong bounce from this zone is likely, and we could potentially see a 100–150% move from the current level.

Is TIA About to Break Down Hard? Traders Beware Before It’s lateYello, Paradisers! Did you catch the recent bullish rally on #TIAUSDT? It’s been delivering solid gains over the past couple of days, giving traders reason to celebrate. But what if we told you that this rally might just be setting up a classic trap—one that smart money is already preparing to take advantage of? The technical structure forming right now suggests a high probability of a reversal, and if you’re not paying attention, you might end up on the wrong side of the move.
💎#TIAUSDT, at the core of setup is a developing a probable Bearish Gartley pattern. These harmonic structures are rare but extremely powerful when they align with multiple technical confirmations and that’s exactly what we’re seeing here. With the recent move upward, TIAUSDT appears to have completed its C leg, a critical part of the Gartley structure. This sets the stage for the D leg, which typically completes much lower. The price reacted strongly from the C leg area, which also happens to line up perfectly with a previous local high adding even more probability to the resistance at that zone.
💎This resistance isn't just horizontal there's a dynamic element at play as well. The 21-period EMA on multiple timeframes is currently acting as a ceiling for price action. When a key moving average starts rejecting price repeatedly, it often signals that the current trend is losing steam and this dynamic resistance only strengthens the case for a downside move from here.
💎Looking deeper, the bearish signs are confirmed by momentum indicators. The RSI on lower timeframes is not only overbought but also showing clear signs of bearish divergence. This divergence occurs when the price continues to make higher highs while RSI starts forming lower highs a classic sign that momentum is weakening. It’s one of the more reliable early warnings that a reversal may be near. In this case, RSI is flashing that warning now, suggesting that buyers may soon run out of fuel.
💎If this bearish probable scenario plays out as expected, the first key level to watch on the downside sits around the 3.278 zone. This minor support may offer a temporary bounce, but if the D leg of the Gartley is to be completed, we could see even deeper price action. This makes the current area extremely sensitive—any weakness from bulls could trigger a fast move downward.
💎However, no pattern is complete without an invalidation level, and for the Bearish Gartley, that comes in around the 3.805 resistance zone. A strong, sustained close above this level would invalidate the bearish setup and signal renewed bullish momentum. Until then, all technical signals are pointing toward caution, especially for those still riding long positions without a tight risk plan.
Stay alert, Paradisers. The market is about to decide. This is a textbook moment where emotions can take over, and late buyers get punished for chasing green candles. That’s why, we are playing it safe right now. If you want to be consistently profitable, you need to be extremely patient and always wait only for the best, highest probability trading opportunities.
MyCryptoParadise
iFeel the success🌴

TIAUSDT 3DTIA ~ 3D Analysis
#TIA Key support that must be maintained. Loss of this support, LSE:TIA price will be more depressed lower.

TIAUSDT – Weak at Key Weekly Level! More Downside Ahead?TIAUSDT – Weak at Key Weekly Level! More Downside Ahead?
“This chart looks weak—momentum favors the downside. But is there a bounce first?”
🔥 Key Insights:
✅ Sitting at a Critical Weekly Zone – A breakdown here could be brutal.
✅ Momentum Looks Bearish – No real strength from buyers.
✅ Only Considering Low-Risk Buys – Fibonacci Green Zone (0-0.5) is the ideal cheap area.
💡 The Smart Plan:
Looking for a Break & Retest Downward – If support cracks, shorts become clear.
Small Risk Buys from the Fibonacci Zone – Only for aggressive traders.
CDV & Volume Profile Must Confirm – No buyers? No trade.
“Weak price action, heavy risk. Only the right levels matter here—watch closely!” 📉🔥⚠️
A tiny part of my runners;
🌊 WAVESUSDT.P: Demand Zone Potential
🟣 UNIUSDT.P: Long-Term Trade
🔵 XRPUSDT.P: Entry Zones
🔗 LINKUSDT.P: Follow The River
📈 BTCUSDT.P: Two Key Demand Zones

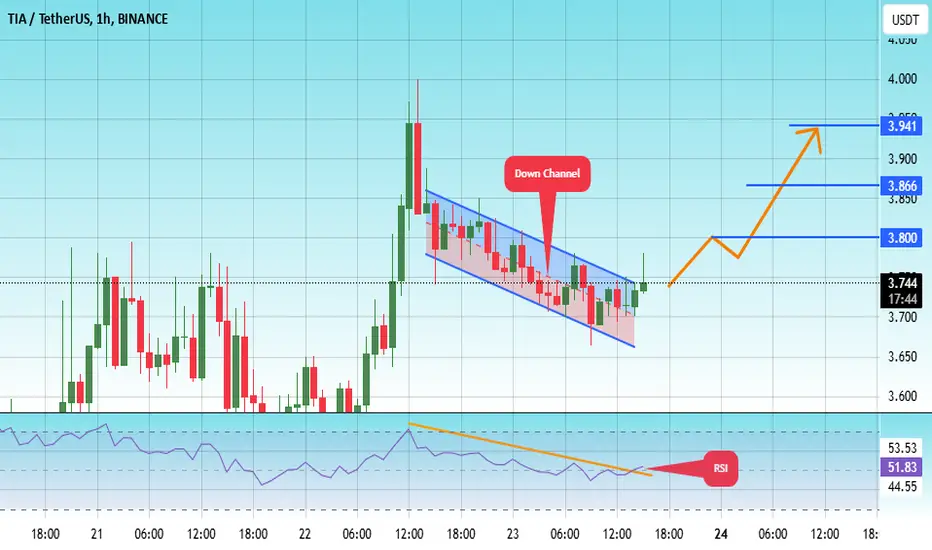
#TIA/USDT#TIA
The price is moving in a descending channel on the 1-hour frame and is adhering to it well and is heading to break it upwards strongly and retest it
We have a bounce from the lower limit of the descending channel, this support is at a price of 3.67
We have a downtrend on the RSI indicator that is about to break and retest, which supports the rise
We have a trend to stabilize above the Moving Average 100
Entry price 3.74
First target 3.80
Second target 3.86
Third target 3.92
TIA target $5.64h time frame
-
Entry: $2.96
TP: $5.64
SL: $2.66
RR: 8.77
-
(1) TIA is still correcting and building the bottom structure after dump on 3rd Feb.
(2) Double bottom is one of the possible structure, the potential right leg is $2.9
(3) Fibonacci provides first target at $4.5 and final target at $5.6
(4) Stop loss once going below $2.66

TIAUSDT 3DTIA ~ 3D Analysis
#TIA This is the lowest support block for now. Buy gradually from here with a minimum target of 15%++.

tiausdt trade idea.tiausdt chart says everything, price creating lower lows. Now I am expecting price to create another lower low to grab previous day and week low liquidity then a good move up and breakout through channel.

#TIA/USDT#TIA
The price is moving in a descending channel on the 1-hour frame and is expected to continue upwards
We have a trend to stabilize above the moving average 100 again
We have a descending trend on the RSI indicator that supports the rise by breaking it upwards
We have a support area at the lower limit of the channel at a price of 4.33
Entry price 4.72
First target 4.90
Second target 5.12
Third target 5.47

#TIA/USDT#TIA
The price is moving in a descending channel on the 1-hour frame and is expected to continue upwards
We have a trend to stabilize above the moving average 100 again
We have a descending trend on the RSI indicator that supports the rise by breaking it upwards
We have a support area at the lower limit of the channel at a price of 4.65
Entry price 4.70
First target 4.91
Second target 5.10
Third target 5.32


#TIA/USDT Ready to go higher#TIA
The price is moving in a descending channel on the 4-hour frame and sticking to it well
We have a bounce from the lower limit of the descending channel, this support is at 7.30
We have a downtrend on the RSI indicator that is about to be broken, which supports the rise
We have a trend to stabilize above the 100 moving average
Entry price 8.64
First target 8.90
Second target 9.50
Third target 10.02

TIAUSDT - great targets aheadweekly chart displays breakout the descending channel since about 12 months!!
it's just begaining .. big move did'nt started yet
target around 60$🎯

#TIA/USDT#TIA
The price is moving in a descending channel on the 4-hour frame and it was broken upwards
We have a trend to stabilize above the moving average 100
We have an upward trend on the RSI indicator that supports the rise by breaking it upwards
We have a major support area in green at a price of 4.50
Entry price 5.40
First target 6.33
Second target 6.60
Third target 7.60

TIAUSDT Breaks Resistance: Strong Bullish Move AheadTIAUSDT Technical analysis update
TIAUSDT has been consolidating for the past 160 days, repeatedly testing the trend resistance line. Today, the price broke above the resistance line on the daily chart and crossed above the 100 EMA. A strong bullish move is anticipated in the coming days.
Buy zone : Below $6.30
Stop loss : $5.32
Take Profit 1: $7.10
Take Profit 2: $8.50
Take Profit 3: $11.85

Tia/Usdt Looks Promising TIA/USDT is currently consolidating near a key resistance level, showing signs of potential upward momentum. The price has been moving within a tight range, indicating that a breakout could be on the horizon. Traders should monitor this pair closely for confirmation signals as the next move could be significant.
Key resistance and support levels to watch:
- Resistance:
- Support:
To approach this trade effectively:
1. Wait for a clear 4-hour or daily candle to close above the resistance level, signaling a potential breakout.
2. Look for a noticeable increase in trading volume during the move, as this often validates the strength of the breakout.
3. Be cautious of fake breakouts, which can occur if price reverses sharply after a temporary move above resistance.
Risk management is essential in this scenario. Set stop-loss levels below recent support zones to protect against unexpected reversals. For those already in the trade, this is a good time to review your strategy and adjust accordingly.
As always, this analysis is for informational purposes only. Conduct your own research before making any trading decisions.

TIAUSDTTIA ~ 3D
#TIA Currently moving on this descending channel,. If you want to buy this coin,. It's best to wait for this descending channel to be successfully penetrated. with a minimum target of 20%+

Important sideways range: 4.556-6.008
Hello, traders.
If you "Follow", you can always get new information quickly.
Please click "Boost".
Have a nice day today.
-------------------------------------
(TIAUSDT 1M chart)
There is still little to know from a long-term perspective.
-
(1W chart)
The MS-Signal (M-Signal on the 1W chart) indicator must rise above and maintain the price to likely turn into an uptrend.
Therefore, the key is whether it can rise above 6.008.
Currently, the BW(0) line is formed at 5.124, so if it shows support near this area, it is a time to buy.
Accordingly, the important point is whether it can move sideways around the 4.556-6.008 area and then rise.
-
(1D chart)
The box area of the HA-Low indicator (4.166) is formed over the 3.883-4631 area.
Accordingly, if it is supported near 4.566 and rises, it is highly likely to create an upward wave.
However, since the box area of the HA-High indicator (5.874) is formed over the 5.052-6443 area, in order to lead to an additional rise, the price must rise above the HA-High indicator and maintain it.
Accordingly, we can see that the area around 6.008 is an important support and resistance area.
----------------------------------
This coin (token) has not yet formed a clear shape (trend).
Accordingly, I think it is a good idea to buy when it rises above the M-Signal indicator on the 1W chart and shows a price maintenance pattern.
In other words, for now, we can see that the time to buy is when it rises to around 6.008 and shows a price maintenance pattern.
If you want to buy before that, I recommend checking whether it is supported when it falls below the section and breaks through upwards and then buy.
1st: 5.124
2nd: 4.556
-
Have a good time.
Thank you.
--------------------------------------------------
- Big picture
I used TradingView's INDEX chart to check the entire section of BTC.
(BTCUSD 12M chart)
Looking at the big picture, it seems to have been following a pattern since 2015.
In other words, it is a pattern that maintains a 3-year bull market and faces a 1-year bear market.
Accordingly, the bull market is expected to continue until 2025.
-
(LOG chart)
Looking at the LOG chart, we can see that the increase is decreasing.
Accordingly, the 46K-48K range is expected to be a very important support and resistance range from a long-term perspective.
Therefore, we do not expect to see prices below 44K-48K in the future.
-
The Fibonacci ratio on the left is the Fibonacci ratio of the uptrend that started in 2015.
That is, the Fibonacci ratio of the first wave of the uptrend.
The Fibonacci ratio on the right is the Fibonacci ratio of the uptrend that started in 2019.
Therefore, this Fibonacci ratio is expected to be used until 2026.
-
No matter what anyone says, the chart has already been created and is already moving.
It is up to you how to view and respond to it.
Since there is no support or resistance point when the ATH is updated, the Fibonacci ratio can be appropriately utilized.
However, although the Fibonacci ratio is useful for chart analysis, it is ambiguous to use it as a support and resistance role.
The reason is that the user must directly select the important selection points required to create the Fibonacci.
Therefore, it can be useful for chart analysis because it is expressed differently depending on how the user specifies the selection point, but it can be seen as ambiguous for use in trading strategies.
1st: 44234.54
2nd: 61383.23
3rd: 89126.41
101875.70-106275.10 (when overshooting)
4th: 134018.28
151166.97-157451.83 (when overshooting)
5th: 178910.15
-----------------

#TIA/USDT#TIA
The price is moving in a descending channel on the 1-hour frame and is sticking to it well
We have a bounce from the lower limit of the descending channel and we are now touching this support at a price of 4.20
We have a downtrend and the RSI indicator is about to break, which supports the rise
We have a trend to stabilize above the moving average 100
Entry price 4.20
First target 4.63
Second target 4.98
Third target 4.43

TIA target $1212h time frame
-
Entry: $12
TP: $4.8
SL: $3.59
RR: 5.49
-
(1) TIA is building a big accumulation with a polyline structure
(2) Will be very strong once breaking above this structure
(3) Fib extension provides final target at $12
(4) Stop loss once going below $3.59
