$TLT: Keep an eye on this$TLT has reached the end of a huge weekly and monthly down trend, and made me think it could be a long lasting bottom for fixed income here. Question is: Does this low hold after the next FOMC or not?
The daily chart shows a setup where a daily uptrend is set to expire by tomorrow, which could mean the current advance is over, or, perhaps, it needs some time sideways to build for a new move to the upside over time. If you can figure out what bonds will do, you have pretty big odds of getting all the rest right overall, so I'm extremely motivated to figure out what comes next here.
Keep an eye out for the daily signal outlook here, and be on guard for a weekly scale breakout to the upside to buy or add to existing longs.
Cheers,
Ivan Labrie.
TNX

$TNX & 2Yr yield showing basing signs, issue for stocks soon?Haven't heard much on #yields lately
$TNX & 2yr #yield
#TNX forming base, what are bonds saying here?
2yr not as strong
Weekly shows squeeze in a direction soon for both
#technology $NDX #NDX

AW Bitcoin Analysis - The Macro View Aligns with the Waves...In this video I explain why I believe the waves line up with the macro thesis.
Short term; the waves are an amazing tool especially when you use AriasWave for analysis.
The bigger picture though, has its own list of fundamental reasoning behind it.
The point is that as I go through the interest rate chart alongside the Bitcoin chart, it only takes a bit of logic to see what is happening here.
Bitcoin is a risk asset and during times of increasing inflationary pressures built up over 40+ years of stimulus, eventually the problem becomes too much to bear.
The FED and other central banks are stuck between a rock and a hard place when it comes to appeasing investors.
It has become too difficult to make everyone happy all in one go, not that they really ever cared about Main Street.
I always like to use the boiling frog analogy, it's only when things get really bad that everyone starts to take notice.
Unless you have been living under a rock it's not hard to see that constantly depreciating your currency eventually starts to affect the whole world.
As a result, the general population find themselves under immense financial pressures and have less dry powder to invest in these risky assets.
***AriasWave is not the same as Elliott Wave so your counts may differ to mine if you happen to use it.***
Remember to use Disciplined Money Management Principles to ensure longevity as a trader.
If you don't know the long term pattern shouldn't you be doing your research instead of just following the crowd?
Just remember: I am not a financial adviser; I suggest using this only as a guide. Always do your own research.

tnx possibilitynot confident of this path but have to note it. general tink ing see inflation will be low if it negative or we continue

2Yr Yield creeping up slowly$TNX is closed atm but if the 2yr is an indication it may open higher
We re-entered long yield after FED day in DEC.
Sold puts on $TYO & bought common
Didn't go heavy because Monthly chart is a tad tough.
Weekly 2yr trading decently above avg's again
So far so good.
We were bullish on STOCKS but that was late Oct/Early Nov, then went bearish for a bit, & are now NEUTRAL.
EDIT:
Keep in mind that in BULL MARKETS items can remain OVERBOUGHT for long periods of time.

10Y Rate - Headed HigherToday you can review the technical analysis idea on a 1W linear scale chart for 10 Year Treasury Yield (TNX).
In December 2021, I posted a chart showing that the 10Y rate was going to go much higher. I was exactly on point almost to the exact number.
Today I was reviewing the 10Y rate chart and saw the RSI formed a double bottom base with the 10Y rate ready to make another move higher. I also added in the Keltner Channel indicator which shows that when the 10Y rate is higher than the median line, there is a strong chance it touches the top of the Keltner Channel. I see the 10Y as well as other long term rates going much higher as shown in the chart.
If you enjoy my ideas, feel free to like it and drop in a comment. I love reading your comments below.
Disclosure: This is just my opinion and not any type of financial advice. I enjoy charting and discussing technical analysis. Don't trade based on my advice. Do your own research! #millionaireeconomics

$TNX outperforming 2yr last few days$TNX #yield pumping, above both avg's
2Yr not as much
Does this mean the street has finally caved in and believe that longer recession is a sure thing?
#economy

2yr Yield & $TNX2Yr #Yield is close to support @ 4
Look at that weekly performance!
However, monthly shows RSI readings above mid 70 has signified TOPS
ALSO
Depending on how Dec closes $TNX also looking weak
Look @ RSI
What is this telling you?
"Someone" buying loads of #bonds, who & why?


S&P 500 Price Action & Economic Data An overview of the market technical analysis from the major indices on the first day of the week prior to major economic data, the NFP. What will impact the market movement this week? We will be looking closely at the commodity market, bond yields, US Dollar and the Gold markets. We also touch on AMD stocks as our watchlist for this week.

Double bottom confirmed on the NasdaqA simple reversal trade setup on the Nasdaq. The tech index confirmed a double bottom pattern breakout on November 11th, the day after an epic rally which is among the best days of 2022.
The breakout has not seen any momentum as different Fed heads have come out saying different things, and some geopolitical tensions. The markets are still determining if the Fed will slow down on rate hikes and if inflation will slow down. These two things are a topic for a different post. Let's talk about the chart we see.
The Nasdaq saw buyers jump in right at the retest zone of the breakout pattern. This is just typical of what we expect from a breakout trade. Traders can either enter now and place their stops below the breakout zone, or await for the recent highs of 11,850 to be taken out before jumping in long. The latter is the more safer way to play and increases your probability of success as it confirms a higher low. Since trading is a business of probabilities, this is a very prudent way to play the trade.
There are also TWO other charts which are pointing at higher markets:
First, the US 10 year yield is the chart you must be watching to determine where stocks are going. We have a reversal pattern on this, and as yields drop, stock markets rise. Of course, a move into bonds needs to be assessed properly. We have seen a case where the 10 year dropped because of fear (the Poland-Ukraine missile issue). But generally, as yields drop, it is the market pricing in the Fed being less hawkish and even pausing rate hikes soon.
Secondly, the US Dollar Index (DXY) heading lower is a positive sign for markets for the same reason as above. A less hawkish Fed. The DXY also broke down and we are awaiting our first lower high.
Both of these continuing lower means a higher chance that stock markets, and yes the Nasdaq, continue their reversal recovery. But of course, the Fed in December could put a major halt to this move.

Roblox A downward trend broke out!Hello everyone,🙋🏾
⭐️Here again, Romluck with a new trading idea, Trade inside the channel.💡
⭐️ About Roblox Corporation develops and operates an online entertainment platform, The company was incorporated in 2004 and is headquartered in San Mateo, California.
⭐️David Baszucki is the founder and CEO of Roblox.
What I see:👀
A downward trend broke out👍
Supported on trend lines👍
Trade inside the channel👍
After a drop of about 80%, the downward trend was broken and now we are shuffling sideways.
First support at $29.
First resistance at $38
followed at $48.
An expected profit of about 20 dollars per share
⚠️Don't get excited! Do not be tempted! Easy money only exists in dreams and movies!⚠️
You need to make an entry and exit plan and a stop loss!
I chose to use a moving average of MA150 days back, it is recommended by many analysts and for the medium-long term work with MA150
⭐️ Want to be exposed to the stock indirectly? Choose an ETF..for example
METV - 6.8% Holding percentage in the fund
NASDAQ:VR - 6.4% Holding percentage in the fund
ARKF 1.54% Holding percentage in the fund
The trading ideas I find are after searching and investing time.
Thanks for the like and comment.⭐️
⚠️__🚧___🚧___🚧__🚧___🚧__🚧_🚧__🚧__🚧__🚧__🚧_🚧__🚧__🚧_🚧__🚧_⚠️
There is no recommendation for buying or selling or any action in the stock, I am not an investment advisor and publish this article as a hobby only.
Everyone has to perform risk management on their own or contact an investment advisor with a license, I don't have one.
Investing in the stock market involves risking your money!⛔️
have fun💃🏿

$TNX break rising wedge pattern & craters$VIX hits 1st target & likely bounce & then fill gap down
$DXY almost hit 1st target but hit this one PERFECTLY & almost to the day!
Not sure if 3rd target can be hit
$TNX falling hard on possible #FED pivot soon
All fits narrative we pointed out early Oct
IF fed keeps pushing, which they likely will, next year, we can see this pumping hard again

$DXY hits 2nd target, 3rd target likely hard to reach$VIX hits 1st target & likely bounce & then fill gap down
$DXY almost hit 1st target but hit this one PERFECTLY & almost to the day!
Not sure if 3rd target can be hit
$TNX falling hard on possible #FED pivot soon
All fits narrative we pointed out early Oct
#stocks

$VIX hits 2nd target we called, can it fill the gap?$VIX hits 1st target & likely bounce & then fill gap down
$DXY almost hit 1st target but hit this one PERFECTLY & almost to the day!
Not sure if 3rd target can be hit
$TNX falling hard on possible #FED pivot soon
All fits narrative we pointed out early Oct
#stocks

BTC, DXY, TNX - The Bear MarketHello friends,
Today I want to share some prior posts of BTC (Bitcoin), DXY (US Dollar Index) and TNX (10 Year Treasury Yield) that show how I came to my conclusion to liquidate my crypto and stock positions in December 2021 and share the same concerns with my community since November 2021. From this point, I still personally feel we have more downside to go in the crypto, stock, metals, and commodity markets.
Each of the charts below can be clicked on and viewed separately. I would recommend reviewing and understanding the charts and learning the indicators and oscillators. @TradingView is very useful and I recommend everyone learn to chart and understand the charts.
If you enjoy my ideas, feel free to like it and drop in a comment. I love reading your comments below.
Disclosure: This is just my opinion and not any type of financial advice. I enjoy charting and discussing technical analysis. Don't trade based on my advice. Do your own research! #cryptopickk

Why is $TNX NOT popping with hike?This year alone we've seen almost 400 basis points!
#FED rates are finally @ $TNX level!
We called this some time ago, catching up
Why is #TNX not ripping?
Likely believe there's not that much more in hikes by the fed
That HUGE negative divergence is telling
#stocks #bonds #crypto

$tnx entering sideways consolidation US10Y, aka $tnx is likely entering a phase of sideways consolidation before another leg up
Last time it came out of a bear market bottom, it took $tnx 11 years to clear the 4-5% area for good and begin its long term uptrend phase...
11 years that $spx used to compound gains of 180%
(long pertains to $spx) for yields perhaps long 3% is a good idea! but imo the easy money on yields has been made by now.

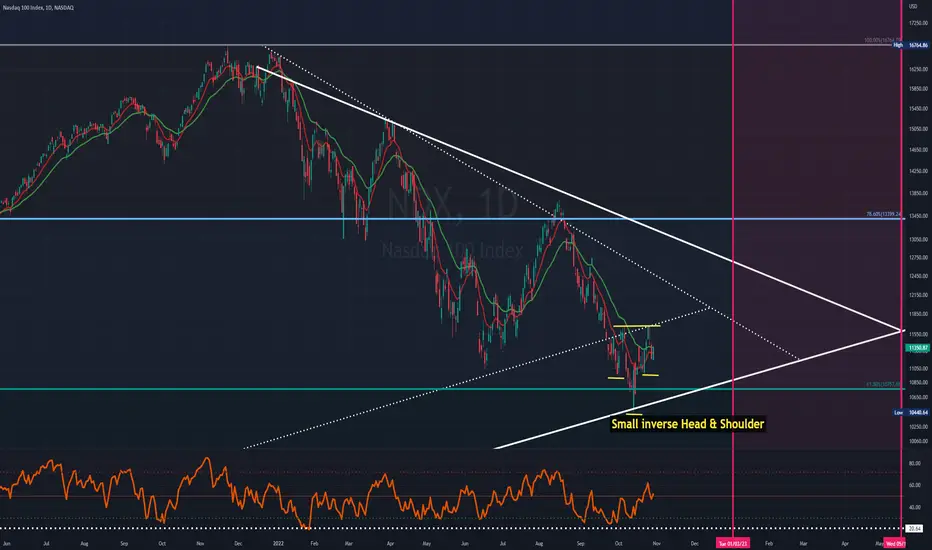
NDX severely lagged, catch up time?$NDX WEAK this entire time
We did say to focus $DJI type #stocks
#NDX has "hope" in Inverse Head & Shoulder
We do believe it can do SOME catching up but IMO not worth to put huge $ behind
$TNX seems 2b settling again #interestrates
Should get 1 more trading dip b4 eoy
US Treasury YIELDS 10s MINUS 2's Obvioulsy we are in a shit storm. end of the way we do business financially... BUt there is hope. Once yields invert to -6 to -7% we will have the biggest bull run you've ever seen.
BUt NOT FOR A WHILE.

TNX Coming out of the base accumulation to retest the next run ups. Waiting to see what happens w CPI on thursday

$TNX softness - Another indication for the expected rally Makes sense $TNX stopped falling as they stopped the bond buying program
It's been weaker so likely they started buying again
#inflation #interestrates
Will #fed reintroduce QE and/or also stop raising (short term at least) rates???

𝗩𝗼𝗹. 𝗨𝗽𝗱𝗮𝘁𝗲: $VIX Weekly. Five-wave patternHas built a triangle (five-wave pattern) over the course of this year. If resistance ~32 continues to hold could see a pullback, which would be bullish for equities
$VXX $SPY $SPX $QQQ $GLD $TLT $TNX $DXY
