Nasdaq100
The Nasdaq100 NASDAQ:NDX couldn’t hold above the support levels mentioned in our last report at 11376 points and opened the week with a gap below the significant 50%Fib. Level to open at 11472 points signaling that the bears are controlling the market backed by the bad news of the economy, then bears confirmed their control after the FED rate hike of 0.75 % last Wednesday to raise the interest rate to 1.75% and that will be reflected and affecting the earning results of the companies next month, breaking the 200EMA this week and closing below this level at 11265 points is the first confirmation of beginning a bear market on the medium term and may be the beginning of a downtrend on longer term.
The NASDAQ:NDX may witness a rebound to test the level of 11376 again and failing to penetrate this level or forming a lower high before even testing this level will be the second bearish signal for the index and that will lead the NASDAQ:NDX to more losses and we may witness panic selloff sessions, especially if the NASDAQ:NDX break the 10600 points level which is the most important and significant level on the medium term.
Investors with long positions are advised to use a disciplined risk management tools and activate the stop loss with all trades firmly
Investors with short positions are advised to use just 30% of their cash and use the trailing stop and the protective stop strategy
NASDAQ:NDX TVC:NDQ NASDAQ:QQQ NASDAQ:TQQQ AMEX:PSQ NASDAQ:SQQQ AMEX:SPY SP:SPX AMEX:SPXS TVC:DJI AMEX:SPY AMEX:DIA AMEX:DXD AMEX:DOG NASDAQ:IXIC
TQQQ

pullback from the lows startingtheres no guaruntee this is a longer or even intermediate term bottom, but a bounce is clearly underway today, and it looks like were pulling back from the downtrend on shorter timeframes. id imagine that if we manage to hold the hourly reversal staying above that TRAMA line now hovering around 22.63 breaking VWMA currently flattening out around 23.48 we should have the greenlight to close the gap at 24.77 and then threaten the 26 area

First Time This Has Ever Happened for Tech StocksSQQQ is the ETF that tracks the Nasdaq 100 ETF (QQQ) inversely. When tech stocks fall, SQQQ rises. Traders therefore use SQQQ to short tech stocks.
This is the first time, in its 12-year history, that SQQQ shows a fully red heatmap of the daily timeframe. A fully red heatmap represents extremely overbought conditions.
This is worse than the bottom in March 2020 and the bottom in 2018. This heatmap reflects that too many traders are too fearful of tech and growth stocks right now as they have all switched to shorting them.
Although it's hard to predict bottoms, this indicator coupled with the extremely low NDTH value (the percentage of Nasdaq 100 stocks that are above their 200-day moving average) could indicate that peak fear is occurring right now and that a potential rally will occur soon. The last time the NDTH was this low was on the exact day of the March 2020 bottom. Therefore, even in a recession, these values suggest bottoms.

TQQQ - Still has some way to fall (within trend channel)TQQQ - Still has some way to fall (within trend channel).
Given that this uptrend cycle started in 2011 is probably over given the new rate rising cycle, the bottom trendline channel will not hold either.

hourly picture still bullish, but not ruling out daily reversalthe hourly picture for the nasdaq is looking like weve managed to hold some support over a daily neckline. if that necklline is threatened, id imagine we are revisiting that lower level soon. if we break it- look out below as a close beneath $31 will probably dictate 29.24 or lower. if we manage to hang on to this daily uptrend and close above the 33 mark i would imagine were challenging 35. 32.97 remains where that flatlining TRAMA lies at the moment. choppy action trading in this range has been hard to swallow for a lot of swing traders who were hoping for a breakout, or trying to catch consolidation to the downisde. it has also been bearish for volatility however, and this could revive the bounce if we see a breakdown in vix soon.

TQQQ QQQ short term bullish Breakout of the falling wedge inside the falling wedge?
MA golden cross on the Hourly.

AMZN: Still can go a lot lower!Amazon is going down, it's no longer a major allocation for me. The next real support is 35% lower.

either forming bear cypher top or completing bull xabcdif we hold this low and beat low 33 area it should lead to 35 or high 34s
if we come down resisting low 32 area its doubtless still got more to lose and should see low 30s soon

TQQQ price predictiongoing to 39.9
As you can see this corresponds to a major point of prior support, and the .618 fib level.


Only Support Line for TQQQ15.15 is as low as TQQQ should drop for this bear cycle. The support has held steady since the last high in 2018.

NAS100 (Nadaq 100) - Within Uptrend channelNAS100 (Nadaq 100) - Within Uptrend channel.
Price action lurching towards lower channel bounds.
If lower trend line is breached, lookout!

ARKKK bear market leading the way down?Here we have ARKKs bear market pattern overlaid with US100. Just pointing out a possible pattern. Fully expect markets to rally with the end of May and into June which would be similar to how ARKKs bear market has played out so far.
Maybe things get spicy like they have for ARKK? Time will tell as the "crash" would be next year, so plenty of time to see how this plays out and observe.

$SPY Analysis, Key Levels, & Targets… $SPY Analysis, Key Levels, & Targets…
I am definitely still bullish, y’all… The last three days I’ve played daily calls and won and that is not indicator of anything because you can play both sides most of the time… but I am bullish…
We’re at the bottom of the channel… Yes, lots of funds blew up last week, but then there’s a lot of people that have been mostly in cash since jan (ME) that are itching to play again (outside of just the daily day trade scalping)…
There’s a lot of deals out there right now and I think that we will see a little bit of green in the next week or so. I’m sure the bottom’s not in but money is shifting around and some names you won’t be able to see this low again….
What stocks are you guys thinking about possibly nibbling on??
I bought NIO and RIVN, TQQQ, and AMD this week… definitely looking for others that have taken a beating lately….
Good luck y’all and as always let me know what you think, and sorry if I’m slow to respond sometimes…

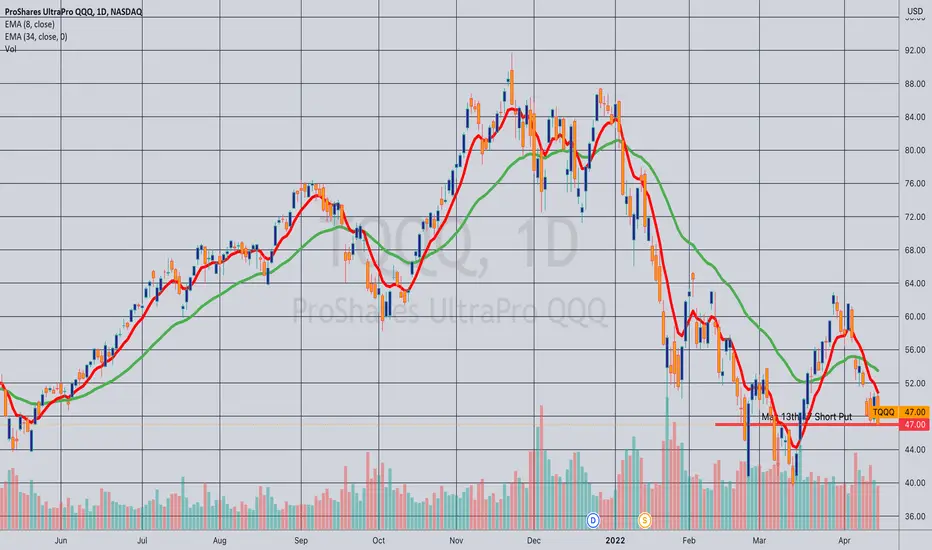
TQQQ Wheel of Fortune Modeling Although you can effectively model the P&L of 30 days 'til expiry at-the-money short puts, it's difficult to model "the other stuff" a trader would typically do with a short put that is in the money toward expiry (i.e., take assignment, roll out "as is," roll out for strike improvement, etc.). (At least, I don't have access to that kind of model or can't easily program one without breaking my brain).
You can, however, run a small number of occurrences (relatively speaking) to see how the setup would work in practice, so that you can have expectations as to how much the at-the-money 30 day short put pays over time, as well as the frequency of assignment and/or ending up with an in-the-money that has to be managed. You'd naturally have to run this for months to get any decent idea of how the setup would perform over a larger time frame. (Most studies actually look at selling a given strike in expiries of a given duration on a daily basis, which would be a lot of spreadsheet).
The basic rules:
1. Sell the at-the-money short put nearest 30 days until expiry.
2. Either close out the short put on approaching worthless (e.g., <.20) or run to expiry if in-the-money.
3. If assigned on any given short put, initially sell the 30 days until expiry call at the strike at which you sold the short put, looking to exit the resulting covered call at a profit.*
4. Since not everyone has "infinite cash," I'll assume a maximal deployment of 5 lots. As you can see by the chart, you can contemplate getting stuck in a particular rung or rungs for a lengthy period of time, reducing cost basis via rolls of the short call until you're able to exit that "leg" profitably or at break even. The ROC becomes almost immediately "less sexy" when that occurs, since that will potentially be "dead buying power" for weeks (and potentially months) at a time.
5. It's probably to one's advantage to have additional rules as to when and when not to pull the trigger on a given rung (i.e., implied volatility rank and 30-day implied), but for the sake of simplicity, I'm not setting out that type of rule here.
Pictured here would be the first leg, at the 47 strike in the May 13th expiry, paying 4.25 at the mid, with a resulting cost basis of 47.00 - 4.25 or 42.75 if assigned shares on the 47 short put.** For purposes of the return on capital calculation, I'm operating on the assumption that the short put will be cash secured,*** which means you'll tie up 42.75 of buying power to put this on, with the resulting ROC of 9.94% at max (implying a finish above the short put strike at expiry or the ability to pull off the short put on approaching worthless prior to that).
* -- In practice, this isn't what I do when confronted with an in-the-money short put at expiry. I look at (a) taking assignment; (b) rolling out the short put as is to varying durations; and (c) rolling out the short put with strike improvement to varying durations. I then compare and contrast what I would get for each in credit and generally opt for the choice that would result in the largest cost basis reduction. For example, I'm not going to take assignment to sell a call against for less credit than I could get by just rolling the short put out for duration.
** -- It doesn't look like you get much buying power relief on margin anyhow, at least with my broker. The buying power reduction for the 47 short put on margin appears to be 35.26 -- 75% of the short put strike. It's something, but not the typical relief you get on margin, which is about 20% of the short put strike. That being said, 4.25 on buying power effect of 35.26 is 12.05% at max -- a smidge sexier than cash secured.
*** -- I can also see a potential additional rule or rules that takes profit between 42.75 (your break even) and 47.00 toward expiry as extrinsic in the 47.00 converges on 0 or potentially rolls out the 47 to a 30 day at-the-money strike when it's in profit. On a practical level, I tend to do this quite a bit, but it's involves rolling from an out-of-the-money strike to an out-of-the-money strike, which continues to leave leave me with room to be wrong.
Resurrecting an old chart for BTC. Where it goes, NASDAQ followsI was convinced there was a crash coming last year and was charting a lot of interesting things. I was totally wrong.
Or, more kindly, we could say my timing was off (as per usual). But, revisiting my old chart, it looks like the same pattern has repeated and, once again, we're on the edge of a cliff. Last time it was all good and I was totally wrong.
But I can't shake what I'm seeing now.
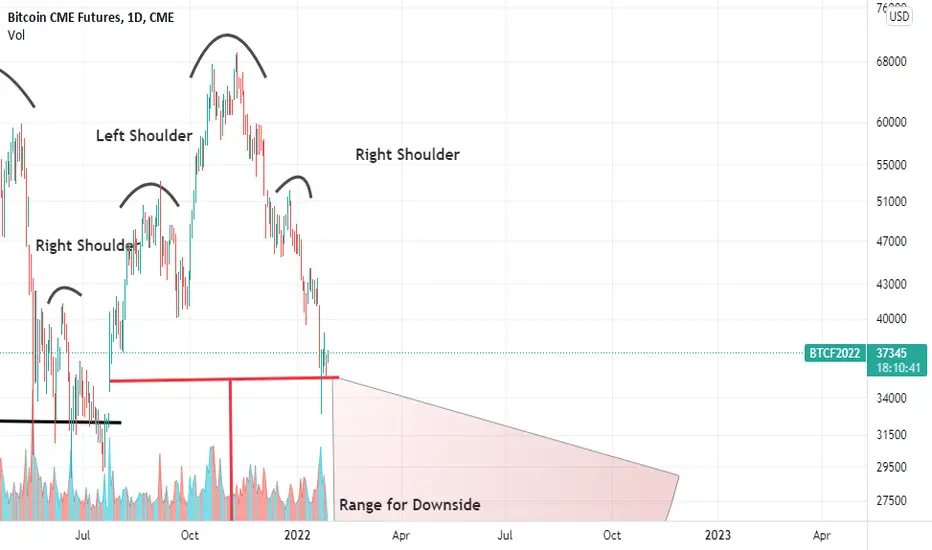
There was a clear head and shoulders in 2021 that came very close to confirming but then blasted up and never confirmed.
There is a head and shoulders now on BTC 6M chart that hasn't been confirmed but is very close. The neckline is roughly where the last one was. I don't believe in coincidences. Volume is in keeping with that pattern.
If it continues a general downward trend to $32K and beyond, it confirms and tumbles into the range I put on the chart.
If you want to go full bear on this thing, roll out to the five-year chart and look at the double top (and its support/resistance level). Same deal. Unconfirmed pattern but very close. Has to continue to drop to around $32K and beyond before it's confirmed.
If you want to go ultra bear, you could also look at the inverted cup and handle on the one-year chart. It's ticking all the boxes for that pattern but won't confirm unless it continues a trend down to $33K and beyond.
Sorry for making any crypto folks anxious. Not trying to spread despair. Just showing what I see. Again. It's not confirmed.
But where Bitcoin goes, the NASDAQ usually follows.
I'd like to say I hope I'm wrong but I went to cash and puts in '21. I couldn't shake what I was seeing in macroeconomic trends. I think we just staved off what was coming in 2021 until now.
I am sorry about all the carnage in the market for everyone. It sucks.
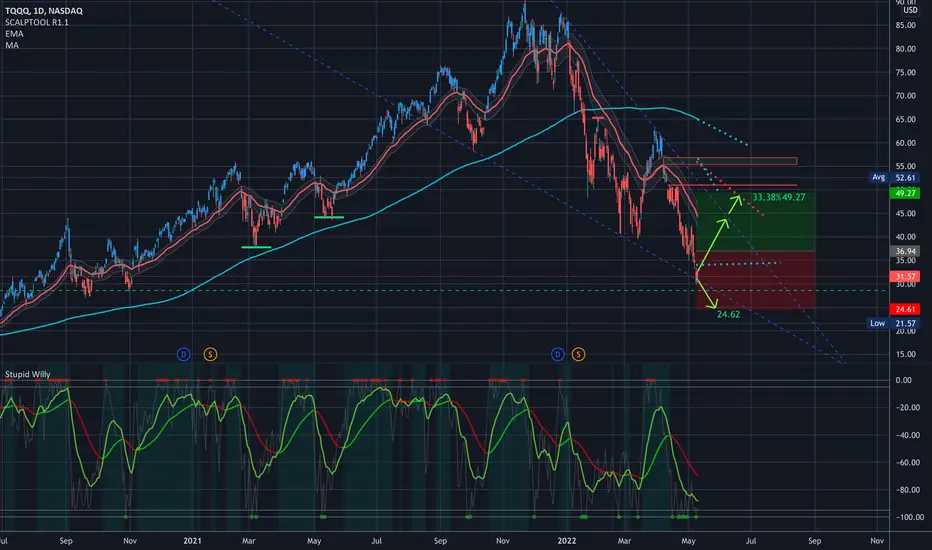
$TQQQ Update$TQQQ Update
So All 4 targets from my last post have hit and I have added at all of them. (I’ll repost the last one below) My average is now 36.94 and I’m looking for 49.27 for 33.38% profit.
IF the CPI comes in hot tomorrow and the market continues to sell off, then my next target to double my position will be at 20.12.
Be careful out there, guys… the market is insane right now…. One of the best ways to stay hedged is to be mindful of your position sizes and trade small…. Always make sure you have funds to adjust in case we still have further to fall….
---------
I am not your financial advisor. Watch my setups first before you jump in… My trade set ups work very well and they are for my personal reference and if you decide to trade them you do so at your own risk. I will gladly answer questions to the best of my knowledge but ultimately the risk is on you. I will update targets as needed.
GL and happy trading.
IF you need anything analyzed Technically just comment with the Ticker and I’ll do it as soon as possible…
TQQQ here to $50 to $28 then big rallyI really like this TQQQ rally from here, to $50 May 1st, drop to $28 June 1st then big rally out of it.


Nasdaq historyMarket history for long term investors. Market is in a big channel and sill healthy for long term.

welcome to the forever market, or more pain to come?tqqq is a big question because it is down a significant amount and a lead bear. if it turns into a lead bull here we could see 60% gains.

Could ProShares Split Again Soon? So far, it hasn't spent much time below 0, but that could change very quickly here. If TQQQ falls under $30 any time soon, ProShares will be forced to consider another split in record time.

TQQQ could be a KANG in time! When the whole market is looking to make their way to the down side....the hopium chart projections is where the fun is at!
Will take a little bit of patience for a nice entry to ride up. The closer we get down to the $15-$20 range will be able to see things a bit more clearly on when we could be seeing pivot back up. I feel like making it down to it's C19 low is of course on the probability list for its 3 bottom touches...
