Gold price analysis March 11⭐️Fundamental Analysis
Gold prices are struggling to capitalize on a modest intraday rebound from a one-week low and remain below $2,900 in Asian trading on Tuesday. Uncertainty surrounding US President Donald Trump’s trade policies and their impact on the global economy continues to weigh on investor sentiment. This, in turn, has supported the safe-haven bullion, attracting some intraday dip buyers near the $2,880 region.
Furthermore, the prevailing US Dollar (USD) selling bias, fueled by speculations that a tariff-driven slowdown in US growth could force the Federal Reserve (Fed) to cut interest rates multiple times this year, further underpins the non-yielding gold price.
⭐️Technical Analysis
Gold price is approaching the resistance level of session 2909 when breaking this zone waiting for the SELL zone in the European session at 2915-2918, the SELL margin is relatively wide. Support 2880 is still an important support level that gold needs more momentum to break this zone.
Trade

THE Trying To Bottom - Knife Catch MartyBoots here , I have been trading for 17 years and sharing my thoughts on ETH here.
THE is trying to bottom and bounce in the near term
This is a risky knife catch so be careful
Interesting situation and potential trade

Heikin Ashi Trade IdeaCOINBASE:BTCUSD
In this video, I’ll be sharing my analysis of BTCUSD, using my unique Heikin Ashi strategy. I’ll walk you through the reasoning behind my trade setup and highlight key areas where I’m anticipating potential opportunities.
I’m always happy to receive any feedback.
Like, share and comment! ❤️
Thank you for watching my videos! 🙏

Btcusd bullish mode Bearish Disruption to This Bullish Outlook
1. Lower High & Breakdown Structure (Bearish Bias)
The chart shows a clear lower high formation, indicating the market is in a downtrend cycle.
Price has already broken previous support and is retesting lower levels, which may act as resistance now, making the bullish path less likely without significant momentum.
2. Weak Rejection from Demand Zone (Bearish Warning)
The first bounce from the demand zone (around $78,000) is weak and lacks follow-through buying pressure.
This could mean buyers are not committed, increasing risk of demand zone failure and further drop toward $74,000-$72,000 levels.
3. Volume Analysis (Lack of Buyers)
Notice how the volume on the latest bounce is weak, showing no significant accumulation. For a strong rally to $90k+, we'd expect climactic buying volume—which is absent here.
Weak volume near critical zones often precedes false breakouts or deeper dives.
4. Possible Bear Flag or Continuation Pattern
Current consolidation between $78k-$80k may form a bearish continuation pattern (bear flag).
A break below $78k could trigger a sell-off targeting $75,000-$72,000.
5. Macro-Level Resistance Above
Even if BTC pushes up temporarily to the first supply zone around $83,000, heavy resistance and profit-taking likely happen there.
Without macro bullish news, sustained push to $90k+ is questionable in this current technical context.
Alternative Bearish Scenario Path (Disruption Path):
Break below $78,000 confirms sellers in control.
Targets:
First Target: $75,000
Second Target: $72,000-$70,000 (psychological support & previous demand area

XAUUSD long term 1. Weakness at Support Zone (Bearish Risk)
The price is hovering around the identified demand zone (blue box), but buyers are not showing strong defense yet. If this zone breaks, we could see a deeper correction toward $2,840 - $2,800, invalidating the bullish projection.
The dotted red line suggesting an immediate bounce might be premature without a bullish confirmation candle or volume spike.
2. Trendline Breach (Bearish Confirmation)
The ascending trendline (starting from February lows) has already been broken and retested. This typically signals a trend reversal or deeper pullback.
If price remains below this trendline, the bullish continuation becomes less probable.
3. Possible Bear Flag Formation (Bearish Pattern)
The recent sideways action (consolidation within the demand zone) could be forming a bear flag, which is a continuation pattern for a move down.
A breakdown below $2,860 (flag bottom) would confirm this bearish pattern, targeting potentially $2,800 or lower.
4. Momentum Shift
RSI/MACD (if checked) may show bearish divergence from recent highs or weakening momentum, suggesting buyers are losing control.
Alternative Bearish Scenario (Disruption Path):
If price breaks and closes below $2,860 - $2,840:
Short-term target: $2,800 - $2,760.
Invalidates bullish target of $3,000 for now

BTCUSD MORE BUY BREAKING NEWS BTC ALL TIME HIGH 100K SOON1. Overly Aggressive Upside Projection
The projection to 97,450 implies a nearly 19% move up from the current level (81,693) without clear intermediate confirmations. This may overlook key lower resistance areas (such as the previous support at ~86,000–88,000) that could act as barriers before a move to 97,000. A step-by-step approach would be more reasonable.
2. Neglecting Bearish Continuation Risk
The analysis focuses heavily on bullish recovery and seems to ignore the ongoing bearish trend in the last several days. If BTC fails to hold the 80,133 "bullish support area", there could be continuation to the downside toward 78,000 or even 75,000 based on prior breakdown levels. No contingency is shown in case the support fails.
3. Volume Mismatch
Notice the recent volume spikes are seen on down candles, suggesting strong selling interest. There's no confirmation of buying volume accumulation to support such an aggressive reversal. Ignoring this discrepancy can lead to a false sense of bullish momentum.
4. Broad Market Context Missing
The chart does not seem to factor in broader macroeconomic or crypto-specific news. Given the U.S. economy's impact (as suggested by the USD sign and U.S. flag symbols), interest rate decisions, CPI data, or regulatory news can disrupt any bullish narrative.
5. Overconfidence in Single Zone
The "Support bullish area 80.133" is treated as a final reversal point. In reality, markets often fake out below such key zones before reversing (a "stop hunt"). A more realistic analysis would outline alternative supports below 80k and conservative resistance targets.
Alternative Bearish Scenario (Counter Analysis)
1. Break below 80,133 triggers continuation toward 78,000 and 75,000.
2. Any bounce toward 84,000 or 86,000 could be rejected if volume does not support it.
3. Resistance between 86,000 and 88,000 should be observed for weakness if reached.
4. Lower highs and lower lows forming suggest continuation down unless broken

GBPUSD BUY BUY BUY BUY BUY ACTIVE Disruptions on the Current Bullish Analysis:
1. Possible Bull Trap at Current Supply Zone:
Price is hovering around a supply zone (highlighted red dashed box). If buyers fail to push beyond this zone convincingly, a sharp rejection could follow.
This area could serve as a distribution zone, leading to a fake breakout and reversal.
2. Overbought Conditions (Momentum Exhaustion):
Given the sharp rally towards 1.29347, momentum indicators (e.g., RSI, Stochastic) are likely overbought. This suggests limited upside potential before a pullback.
A retracement to 1.28000-1.27500 (major horizontal demand) could be in play before moving higher.
3. Low Volume on Breakout Attempt:
If the recent breakout attempt above 1.29000 happened on declining volume, this weakens the bullish outlook and hints at lack of strong buyer commitment.
Volume confirmation is critical for sustaining breakouts; otherwise, sellers may take control soon.
4. Reversal Pattern Formation Possibility:
The sharp upward move could complete a potential double top formation near 1.30436 if price rejects around 1.29500–1.30000.

XAUUSD BUY NOW this week big movement gold strongly bullish soonThanks for the clarification. Based on the chart you provided and the bullish bias toward the resistance target of 2950, here’s a "disruption" or alternative analysis—a contrarian scenario that challenges the bullish view:
Bearish Disruption Analysis:
1. False Breakout & Rejection Scenario:
Current price hovering around 2910.795 shows a struggle to break higher.
Price previously failed to sustain above the minor resistance zone near 2918–2920, showing rejection wicks.
This may indicate buying exhaustion, and if no fresh momentum comes in, price could reverse.
2. Support Weakening:
The 2906 support zone has already been tested multiple times.
Each retest of this support weakens the buyers' defense.
A break and close below 2906 would open doors to deeper pullbacks — potential targets:
First target: 2895 (psychological and historical intraday support).
Extended target: 2880–2885 zone.
3. Volume Divergence:
Noticeable reduction in buying volume on recent attempts to move higher.
Without increasing volume, it's hard for price to break out toward 2950.
4. Potential Bearish Formation:
Formation of a lower high pattern, suggesting a potential trend reversal from bullish to bearish in this short-term timeframe (H1)

WTI - High Probability of Continued Downtrend US Light Crude's 4-hour chart suggests a high probability that price will continue with the dominant downtrend and eventually break below recent lows. Currently trading around $67.17, crude oil has been in a persistent decline since late February, forming a series of lower highs and lower lows. The chart's projected path indicates a potential corrective bounce within the blue box area (approximately $68.50-$69.50), characterized by zigzag movements that would likely form a complex correction before resuming the bearish trend. This anticipated bearish continuation targets the horizontal red support line at around $65.77, with potential for moves below this level as indicated by the downward arrow. Recent failed attempts to sustain rallies and the steep decline from the $74.00 area reinforce the bearish outlook, suggesting that any upward movements should be viewed as selling opportunities within the larger downtrend.
Disclosure: I am part of Trade Nation's Influencer program and receive a monthly fee for using their TradingView charts in my analysis.

XAG/USD: Dual Paths to Bullish ResolutionSilver's 4-hour chart presents two potential scenarios for price action in the near term. In the first scenario, price could break above the current consolidation around $3,254 and move directly toward the red resistance line at approximately $3,278, as indicated. Alternatively, the second scenario suggests we may first see a deeper retracement toward the lower blue box support zone (around $3,160-$3,180) before finding buyers and resuming the upward movement, as illustrated by the zigzag pattern and second arrow. Both scenarios ultimately project bullish outcomes, with price expected to challenge the upper resistance after completing either path. The recent recovery from the late February lows around $3,080 provides the foundation for this bullish bias, though traders should monitor which scenario unfolds to adjust their entry strategies accordingly.
Disclosure: I am part of Trade Nation's Influencer program and receive a monthly fee for using their TradingView charts in my analysis.

USDCAD - Bullish ProspectsUSD/CAD's 4-hour chart suggests that if we see a nice correction in the current area around 1.434, we may experience a continuation to the upside as indicated by the arrow on the chart. The pair has been showing volatility since early March, reaching a peak of approximately 1.4540 before pulling back. The projected path illustrated with the zigzag line indicates a potential corrective move down followed by renewed bullish momentum. This potential upside continuation would likely target levels beyond the recent high, with the current consolidation possibly serving as a base for the next leg up. The highlighted blue box area represents a support zone that could contain the correction before the anticipated upward move materializes. Traders should watch for price action confirmation within this region to validate the bullish scenario.
Disclosure: I am part of Trade Nation's Influencer program and receive a monthly fee for using their TradingView charts in my analysis.

USDJPY - Bigger correction on the daily timeframeUSD/JPY's daily chart indicates we're expecting a larger correction in the near term, followed by a likely continuation of the downtrend toward the blue box target area (143.50-146.00). After reaching peaks near 162.00 in July 2024 and 158.00 in December 2024/January 2025, the pair has established a series of lower highs, creating a clear downtrend pattern. Currently trading around 148.05, the price sits at a critical juncture, with the projected path suggesting a temporary bounce (as illustrated by the zigzag line) before bearish momentum likely resumes. This outlook is supported by the consistent lower highs since mid-2024, the price's position near a historical support/resistance level, February's failed attempt to sustain prices above 150, and the overall downward momentum that has dominated since December 2024.
Disclosure: I am part of Trade Nation's Influencer program and receive a monthly fee for using their TradingView charts in my analysis.

60% Upside - H5 Trade of the Week!H5 Trade of the Week!
In this video, we are talking about a phenomenal potential trade that allows us to take action if we get some key items.
Everything is lining up for this one. We just need a few more items, and it will be time to enter!
NYSE:OSCR Breakout = $24/ $28
Not financial advice


DOT/USD LONG SET UPTime Frame: 1D
Entry Price 1: $4.40
Entry Price 2: $3.40
Stop Loss: $2.40
Take Profit 1: $5.40
Take Profit 2: $7.50
Take Profit 3: $9.50
Take Profit 4: $11.50
Status: ACTIVE


USDJPY STRONG FALLING OPPORTUNITY 1. 144.00 Support May Hold Strong
The analysis assumes 144.00 will break, but this is a key psychological and historical support level.
If buyers step in, USD/JPY could reverse back up instead of continuing downward.
2. Rebound Towards 150.00 Possible
Instead of a lower low, USD/JPY could bounce off intermediate demand zones and attempt a retest of resistance at 150.00.
US economic strength (inflation, interest rates) could support the dollar and invalidate the downtrend.
3. Lower Highs are Not Confirmed Yet
If the price stays above 146.50, the trend could shift back bullish, disrupting the bearish projection.
Lack of strong selling pressure near 147.00-146.00 could mean the market is undecided rather than fully bearish
4. Macroeconomic Factors Favor USD Strength
If Bank of Japan (BoJ) remains dovish and the Fed keeps rates high, USD/JPY might resume its uptrend instead of falling

ETHUSD SURELY BULLISH 1. Support at 2130 May Fail
The chart assumes a bounce from 2130 support, but if ETH breaks below this level, it could trigger further liquidations and push price toward 2000 or lower.
Bearish divergence or weakening buy volume could signal a lack of strength.
2. Resistance at 2800 May Hold Strong
The projection suggests ETH will reach 2800, but this could be a strong supply zone where sellers step in.
If ETH struggles around 2400-2500, we might see a reversal instead of a breakout.
3. Lower High Formation
If ETH fails to break above previous highs (~2265+), it could signal a lower high, leading to a downtrend continuation rather than a rally.
Rejection near 2300-2400 might confirm a bearish structure.
4. Macroeconomic & Market Risks
If Bitcoin corrects or macro factors (rate hikes, regulatory news, or stock market weakness) pressure crypto markets, ETH might struggle to sustain upside momentum

XAUUSD strong bullish 1. (Xauusd)Support at 2900 May Not Hold
The chart suggests a bounce from the 2900 support area, but if market sentiment weakens, we could see a breakdown below 2900 instead of a recovery.
If this happens, gold might dip further toward 2850 or even 2800 before regaining strength.
2. Trendline Breakdown is Possible
There's an upward trendline acting as dynamic support, but multiple touches increase the chance of a breakdown rather than a continuation.
A confirmed break below this trendline could lead to bearish momentum rather than a push higher.
3. Resistance May Be Stronger Than Expected
The analysis suggests a move toward 2960-3000, but these levels could act as a strong resistance instead of a breakout zone.
Failure to break 2960 might trigger another sell-off back toward 2900 or lower.
4. Macroeconomic Factors Could Shift Bias
If the US Dollar strengthens or bond yields rise, gold could struggle to gain momentum, invalidating the bullish outlook

Btcusd analysis 1. Support May Hold – The chart suggests a drop to the support area (around $75K-$77K), but strong demand in that region could lead to a rebound instead of a further decline.
2. Higher Low Formation – If BTC stays above $80K and forms a higher low, the bearish breakdown may be invalidated, leading to another push toward resistance ($95K).
3. Liquidity Grab Above Resistance – The market might break above the resistance zone instead of rejecting it. A breakout beyond $95K could trigger a bullish rally toward $100K+.
4. Market Sentiment & Fundamentals – If BTC fundamentals remain strong (ETF inflows, institutional buying, positive macro factors), short-term technical patterns might be overridden by larger buying pressure

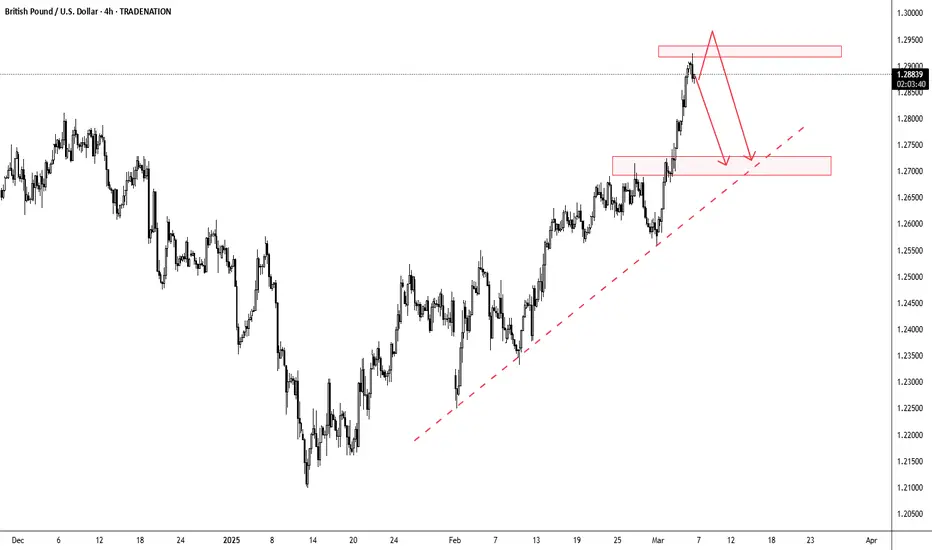
GBPUSD - Retracement to the trendline?The GBP/USD pair has exhibited a strong bullish trend since its January lows, currently trading at 1.2876. After reaching recent highs, the price is now at a critical decision point as shown by the chart's resistance area (upper red box) and ascending trendline. The sharp upward movement followed by the recent pullback suggests potential exhaustion of buying momentum, with the red downward-pointing arrows indicating a possible corrective phase ahead.
Two scenarios appear most likely from this technical formation: either price continues higher to break above the upper resistance box before initiating a correction, or an immediate correction begins from current levels. In both cases, the lower orange box around the 1.2700-1.2720 area serves as a reasonable target, as does the ascending trendline (marked by the red dashed line) that has supported the uptrend since January. Traders should watch for potential reversal signals or consolidation patterns to confirm which scenario is unfolding. As always don't jump into trades and wait for confirmation!
Disclosure: I am part of Trade Nation's Influencer program and receive a monthly fee for using their TradingView charts in my analysis.
GBPJPY - More downside?GBP/JPY appears to be in a potentially bearish setup after recently testing resistance. The chart shows that price has formed a significant consolidation zone with clear upper and lower boundaries marked by the red horizontal lines. After making a recent high, the price seems to be struggling to break above the upper resistance zone highlighted by the pink box. The long downward-pointing red arrow marked on the chart is our highest probability move that we anticipate right now.
Given the recent price action and failure to establish new highs above resistance, the higher probability move is likely downward. This bearish outlook is supported by the apparent double top formation near the resistance zone and the pronounced selling pressure that has emerged after testing these levels. Traders should watch for a potential breakdown below recent support levels, which could accelerate the downside move toward the lower boundary of the range as indicated by the arrow's trajectory.
Disclosure: I am part of Trade Nation's Influencer program and receive a monthly fee for using their TradingView charts in my analysis.

LONG GOLD NOWWW !!!Hi dear traders.
Xauusd will grow to 2960$ from live 2900$ price!
Take a Long position now and enjoy.
follow us, Be aware and enjoy.
