SILVER My Opinion! BUY!
My dear friends,
Please, find my technical outlook for NATGAS below:
The price is coiling around a solid key level - 33.100
Bias - Bullish
Technical Indicators: Pivot Points Low anticipates a potential price reversal.
Super trend shows a clear buy, giving a perfect indicators' convergence.
Goal - 33.330
About Used Indicators:
The pivot point itself is simply the average of the high, low and closing prices from the previous trading day.
Disclosure: I am part of Trade Nation's Influencer program and receive a monthly fee for using their TradingView charts in my analysis.
———————————
WISH YOU ALL LUCK
Trading

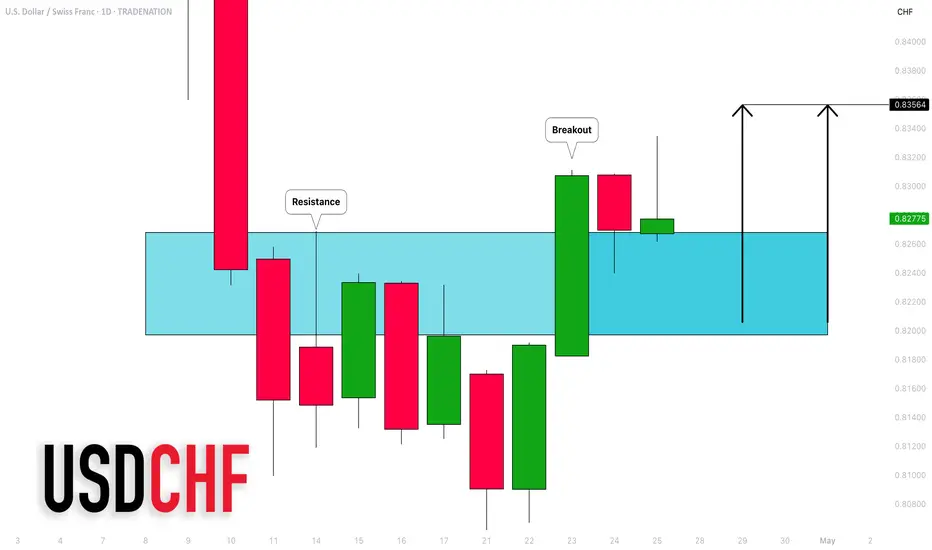
USDCHF: Important Breakout & Bullish Outlook Explained
USDCHF broke and closed above a key daily horizontal resistance area.
The broken structure most likely turned in a strong support.
I expect a bullish continuation from that next week.
Goal - 0.8356
❤️Please, support my work with like, thank you!❤️
I am part of Trade Nation's Influencer program and receive a monthly fee for using their TradingView charts in my analysis.
Learn the Harsh Truth About Success & Failure in Trading
The picture above completely represents the real nature of trading:
We all came here because we all wanted easy money.
Being attracted by catchy ads, portraying the guys on lambos, wearing guccies and living fancy lives, we jump into the game with high hopes of doubling our tiny initial trading accounts.
However, the reality quickly kicks in and losing trades become the norm.
The first trading account will most likely be blown .
In just one single month, 40% of traders will be discouraged and abandon this game forever.
The rest will realize the fact that the things are not that simple as they seemed to be and decide to start learning.
The primary obstacle with trading education though is the fact that there are so much data out there, so many different materials, so many strategies and techniques to try, so the one feels completely lost .
And on that stage, one plays the roulette: in the pile of dirt, he must find the approach that works .
80% of the traders, who stay after the first month, will leave in the next 2 years. Unfortunately, the majority won't be able to find a valid strategy and will quit believing that the entire system is the scam.
After 5 years, the strongest will remain. The ones that are motivated and strong enough to face the failures.
With such an experience, the majority of the traders already realize how the things work. They usually stuck around breakeven and winning trades start covering the losing ones.
However, some minor, tiny component is still missing in their system. They should find something that prevents them from becoming consistently profitable.
Only 1% of those who came in this game will finally discover the way to make money. These individuals will build a solid strategy, an approach that will work and that will let them become independent .
That path is hard and long. And unfortunately, most of the people are not disciplined and motivated enough to keep going. Only the strongest ones will stay. I wish you to be the one with the iron discipline, titanic patience and nerves of steel.
❤️Please, support my work with like, thank you!❤️
I am part of Trade Nation's Influencer program and receive a monthly fee for using their TradingView charts in my analysis.

SILVER Will Go Up! Long!
Here is our detailed technical review for SILVER.
Time Frame: 9h
Current Trend: Bullish
Sentiment: Oversold (based on 7-period RSI)
Forecast: Bullish
The market is trading around a solid horizontal structure 3,308.7.
The above observations make me that the market will inevitably achieve 3,462.2 level.
P.S
Please, note that an oversold/overbought condition can last for a long time, and therefore being oversold/overbought doesn't mean a price rally will come soon, or at all.
Disclosure: I am part of Trade Nation's Influencer program and receive a monthly fee for using their TradingView charts in my analysis.
Like and subscribe and comment my ideas if you enjoy them!

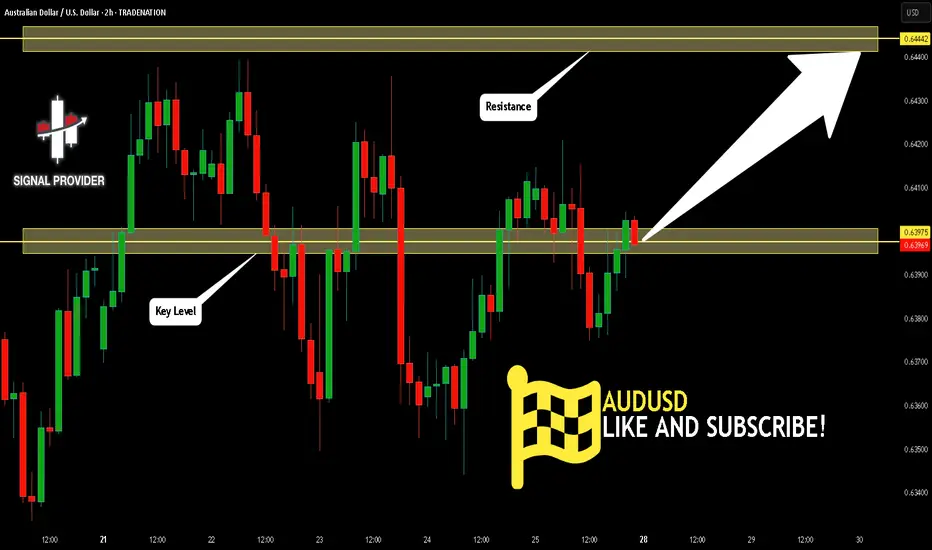
AUDUSD Will Move Higher! Buy!
Take a look at our analysis for AUDUSD.
Time Frame: 2h
Current Trend: Bullish
Sentiment: Oversold (based on 7-period RSI)
Forecast: Bullish
The market is testing a major horizontal structure 0.639.
Taking into consideration the structure & trend analysis, I believe that the market will reach 0.644 level soon.
P.S
The term oversold refers to a condition where an asset has traded lower in price and has the potential for a price bounce.
Overbought refers to market scenarios where the instrument is traded considerably higher than its fair value. Overvaluation is caused by market sentiments when there is positive news.
Disclosure: I am part of Trade Nation's Influencer program and receive a monthly fee for using their TradingView charts in my analysis.
Like and subscribe and comment my ideas if you enjoy them!
EURAUD Is Bearish! Short!
Please, check our technical outlook for EURAUD.
Time Frame: 1h
Current Trend: Bearish
Sentiment: Overbought (based on 7-period RSI)
Forecast: Bearish
The market is approaching a key horizontal level 1.775.
Considering the today's price action, probabilities will be high to see a movement to 1.765.
P.S
We determine oversold/overbought condition with RSI indicator.
When it drops below 30 - the market is considered to be oversold.
When it bounces above 70 - the market is considered to be overbought.
Disclosure: I am part of Trade Nation's Influencer program and receive a monthly fee for using their TradingView charts in my analysis.
Like and subscribe and comment my ideas if you enjoy them!

GBPUSD Will Grow! Long!
Please, check our technical outlook for GBPUSD.
Time Frame: 9h
Current Trend: Bullish
Sentiment: Oversold (based on 7-period RSI)
Forecast: Bullish
The price is testing a key support 1.329.
Current market trend & oversold RSI makes me think that buyers will push the price. I will anticipate a bullish movement at least to 1.342 level.
P.S
Overbought describes a period of time where there has been a significant and consistent upward move in price over a period of time without much pullback.
Disclosure: I am part of Trade Nation's Influencer program and receive a monthly fee for using their TradingView charts in my analysis.
Like and subscribe and comment my ideas if you enjoy them!

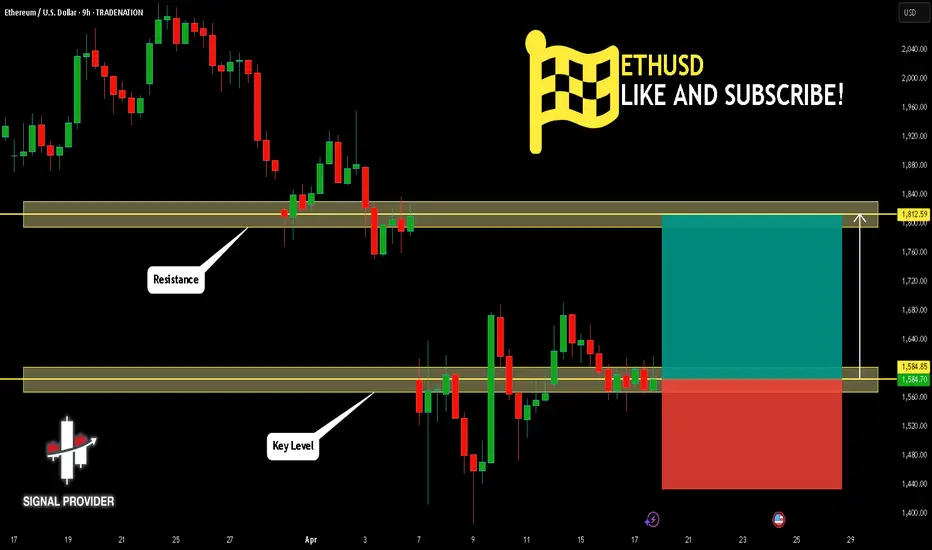
ETHUSD Will Go Higher! Buy!
Take a look at our analysis for ETHUSD.
Time Frame: 9h
Current Trend: Bullish
Sentiment: Oversold (based on 7-period RSI)
Forecast: Bullish
The market is testing a major horizontal structure 1,584.85.
Taking into consideration the structure & trend analysis, I believe that the market will reach 1,812.59 level soon.
P.S
The term oversold refers to a condition where an asset has traded lower in price and has the potential for a price bounce.
Overbought refers to market scenarios where the instrument is traded considerably higher than its fair value. Overvaluation is caused by market sentiments when there is positive news.
Disclosure: I am part of Trade Nation's Influencer program and receive a monthly fee for using their TradingView charts in my analysis.
Like and subscribe and comment my ideas if you enjoy them!
BITCOIN BEARS ARE STRONG HERE|SHORT
BITCOIN SIGNAL
Trade Direction: short
Entry Level: 95,374.46
Target Level: 87,760.19
Stop Loss: 100,463.39
RISK PROFILE
Risk level: medium
Suggested risk: 1%
Timeframe: 9h
Disclosure: I am part of Trade Nation's Influencer program and receive a monthly fee for using their TradingView charts in my analysis.
✅LIKE AND COMMENT MY IDEAS✅

S&P 500 Daily Chart Analysis For Week of April 25, 2025Technical Analysis and Outlook:
In this week's trading session, the Index did steady to higher prices, distancing itself from the rendered obsolete Mean Resistance level of 5455 and targeting the next significant mark identified as Outer Index Rally 5550. This trend lays the groundwork for a continued upward movement; however, there is also a considerable risk of a sharp pullback to the Mean Support level of 5370 after reaching the Outer Index Rally at 5550.
Contrariwise, it is essential to acknowledge the possibility of upward momentum continuation resulting in meeting the primary target Outer Index Rally 5550 by challenging the Mean Resistance of 5672 and extending toward additional levels: Mean Resistance 5778 and Outer Index Rally 5945.

NZD/CHF SHORT FROM RESISTANCE
Hello, Friends!
NZD/CHF pair is in the downtrend because previous week’s candle is red, while the price is clearly rising on the 9H timeframe. And after the retest of the resistance line above I believe we will see a move down towards the target below at 0.475 because the pair is overbought due to its proximity to the upper BB band and a bearish correction is likely.
Disclosure: I am part of Trade Nation's Influencer program and receive a monthly fee for using their TradingView charts in my analysis.
✅LIKE AND COMMENT MY IDEAS✅

AUD/NZD BEARS WILL DOMINATE THE MARKET|SHORT
Hello, Friends!
AUD/NZD pair is trading in a local downtrend which know by looking at the previous 1W candle which is red. On the 1H timeframe the pair is going up. The pair is overbought because the price is close to the upper band of the BB indicator. So we are looking to sell the pair with the upper BB line acting as resistance. The next target is 1.070 area.
Disclosure: I am part of Trade Nation's Influencer program and receive a monthly fee for using their TradingView charts in my analysis.
✅LIKE AND COMMENT MY IDEAS✅

EUR/USD Daily Chart Analysis For Week of April 25, 2025Technical Analysis and Outlook:
In the most recent trading session, the Euro successfully retested the completed Outer Currency Rally level at 1.142 and completed the subsequent target identified within the Outer Currency Rally at 1.157. Consequently, the Euro experienced a firm decline to the Mean Support level of 1.131. However, it is essential to recognize that upward momentum may re-emerge, facilitating a retest of the Key Resistance level at 1.151 or potentially leading to a further decline toward the next support level designated as Mean Support at 1.119.

Bitcoin(BTC/USD) Daily Chart Analysis For Week of April 25, 2025Technical Analysis and Outlook:
Bitcoin experienced a significant rally in this week's trading session, breaking through all identified Mean Resistance levels: 86400, 90600, and 94500. This breakout led to the completion of the Interim Coin Rally at 88400. As a result, the newest identified Interim Coin Rally at 95000 has also been completed, indicating a possible pullback to the Mean Support at 92000 and a further decline potential toward an additional Mean Support target at 88500. However, it's important to recognize the chance of upward momentum emerging from a retest of the completed Interim Coin Rally at 95000, which could advance toward the next Interim Coin Rally at 100000.

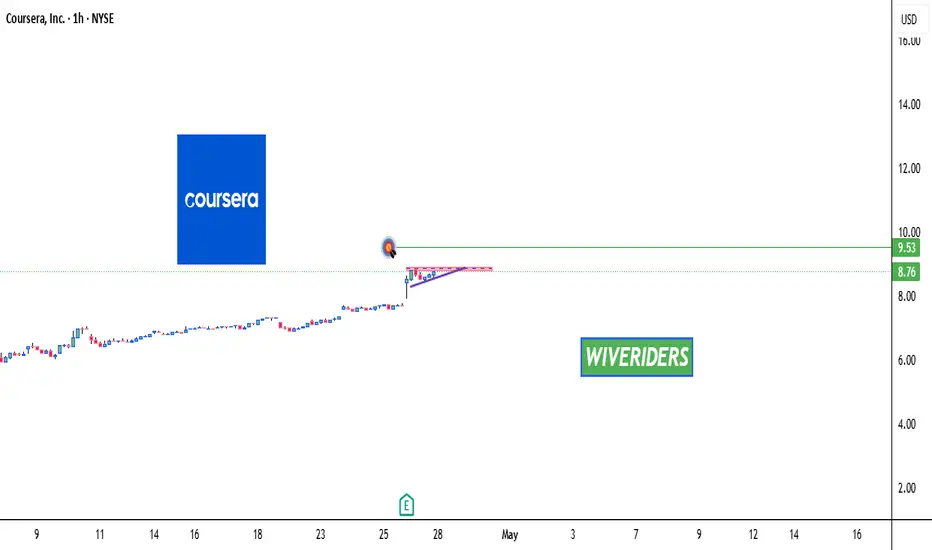
COURSERA Forming Bullish Continuation Patterns 🚨 $COURSERA Forming Bullish Continuation Patterns 🚨
$COURSERA is forming bullish continuation patterns and is approaching a key red resistance zone. A breakout above this level could signal a strong bullish move, with the first target at the green line level.
📈 Technical Overview:
Pattern: Bullish Continuation
Resistance Zone: Red area currently being tested.
🎯 Breakout Target: Green line level upon confirmation.
Godshield Icon Entries on Gold market Hey fam, someone’s asking if I’m going short on the gold market right now or waiting for confirmation at $3,300, and I’m here to spill the tea on my XAU/USD M30 strategy. I’ve been hunting gold all week, balancing my trades with my passions like curating scents at Icon Collections Store, and I’m ready to dive into this setup. Let’s break it down with my checklist, share my thoughts, and make this interactive—grab a smoothie from Tastequest.com and let’s talk!

NZD_CHF MOVE DOWN AHEAD|SHORT|
✅NZD_CHF is set to retest a
Strong resistance level above of 0.5000
After trading in a local uptrend for some time
Which makes a bearish pullback a likely scenario
With the target being a local support below at 0.4892
SHORT🔥
✅Like and subscribe to never miss a new idea!✅
Disclosure: I am part of Trade Nation's Influencer program and receive a monthly fee for using their TradingView charts in my analysis.

GBP_JPY BEARISH BIAS|SHORT|
✅GBP_JPY has been growing recently
And the pair seems locally overbought
So as the pair is approaching a horizontal resistance of
Price decline is to be expected
SHORT🔥
✅Like and subscribe to never miss a new idea!✅
Disclosure: I am part of Trade Nation's Influencer program and receive a monthly fee for using their TradingView charts in my analysis.

GBP-CHF Will Go Down! Sell!
Hello,Traders!
GBP-CHF is moving upwards
Towards the horizontal resistance
Above around 1.1125 and as the
Pair is overbought we will be
Expecting a local pullback and
A bearish correction
Sell!
Comment and subscribe to help us grow!
Check out other forecasts below too!
Disclosure: I am part of Trade Nation's Influencer program and receive a monthly fee for using their TradingView charts in my analysis.

EURUSD Buyers In Panic! SELL!
My dear friends,
Please, find my technical outlook for EURUSD below:
The price is coiling around a solid key level - 1.1506
Bias - Bearish
Technical Indicators: Pivot Points High anticipates a potential price reversal.
Super trend shows a clear sell, giving a perfect indicators' convergence.
Goal - 1.1409
About Used Indicators:
The pivot point itself is simply the average of the high, low and closing prices from the previous trading day.
———————————
WISH YOU ALL LUCK

GOLD My Opinion! SELL!
My dear friends,
GOLD looks like it will make a good move, and here are the details:
The market is trading on 3339.9 pivot level.
Bias - Bearish
Technical Indicators: Supper Trend generates a clear short signal while Pivot Point HL is currently determining the overall Bearish trend of the market.
Goal - 3323.8
Recommended Stop Loss - 3347.3
About Used Indicators:
Pivot points are a great way to identify areas of support and resistance, but they work best when combined with other kinds of technical analysis
Disclosure: I am part of Trade Nation's Influencer program and receive a monthly fee for using their TradingView charts in my analysis.
———————————
WISH YOU ALL LUCK

NZDCAD Trading Opportunity! SELL!
My dear followers,
This is my opinion on the NZDCAD next move:
The asset is approaching an important pivot point 0.8279
Bias - Bearish
Technical Indicators: Supper Trend generates a clear short signal while Pivot Point HL is currently determining the overall Bearish trend of the market.
Goal - 0.8264
About Used Indicators:
For more efficient signals, super-trend is used in combination with other indicators like Pivot Points.
Disclosure: I am part of Trade Nation's Influencer program and receive a monthly fee for using their TradingView charts in my analysis.
———————————
WISH YOU ALL LUCK

EUR_JPY RESISTANCE AHEAD|SHORT|
✅EUR_JPY is going up now
But a strong resistance level is ahead at 164.870
Thus I am expecting a pullback
And a move down towards the target of 163.000
SHORT🔥
✅Like and subscribe to never miss a new idea!✅
Disclosure: I am part of Trade Nation's Influencer program and receive a monthly fee for using their TradingView charts in my analysis.
