S&P 500 Daily Chart Analysis For Week of April 25, 2025Technical Analysis and Outlook:
In this week's trading session, the Index did steady to higher prices, distancing itself from the rendered obsolete Mean Resistance level of 5455 and targeting the next significant mark identified as Outer Index Rally 5550. This trend lays the groundwork for a continued upward movement; however, there is also a considerable risk of a sharp pullback to the Mean Support level of 5370 after reaching the Outer Index Rally at 5550.
Contrariwise, it is essential to acknowledge the possibility of upward momentum continuation resulting in meeting the primary target Outer Index Rally 5550 by challenging the Mean Resistance of 5672 and extending toward additional levels: Mean Resistance 5778 and Outer Index Rally 5945.
Trading

NZD/CHF SHORT FROM RESISTANCE
Hello, Friends!
NZD/CHF pair is in the downtrend because previous week’s candle is red, while the price is clearly rising on the 9H timeframe. And after the retest of the resistance line above I believe we will see a move down towards the target below at 0.475 because the pair is overbought due to its proximity to the upper BB band and a bearish correction is likely.
Disclosure: I am part of Trade Nation's Influencer program and receive a monthly fee for using their TradingView charts in my analysis.
✅LIKE AND COMMENT MY IDEAS✅

AUD/NZD BEARS WILL DOMINATE THE MARKET|SHORT
Hello, Friends!
AUD/NZD pair is trading in a local downtrend which know by looking at the previous 1W candle which is red. On the 1H timeframe the pair is going up. The pair is overbought because the price is close to the upper band of the BB indicator. So we are looking to sell the pair with the upper BB line acting as resistance. The next target is 1.070 area.
Disclosure: I am part of Trade Nation's Influencer program and receive a monthly fee for using their TradingView charts in my analysis.
✅LIKE AND COMMENT MY IDEAS✅

EUR/USD Daily Chart Analysis For Week of April 25, 2025Technical Analysis and Outlook:
In the most recent trading session, the Euro successfully retested the completed Outer Currency Rally level at 1.142 and completed the subsequent target identified within the Outer Currency Rally at 1.157. Consequently, the Euro experienced a firm decline to the Mean Support level of 1.131. However, it is essential to recognize that upward momentum may re-emerge, facilitating a retest of the Key Resistance level at 1.151 or potentially leading to a further decline toward the next support level designated as Mean Support at 1.119.

Bitcoin(BTC/USD) Daily Chart Analysis For Week of April 25, 2025Technical Analysis and Outlook:
Bitcoin experienced a significant rally in this week's trading session, breaking through all identified Mean Resistance levels: 86400, 90600, and 94500. This breakout led to the completion of the Interim Coin Rally at 88400. As a result, the newest identified Interim Coin Rally at 95000 has also been completed, indicating a possible pullback to the Mean Support at 92000 and a further decline potential toward an additional Mean Support target at 88500. However, it's important to recognize the chance of upward momentum emerging from a retest of the completed Interim Coin Rally at 95000, which could advance toward the next Interim Coin Rally at 100000.

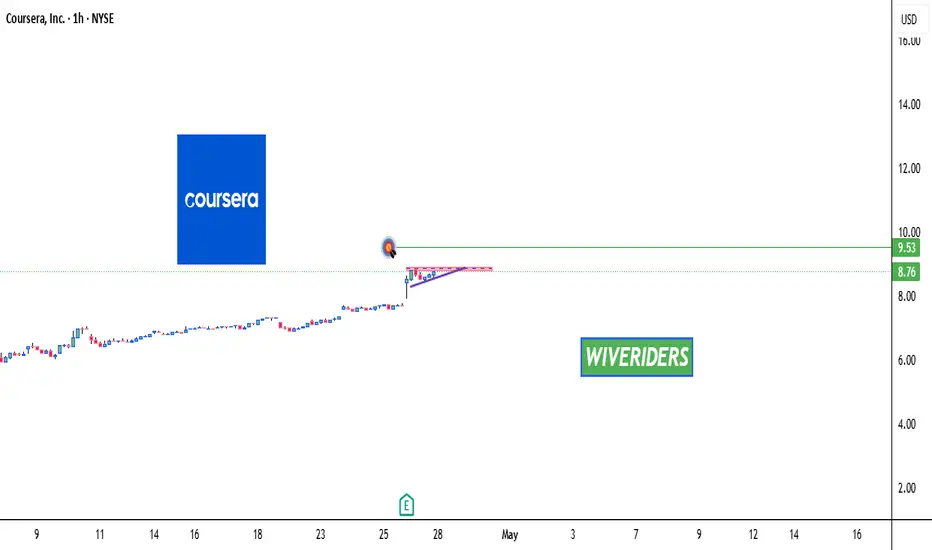
COURSERA Forming Bullish Continuation Patterns 🚨 $COURSERA Forming Bullish Continuation Patterns 🚨
$COURSERA is forming bullish continuation patterns and is approaching a key red resistance zone. A breakout above this level could signal a strong bullish move, with the first target at the green line level.
📈 Technical Overview:
Pattern: Bullish Continuation
Resistance Zone: Red area currently being tested.
🎯 Breakout Target: Green line level upon confirmation.
Godshield Icon Entries on Gold market Hey fam, someone’s asking if I’m going short on the gold market right now or waiting for confirmation at $3,300, and I’m here to spill the tea on my XAU/USD M30 strategy. I’ve been hunting gold all week, balancing my trades with my passions like curating scents at Icon Collections Store, and I’m ready to dive into this setup. Let’s break it down with my checklist, share my thoughts, and make this interactive—grab a smoothie from Tastequest.com and let’s talk!

NZD_CHF MOVE DOWN AHEAD|SHORT|
✅NZD_CHF is set to retest a
Strong resistance level above of 0.5000
After trading in a local uptrend for some time
Which makes a bearish pullback a likely scenario
With the target being a local support below at 0.4892
SHORT🔥
✅Like and subscribe to never miss a new idea!✅
Disclosure: I am part of Trade Nation's Influencer program and receive a monthly fee for using their TradingView charts in my analysis.

GBP_JPY BEARISH BIAS|SHORT|
✅GBP_JPY has been growing recently
And the pair seems locally overbought
So as the pair is approaching a horizontal resistance of
Price decline is to be expected
SHORT🔥
✅Like and subscribe to never miss a new idea!✅
Disclosure: I am part of Trade Nation's Influencer program and receive a monthly fee for using their TradingView charts in my analysis.

GBP-CHF Will Go Down! Sell!
Hello,Traders!
GBP-CHF is moving upwards
Towards the horizontal resistance
Above around 1.1125 and as the
Pair is overbought we will be
Expecting a local pullback and
A bearish correction
Sell!
Comment and subscribe to help us grow!
Check out other forecasts below too!
Disclosure: I am part of Trade Nation's Influencer program and receive a monthly fee for using their TradingView charts in my analysis.

EURUSD Buyers In Panic! SELL!
My dear friends,
Please, find my technical outlook for EURUSD below:
The price is coiling around a solid key level - 1.1506
Bias - Bearish
Technical Indicators: Pivot Points High anticipates a potential price reversal.
Super trend shows a clear sell, giving a perfect indicators' convergence.
Goal - 1.1409
About Used Indicators:
The pivot point itself is simply the average of the high, low and closing prices from the previous trading day.
———————————
WISH YOU ALL LUCK

GOLD My Opinion! SELL!
My dear friends,
GOLD looks like it will make a good move, and here are the details:
The market is trading on 3339.9 pivot level.
Bias - Bearish
Technical Indicators: Supper Trend generates a clear short signal while Pivot Point HL is currently determining the overall Bearish trend of the market.
Goal - 3323.8
Recommended Stop Loss - 3347.3
About Used Indicators:
Pivot points are a great way to identify areas of support and resistance, but they work best when combined with other kinds of technical analysis
Disclosure: I am part of Trade Nation's Influencer program and receive a monthly fee for using their TradingView charts in my analysis.
———————————
WISH YOU ALL LUCK

NZDCAD Trading Opportunity! SELL!
My dear followers,
This is my opinion on the NZDCAD next move:
The asset is approaching an important pivot point 0.8279
Bias - Bearish
Technical Indicators: Supper Trend generates a clear short signal while Pivot Point HL is currently determining the overall Bearish trend of the market.
Goal - 0.8264
About Used Indicators:
For more efficient signals, super-trend is used in combination with other indicators like Pivot Points.
Disclosure: I am part of Trade Nation's Influencer program and receive a monthly fee for using their TradingView charts in my analysis.
———————————
WISH YOU ALL LUCK

EUR_JPY RESISTANCE AHEAD|SHORT|
✅EUR_JPY is going up now
But a strong resistance level is ahead at 164.870
Thus I am expecting a pullback
And a move down towards the target of 163.000
SHORT🔥
✅Like and subscribe to never miss a new idea!✅
Disclosure: I am part of Trade Nation's Influencer program and receive a monthly fee for using their TradingView charts in my analysis.

USD-CHF Correction Ahead! Sell!
Hello,Traders!
USD-CHF is growing but
Will soon hit a horizontal
Resistance of 0.8383
From where we will be
Expecting a local
Bearish pullback
Sell!
Comment and subscribe to help us grow!
Check out other forecasts below too!
Disclosure: I am part of Trade Nation's Influencer program and receive a monthly fee for using their TradingView charts in my analysis.

EURJPY Under Pressure! SELL!
My dear subscribers,
My technical analysis for EURJPY is below:
The price is coiling around a solid key level - 163.61
Bias - Bearish
Technical Indicators: Pivot Points Low anticipates a potential price reversal.
Super trend shows a clear sell, giving a perfect indicators' convergence.
Goal - 162.39
My Stop Loss - 164.06
About Used Indicators:
By the very nature of the supertrend indicator, it offers firm support and resistance levels for traders to enter and exit trades. Additionally, it also provides signals for setting stop losses
Disclosure: I am part of Trade Nation's Influencer program and receive a monthly fee for using their TradingView charts in my analysis.
———————————
WISH YOU ALL LUCK

EURUSD Set To Grow! BUY!
My dear friends,
My technical analysis for EURUSD is below:
The market is trading on 1.1361 pivot level.
Bias - Bullish
Technical Indicators: Both Super Trend & Pivot HL indicate a highly probable Bullish continuation.
Target - 1.1407
About Used Indicators:
A pivot point is a technical analysis indicator, or calculations, used to determine the overall trend of the market over different time frames.
Disclosure: I am part of Trade Nation's Influencer program and receive a monthly fee for using their TradingView charts in my analysis.
———————————
WISH YOU ALL LUCK

Geld Vision Investing with values — how ESG is changing More and more people today not only want to earn money, but also want to know where their money is going and what impact it is having . They want to invest in projects that are not only profitable, but also responsible and sustainable. This is precisely where the ESG investing approach comes into play—a concept in which returns and responsibility go hand in hand.
We explain in a simple and understandable way what ESG means, how it works and why this approach will become increasingly important in 2025.
What does ESG mean?
ESG stands for three central principles:
E — Environmental: Climate protection, CO₂ emissions, resource conservation, waste prevention
S — Social: fair working conditions, human rights, diversity and inclusion
G — Governance: Transparency, anti-corruption, ethical leadership
Companies with high ESG ratings try to act responsibly towards people, the environment and society.
Why invest in ESG?
ESG investing combines ethical values with economic rationality. The benefits are obvious:
Fewer risks. Companies with clear ESG policies are less likely to experience scandals or legal problems.
Long-term stability. Sustainable companies are more resilient to crises and more future-oriented.
Good reputation. Companies with strong values gain trust from customers and partners.
Political support. More and more countries are promoting sustainable economic activity.
The platform allows users to specifically search for ESG-compliant companies and funds and track their development.
ESG and returns – contradiction or win-win?
A common misconception: Companies that operate sustainably earn less. In fact, the opposite is often true.
Numerous studies show that ESG companies perform better in the long term because they:
be managed more efficiently,
respond better to crises,
Attract investors and talent more strongly,
be on the safe side from a regulatory perspective.
Sustainability and profit are not mutually exclusive – they complement each other.
How do I get started with ESG investing?
Clarify your own values. What's important to you? The environment, fair working conditions, equality?
Analyze companies. Many companies publish ESG reports that provide information about their goals and progress.
ESG funds are reviewed. These funds pool audited companies with good ESG ratings.
Review performance regularly. ESG is not a fad, but a long-term approach with measurable results.
GeldVision offers tools that allow you to filter, analyze, and incorporate ESG data into your investment strategy.
In which industries does ESG play a major role?
Renewable energies — solar, wind, hydrogen
Sustainable consumption — environmentally friendly packaging, recycling
Technology and digitalization — inclusive and ethically managed companies
Education and health — socially relevant sectors with great impact
FinTech — Platforms that make investing more transparent and fairer
The ESG approach can be applied across industries—it is not a trend, but a new way of thinking.
Who relies on ESG?
Young investors. Generation Z and Millennials value values.
Large investment funds. ESG is an integral part of their strategy.
Private investors. People who want to make a positive impact with their money.
So ESG is no longer just for idealists — it has become mainstream .
What does Money Vision offer?
The platform helps users invest with a clear conscience. It offers:
Access to ESG rankings and sustainability data
Filters for targeted investment decisions
Market analyses on green and social trends
Support in building a balanced portfolio
Whether you’re a beginner or a professional, Geld Vision makes sustainable investing easier and more transparent.
ESG investing is more than just a trend. It's a new, future-oriented perspective on money, markets, and responsibility.
You can invest today without betraying your values —and still achieve attractive returns. With the right knowledge, the right tools, and platforms like Geld Vision, sustainable investing becomes a true success model.
Because investing responsibly means making profits while contributing to a better world.

DXY: Next Move Is Down! Short!
My dear friends,
Today we will analyse DXY together☺️
The price is near a wide key level
and the pair is approaching a significant decision level of 99.185 Therefore, a strong bearish reaction here could determine the next move down.We will watch for a confirmation candle, and then target the next key level of 99.910..Recommend Stop-loss is beyond the current level.
❤️Sending you lots of Love and Hugs❤️

Gold Retreats After Trump Confirms China Talks 📌 Gold Retreats After Trump Confirms China Talks – Political Noise Drives Volatility 🧨📉
Gold (XAU/USD) saw a sharp intraday drop following comments from President Trump, who confirmed that trade talks with China are “ongoing” — despite China denying any official negotiations had taken place. The market interpreted this as a signal of de-escalation, prompting a short-term price correction.
Gold had previously rallied past $3,500/oz, supported by a weaker USD and strong demand from bargain hunters after last week’s sharp decline. However, the current political contradictions and tariff headlines are creating erratic moves across all asset classes.
🌍 Fundamental Context
The USD weakened, stocks lost momentum, and risk sentiment shifted after a confusing round of statements from the US and China.
Meanwhile, US jobless claims rose slightly, reflecting a resilient labour market amid tariff-related headwinds.
Today’s Core Retail Sales data in the US could add more volatility heading into the weekly candle close.
It’s Friday — expect possible liquidity sweeps and aggressive price spikes as the market prepares for weekend risk-off moves.
📊 Trading Outlook – 26 April
We're seeing signs of a tactical pullback, but long setups should be delayed until political headlines stabilise. Focus on intraday reaction zones — not aggressive positioning.
🔻 SELL ZONES
3384 – 3386
• SL: 3390
• TP: 3380 → 3376 → 3372 → 3368 → 3364 → 3360 → ???
3406 – 3408
• SL: 3412
• TP: 3400 → 3396 → 3392 → 3388 → 3384 → 3380 → 3370 → 3360
🟢 BUY ZONES
3288 – 3286
• SL: 3282
• TP: 3292 → 3296 → 3300 → 3304 → 3310
3270 – 3268
• SL: 3264
• TP: 3274 → 3278 → 3282 → 3286 → 3290
🛡️ Final Notes & Strategy
Avoid rushing BUY entries — allow Price to complete its corrective phase and wait for structure and confirmation.
Today’s Core Retail Sales (US) could trigger a fresh wave of volatility.
It’s also weekly close Friday, so prepare for potential false breaks and stop hunts.
✅ Stick to your TP/SL. Protect your capital first — clarity will come when the dust settles.
💬 Are you watching for a short-term bounce or planning to fade strength near resistance? Let us know in the comments below! 👇👇👇

EURUSD: Target Is Up! Long!
My dear friends,
Today we will analyse EURUSD together☺️
The recent price action suggests a shift in mid-term momentum. A break above the current local range around 1.13622 will confirm the new direction upwards with the target being the next key level of 1.13967 and a reconvened placement of a stop-loss beyond the range.
❤️Sending you lots of Love and Hugs❤️

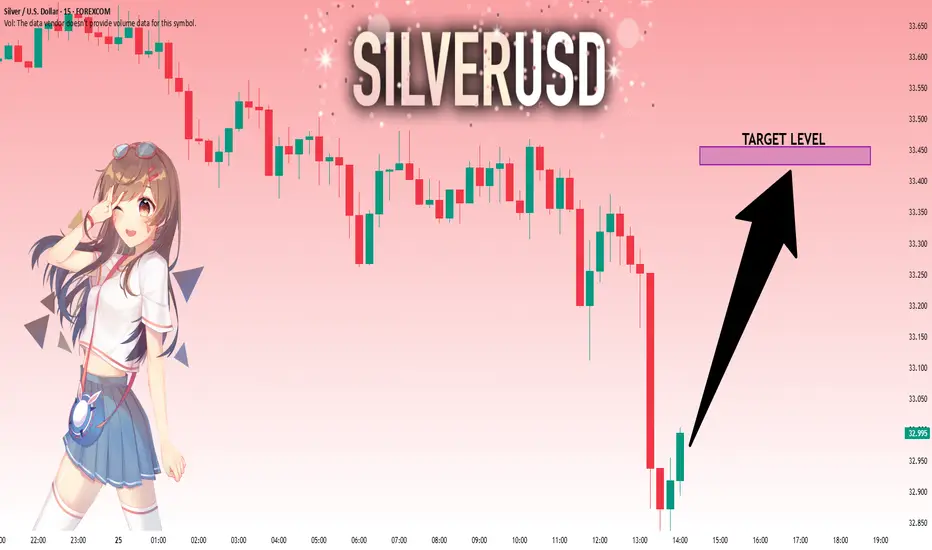
SILVER: Move Up Expected! Long!
My dear friends,
Today we will analyse SILVER together☺️
The in-trend continuation seems likely as the current long-term trend appears to be strong, and price is holding below a key level of 32.982 So a bearish continuation seems plausible, targeting the next low. We should enter on confirmation, and place a stop-loss beyond the recent swing level.
❤️Sending you lots of Love and Hugs❤️
GOLD: Strong Bearish Sentiment! Short!
My dear friends,
Today we will analyse GOLD together☺️
The market is at an inflection zone and price has now reached an area around 3,270.77 where previous reversals or breakouts have occurred.And a price reaction that we are seeing on multiple timeframes here could signal the next move down so we can enter on confirmation, and target the next key level of 3,242.15..Stop-loss is recommended beyond the inflection zone.
❤️Sending you lots of Love and Hugs❤️
