FinVolution Group (FINV) - A Quiet Giant on the Edge of Breakout⚡ FinVolution Group (FINV) — A Quiet Giant on the Edge of Breakout
While everyone is chasing the inflated Big Tech bubble, a much quieter — and potentially far more explosive — opportunity is forming right now in the fintech and online lending space.
That opportunity is FinVolution Group (FINV) — a Chinese and Southeast Asian fintech player that looks ready to break through its 2021 highs. Once that breakout happens, the move could be massive.
🔸 Fundamentals
FinVolution has quietly turned a corner.
Recent quarters have been consistently profitable — both revenue and EPS are growing.
The most striking part?
The forward P/E ratio is just 0.7 — yes, less than one.
That’s an extraordinary valuation for a profitable fintech with expanding operations across multiple Asian markets.
It’s a risky play, no doubt, but these are exactly the kind of setups that tend to drive portfolio growth over time: low valuation, improving financials, and clear technical breakout potential.
🔸 Technical Picture
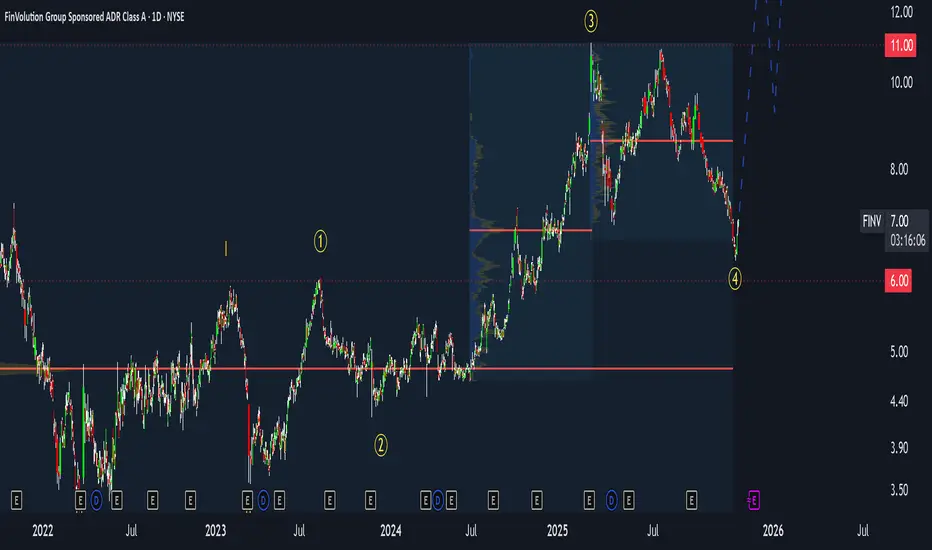
From a technical perspective, FINV is at the start of what looks like the third major wave of its long-term structure.
Since 2021, the price has been consolidating sideways — but that phase seems to be ending now.
Key resistance: $11
Current price: around $7
Breakout level: above $11 (with volume confirmation)
First targets: $20 → $30 → $40
If the price breaks below $6, the bullish scenario pauses — it doesn’t collapse, but likely extends the sideways phase.
That sets up a risk of roughly 10–15%, while the potential upside remains multiple times higher.
The risk/reward profile here is exceptionally strong.
🔸 My Strategy
I’m already positioned - entered near $7, with a stop-loss around $6.
Once we approach $11, I plan to take partial profits and watch for a breakout confirmation.
If we get a strong breakout above $11 with solid volume, that’s my next entry trigger.
Then I’ll look to add on pullbacks, applying my call stacking strategy - building exposure gradually as the trend confirms and accelerates.
🚀 Summary
FinVolution (FINV) shows a rare combination:
✅ Profitable growth
✅ Deep undervaluation
✅ Strong breakout setup
It’s one of those asymmetric opportunities — where the downside is limited, but the upside could multiply several times over.
If the $11 breakout confirms, this could easily become one of the most powerful fintech moves of the next few quarters.
⚡ Call to Action
If you like this type of setup - low-risk, high-upside plays - tap 🚀 to support the idea,
and drop a comment with tickers you’d like me to review next.
(Full technical breakdown and strategy details are discussed in my latest videos — available via my profile.)
Trading
DXY RISING TRENDLINE BELOW|LONG|
✅DXY Price is respecting the rising trendline, showing consistent higher lows. Expect bullish continuation toward the target zone after the retest, as price seeks to rebalance inefficiency left from prior impulsive moves. Time Frame 7H.
LONG🚀
✅Like and subscribe to never miss a new idea!✅

CHF-JPY Will Keep Growing! Buy!
Hello,Traders!
CHFJPY retraced into a horizontal demand area after a clear bullish leg. SMC structure suggests continuation toward the supply area as liquidity above equal highs gets targeted. Time Frame 4H.
Buy!
Comment and subscribe to help us grow!
Check out other forecasts below too!
Disclosure: I am part of Trade Nation's Influencer program and receive a monthly fee for using their TradingView charts in my analysis.

USDCAD FREE SIGNAL|LONG|
✅USDCAD after tapping into the refined 4H demand level, price shows a bullish rejection candle, suggesting a potential long setup targeting the next short-term high. Smart money likely accumulating below liquidity pools.
—————————
Entry: 1.3944
Stop Loss: 1.3931
Take Profit: 1.3958
Time Frame: 4H
Setup Risk: High
—————————
LONG🚀
✅Like and subscribe to never miss a new idea!✅

EUR-USD Clear Rejection! Buy!
Hello, Traders!
EURUSD After a deep rejection from the horizontal demand area, price shows bullish intent with a clean break of short-term structure. Expect continuation toward the target zone. Time Frame 4H.
Buy!
Comment and subscribe to help us grow!
Check out other forecasts below too!
Disclosure: I am part of Trade Nation's Influencer program and receive a monthly fee for using their TradingView charts in my analysis.

AUDNZD Technical Analysis! SELL!
My dear friends,
Please, find my technical outlook for AUDNZD below:
The price is coiling around a solid key level - 1.1374
Bias - Bearish
Technical Indicators: Pivot Points Low anticipates a potential price reversal.
Super trend shows a clear sell, giving a perfect indicators' convergence.
Goal - 1.1347
About Used Indicators:
The pivot point itself is simply the average of the high, low and closing prices from the previous trading day.
Disclosure: I am part of Trade Nation's Influencer program and receive a monthly fee for using their TradingView charts in my analysis.
———————————
WISH YOU ALL LUCK

CADCHF A Fall Expected! SELL!
My dear followers,
I analysed this chart on CADCHFand concluded the following:
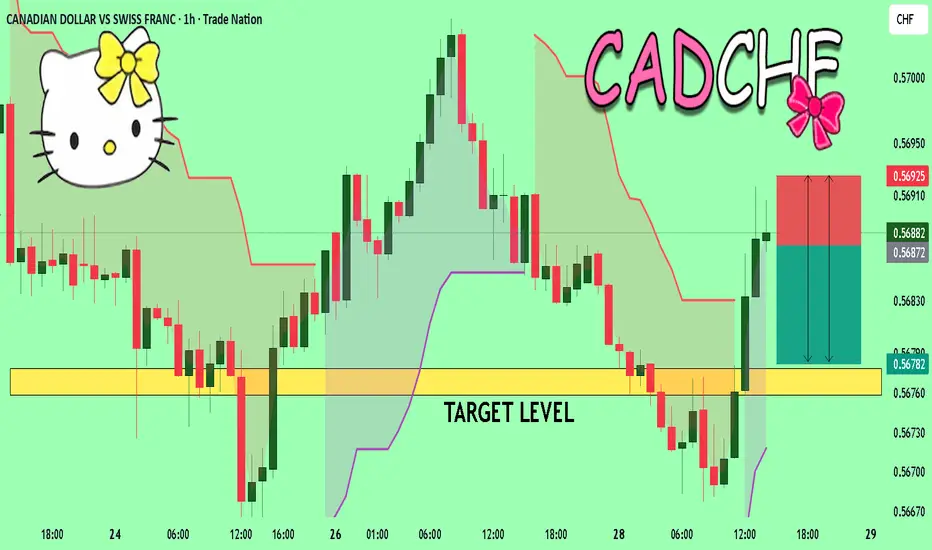
The market is trading on 0.5687 pivot level.
Bias - Bearish
Technical Indicators: Both Super Trend & Pivot HL indicate a highly probable Bearish continuation.
Target -0.5677
Safe Stop Loss - 0.5692
About Used Indicators:
A super-trend indicator is plotted on either above or below the closing price to signal a buy or sell. The indicator changes color, based on whether or not you should be buying. If the super-trend indicator moves below the closing price, the indicator turns green, and it signals an entry point or points to buy.
Disclosure: I am part of Trade Nation's Influencer program and receive a monthly fee for using their TradingView charts in my analysis.
———————————
WISH YOU ALL LUCK
COINBASE (COIN) – Watching for Pullback Entry Around $343Coinbase NASDAQ:COIN has surged nearly +20% since our previous update, powered by strength in the broader crypto sector. With price action now extended, we’re watching for a pullback opportunity around the $343 area — a previous zone of interest where buyers may step back in.
💡 Trade Setup:
Entry Zone: $343 (on pullback confirmation)
Take Profit Targets:
TP1: $360–$390
TP2: $415–$440
Stop Loss: $303 (below key support)

5 Truths That Took Me 2 Years to Accept and 5 to UnderstandTrading isn’t something you “get” in a few weeks.
You might catch a lucky streak early on and feel like that Lambo is just a few months away; but that illusion fades fast.
The truth is, trading is a rollercoaster. Especially in the early stages, when emotions, variance, and lack of structure hit all at once.
Even for those few who survive beyond the average life span of a retail trader (which is painfully short), it takes years for the craft to settle into something resembling steady, reliable income.
Over time, traders collect scars and lessons that only experience can teach.
Here are five of the most important ones I’ve learned after more than two decades in this game.
They may sound simple or vague now, but trust me, if you stick around long enough, one day you’ll read them and nod quietly, realizing they’ve all become true.
1️⃣ Technical Analysis isn’t linear, perfect, or enough.
Patterns evolve, markets change, and setups fail.
I’m sure you’ve experienced it, that “perfect trade” that still turned into a loss.
That’s why TA should be treated as a lens, not a compass.
Relying 100% on technical analysis is too basic; if you want to succeed, you need something deeper: context, probability, and process.
2️⃣ I’m never right or wrong.
A loss doesn’t mean you were wrong, it’s just risk doing its job. In technical terms, it’s variance at work.
The only real mistake is confusing randomness with failure.
3️⃣ Consistency always beats prediction.
The future is uncertain.Trying to predict the next tick, the next day, or the next week is futile.
Once you understand that your system lives inside uncertainty, everything changes.
Discipline compounds, prediction doesn’t.
Stop treating trading as a guessing game and start treating it as a process.
4️⃣ Emotions are a sign you’ve misunderstood your system.
If you find yourself reacting to your last win or loss, it’s a sign you don’t truly understand how trading works.
Each trade is just one data point in the variance of your system.
When you start to see it that way, emotions disappear and clarity takes over.
5️⃣ Chasing outsized returns produces outsized losses.
Every shortcut in trading is just a longer route to pain.
Your system has an expected future value: it fluctuates in the short run, but it’s stable in the long term.
When you try to force profits or speed up growth, what you’re really doing is increasing risk to a level that can destroy you.
Remember: it’s not about getting rich fast; it’s about staying solvent long enough for your edge to compound.
🧠 Trading isn’t about being smart, reading charts well, or even being right; it’s about being disciplined, logical, and consistent.
Each of these lessons was learned through years of mistakes, setbacks, and reflection.
They might sound vague, simple, or even wrong today, but trust me, when you reach your tenth year in trading, you’ll see every one of these truths play out in real life.
If you’d like me to expand on any of them, drop a comment below, I’d love to dive deeper.

SILVER Will Go Lower From Resistance! Sell!
Please, check our technical outlook for SILVER.
Time Frame: 15m
Current Trend: Bearish
Sentiment: Overbought (based on 7-period RSI)
Forecast: Bearish
The market is approaching a significant resistance area 4,652.6.
Due to the fact that we see a positive bearish reaction from the underlined area, I strongly believe that sellers will manage to push the price all the way down to 4,606.3 level.
P.S
Please, note that an oversold/overbought condition can last for a long time, and therefore being oversold/overbought doesn't mean a price rally will come soon, or at all.
Like and subscribe and comment my ideas if you enjoy them!

EURUSD Will Go Up From Support! Buy!
Here is our detailed technical review for EURUSD.
Time Frame: 12h
Current Trend: Bullish
Sentiment: Oversold (based on 7-period RSI)
Forecast: Bullish
The market is on a crucial zone of demand 1.165.
The oversold market condition in a combination with key structure gives us a relatively strong bullish signal with goal 1.175 level.
P.S
The term oversold refers to a condition where an asset has traded lower in price and has the potential for a price bounce.
Overbought refers to market scenarios where the instrument is traded considerably higher than its fair value. Overvaluation is caused by market sentiments when there is positive news.
Like and subscribe and comment my ideas if you enjoy them!

EURUSD Is Very Bullish! Buy!
Take a look at our analysis for EURUSD.
Time Frame: 2h
Current Trend: Bullish
Sentiment: Oversold (based on 7-period RSI)
Forecast: Bullish
The price is testing a key support 1.161.
Current market trend & oversold RSI makes me think that buyers will push the price. I will anticipate a bullish movement at least to 1.164 level.
P.S
We determine oversold/overbought condition with RSI indicator.
When it drops below 30 - the market is considered to be oversold.
When it bounces above 70 - the market is considered to be overbought.
Like and subscribe and comment my ideas if you enjoy them!

SILVER LONG FROM SUPPORT
SILVER SIGNAL
Trade Direction: long
Entry Level: 4,629.4
Target Level: 4,962.5
Stop Loss: 4,404.9
RISK PROFILE
Risk level: medium
Suggested risk: 1%
Timeframe: 3h
Disclosure: I am part of Trade Nation's Influencer program and receive a monthly fee for using their TradingView charts in my analysis.
✅LIKE AND COMMENT MY IDEAS✅

AUD/JPY SENDS CLEAR BEARISH SIGNALS|SHORT
Hello, Friends!
AUD/JPY pair is trading in a local uptrend which we know by looking at the previous 1W candle which is green. On the 1D timeframe the pair is going up too. The pair is overbought because the price is close to the upper band of the BB indicator. So we are looking to sell the pair with the upper BB line acting as resistance. The next target is 98.106 area.
Disclosure: I am part of Trade Nation's Influencer program and receive a monthly fee for using their TradingView charts in my analysis.
✅LIKE AND COMMENT MY IDEAS✅

GBP/JPY BEARS ARE GAINING STRENGTH|SHORT
Hello, Friends!
We are going short on the GBP/JPY with the target of 197.417 level, because the pair is overbought and will soon hit the resistance line above. We deduced the overbought condition from the price being near to the upper BB band. However, we should use low risk here because the 1W TF is green and gives us a counter-signal.
Disclosure: I am part of Trade Nation's Influencer program and receive a monthly fee for using their TradingView charts in my analysis.
✅LIKE AND COMMENT MY IDEAS✅

GBP/CHF BEARS ARE STRONG HERE|SHORT
Hello, Friends!
It makes sense for us to go short on GBP/CHF right now from the resistance line above with the target of 1.059 because of the confluence of the two strong factors which are the general downtrend on the previous 1W candle and the overbought situation on the lower TF determined by it’s proximity to the upper BB band.
Disclosure: I am part of Trade Nation's Influencer program and receive a monthly fee for using their TradingView charts in my analysis.
✅LIKE AND COMMENT MY IDEAS✅

Why Most Traders Exit Too Early — Psychology of Taking Profits1. Introduction
Most traders obsess over finding the perfect entry.
But what really separates professionals from everyone else is how they exit.
Closing trades too early kills more profits than bad setups ever will.
The problem might be one's psychology.
2. The Two Fears That Control Exits
When managing profits, every trader battles two emotions:
Fear of Loss – “ What if the PRICE reverses?”
Fear of Regret – “What if it keeps running after I close?”
Both pull you in opposite directions. One makes you take profit too soon; the other makes you hold too long.
The balance between them defines your discipline.
3. Why Most Traders Close Too Early
After entering a good trade, emotions rise. As profit builds, so does anxiety.
Instead of trusting their plan, traders imagine losing what they’ve just gained, so they close the trade prematurely.
In doing so, they trade emotion, not logic.
It feels safe in the moment, but long term it destroys reward-to-risk consistency.
4. The Solution: Predefine the Exit
The only way to remove hesitation is to plan exits before entering.
Decide in advance:
– Target levels based on structure or risk-reward.
– Conditions that justify partial profits.
– Situations that allow for trailing stops.
When these decisions are made beforehand, emotions can’t interfere mid-trade.
You act according to a plan, not a feeling.
Visual idea: Screenshot-style mockup of trade plan with marked “Entry,” “Partial,” “Final Target.”
5. The Real Lesson
Profit-taking should be systematic, not emotional.
Your job isn’t to catch every little move, it’s to execute your plan without hesitation.

EURJPY The Target Is UP! BUY!
My dear friends,
EURJPY looks like it will make a good move, and here are the details:
The market is trading on 177.10 pivot level.
Bias - Bullish
Technical Indicators: Supper Trend generates a clear long signal while Pivot Point HL is currently determining the overall Bullish trend of the market.
Goal - 177.51
Recommended Stop Loss - 176.90
About Used Indicators:
Pivot points are a great way to identify areas of support and resistance, but they work best when combined with other kinds of technical analysis
Disclosure: I am part of Trade Nation's Influencer program and receive a monthly fee for using their TradingView charts in my analysis.
———————————
WISH YOU ALL LUCK

The Ultimate GOLD & SILVER Outlook || 5 Trade Setups 28-Oct-2025Welcome to Trade with Decrypters!
📊 DETAILED & COMPLETE ANALYSIS (5 TRADE SETUPS) - OANDA:XAUUSD Gold & Silver Outlook 2025
🏦 Central Bank Buying
* 900 tonnes accumulated YTD 2025 (Q3: +19t)
* BRICS hold 6,000t (20% global reserves)
* 🇨🇳 China: +2,299t
* 🇮🇳 India: +880t
* 🇵🇱 Poland: +68t (H1)
* Motive: De-dollarization & sanctions hedge
📈 Outlook: 950t full-year supports long-term price appreciation.
💰 ETF Inflows & Sentiment
* YTD inflows: $28B (AUM: $472B, +6% QoQ)
* US inflows: $22B | Europe: $4.4B (Sept)
* Gold RSI: 78.4 (Support: $3,700 | Resistance: $3,840)
* Silver RSI: 72 (Support: $42)
📈 Outlook: Gold → $3,400/oz (Q4) | Silver → $38/oz on 150t annual inflows.
🌍 Macro & Geopolitical Events
* Fed cuts: 50 bps by YE, Funds rate → 4.25%
* US CPI 2.7% → 2.9% Q4 (tariffs impact)
* BRICS gold-backed currency expected 2026
* USD reserves down 15% since 2022
* Trade wars → CPI +0.5–1%
📈 Outlook: Gold → $3,675/oz | Silver → $38.45/oz (Q4) on global inflation >5%.
⚡ Silver Deficit
* 2025 deficit: 149M oz (Supply: 844M oz | Demand: 1.21B oz)
* Industrial demand: 680M oz (+12% EVs, +20% solar)
* China: 40% PV use
📈 Outlook: Deficit to widen → 206M oz (2026) | Silver > $40/oz on 9% industrial growth.
📊 Futures & Options Flow
* CME Gold OI: 529k (+12% YoY)
* Silver OI: 180k (+15%)
* Gold call/put ratio: 2:1 | Silver: 3:1
* CVOL: 15–18%
📈 Outlook: OI → 550k by YE | Volatility → 20% on Fed + geopolitics.
🔮 Fundamentals & Forecast
* Gold: +15–20% → $3,400/oz YE 2025
* Drivers: 900t CB demand, $64B ETF inflows, de-dollarization
* Silver: +45% → $38/oz YE 2025
* Drivers: 149M oz deficit, 59% industrial demand
⚡ Macro Drivers: CPI >2.7%, Fed cuts, US deficit 7%, BRICS fragmentation.
Structural re-rating likely into 2026 🚀
Disclaimer: This analysis is for educational purposes only. Not financial advice.

Gold price analysis October 28📉 GOLD UPDATE – Correction Phase Continues
Gold remains under bearish pressure as buyers failed to hold the price above 4057, confirming that sellers are back in control. The market structure now supports a continued corrective move toward the 3955 support zone during the European session. A further breakdown below this level could open the way to 3892, which serves as the next key downside target.
For now, the focus should remain on SELL setups during the London session. Any BUY positions would be considered counter-trend and only valid if price shows strong rejection signals at key supports or reclaims the 4057 zone.
🎯 Trading Plan
SELL trigger: Price rejection at resistance zone 4050
SELL DCA: On break below 3955
Target: 3890

LiamTrading - XAUUSD: SCENARIO BEFORE FOMC LiamTrading - XAUUSD: SCENARIO BEFORE FOMC - $3840 Level Awaits Bottom Fishing Reaction Wave
Hello traders community,
The Gold market is showing a strong and sustainable downtrend. We are witnessing a crash after prices broke through key support zones. With the upcoming FOMC event, our strategy is to seek Buy opportunities at deep liquidity zones and continue Selling when prices recover to retest the broken trend.
📰 MACRO ANALYSIS & CASH FLOW CONTEXT
Gold is currently under dual pressure:
Downward Pressure 🔴: Optimism about the US-China trade progress has significantly weakened the demand for Gold, a safe-haven commodity. Spot Gold prices have fallen below $3950, hitting a three-week low, down about 0.78% on the day (28/10).
Short-term Support 🟢: Bets on the possibility of a Fed rate cut continue to weaken the US Dollar (USD), which is the only factor that could potentially support this precious metal.
Conclusion: This tug-of-war makes it difficult to determine the bottom. The bearish scenario remains the top priority.
📊 TECHNICAL ANALYSIS: THE DOWNWAVE CONTINUES
Based on the H4 chart (image_5fa7fa.png):
Current Trend: The price has successfully broken through the key liquidity support zone near $3950 and is continuing its downtrend.
Current Fibonacci Level: The price is touching and reacting at the 1.618 Fibonacci zone (around $3950).
Next Level: The next level Gold is targeting will be the 2.618 Fibonacci zone (around $3840), which is a large liquidity area expected to see a strong reaction.
Main Strategy: We focus on two scenarios: Bottom fishing reaction at 3840 and continuing to Sell when the price recovers.
🎯 DETAILED TRADING PLAN (ACTION PLAN)
We have two detailed scenarios based on the current price level:
🟢 BUY Reversal Scenario
We wait for the price to hit the deep liquidity bottom zone of 3840 to execute a buy order with the expectation of a technical recovery.
Entry Zone: 3840
Stop Loss (SL): 3832 (tight SL)
Take Profit Targets (TP): TP1: $3872 | TP2: $3898 | TP3: $3925 | TP4: $3950
🔴 SELL Retest Scenario
If Gold recovers without breaking the downtrend structure:
Entry Zone: Watch for a Sell retest at $4091
Stop Loss (SL): $4099
Take Profit Targets (TP): TP1: $4065 | TP2: $4033 | TP3: $4004 | TP4: $3965
SUMMARY & DISCIPLINE (Steven's Note)
Gold is in a strong fall ahead of the FOMC, with significant volatility expected. Capturing deep Fibonacci and Liquidity zones is key.
Note: Always adhere to the set Stop Loss. Capital management is the number one priority, risking only 1-2% of the account per trade.
Wishing traders a successful and disciplined new trading week!

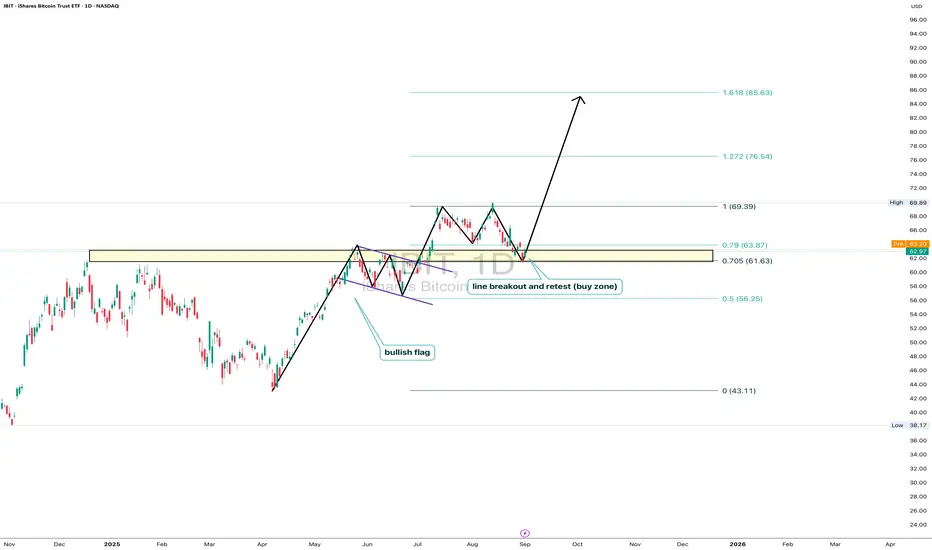
IBIT: ready for liftoffOn the daily chart, iShares Bitcoin Trust (IBIT) trades at $62.97, testing the key 0.705–0.79 Fibo zone ($61.63–63.87). This area marks a breakout and retest line, forming a clear buy zone. The technical structure remains bullish: after breaking out and pulling back, price holds potential to move toward $69.39, with Fibo extensions targeting $76.54 and $85.63. Volumes confirm buyer activity on dips, and the bullish flag pattern supports the continuation of the upward trend.
Fundamentally , the main driver is bitcoin itself, with institutional demand for BTC ETFs staying strong. Large funds continue accumulating positions, while expectations of a softer Fed tone add pressure on the dollar, fueling capital inflows into crypto. This strengthens the bullish case for IBIT.
Tactical plan: watch $61.6–63.8 as the key entry zone. Holding above opens the path toward $69.3, followed by $76.5 and $85.6. The scenario breaks only if price falls below $61.
And let’s be honest: IBIT isn’t just a ticker - it’s the “accelerate bitcoin” button for your portfolio.
CRUDE OIL Potential Short! Sell!
Hello, Traders!
CRUDE OIL Price is reacting to a clear Horizontal Supply Area after liquidity sweep above the recent swing high. Smart money positioning suggests a short-term redistribution phase as sell-side liquidity below $61 becomes the draw.Time Frame 4H.
Sell!
Comment and subscribe to help us grow!
Check out other forecasts below too!
Disclosure: I am part of Trade Nation's Influencer program and receive a monthly fee for using their TradingView charts in my analysis.
