EUR-GBP Local Short! Sell!
Hello, Traders!
EURGBP tapped a key supply area after a liquidity grab, signaling potential smart money distribution. Expect bearish reaction and continuation toward the target level as price seeks balance after inefficiency.
Time Frame 3H.
Sell!
Comment and subscribe to help us grow!
Check out other forecasts below too!
Disclosure: I am part of Trade Nation's Influencer program and receive a monthly fee for using their TradingView charts in my analysis.
Trading

GBPAUD FREE SIGNALS|LONG|
✅GBPAUD Price has reached a key discount zone tapping into a high-probability demand area. Smart money could now be accumulating long positions, anticipating a shift in structure toward the next liquidity draw above recent highs.
—————————
Entry: 2.0450
Stop Loss: 2.0425
Take Profit: 2.0481
Time Frame: 2H
—————————
LONG🚀
✅Like and subscribe to never miss a new idea!✅

USD-CAD Free Signal! Buy!
Hello,Traders!
USDCAD Price is reacting from a well-defined horizontal demand area where previous sell-side liquidity was swept. Smart money may now be accumulating long positions for a bullish push toward the next liquidity pool.
-------------------
Stop Loss: 1.3975
Take Profit: 1.4020
Entry: 1.3995
Time Frame: 3H
-------------------
Buy!
Comment and subscribe to help us grow!
Check out other forecasts below too!
Disclosure: I am part of Trade Nation's Influencer program and receive a monthly fee for using their TradingView charts in my analysis.

NZDUSD LOCAL SHORT|
✅NZDUSD is currently trading inside a premium zone within a key supply area, where liquidity above previous highs has likely been engineered. A shift in market structure from here could confirm a short setup toward the next draw on liquidity. Time Frame 2H.
SHORT🔥
✅Like and subscribe to never miss a new idea!✅

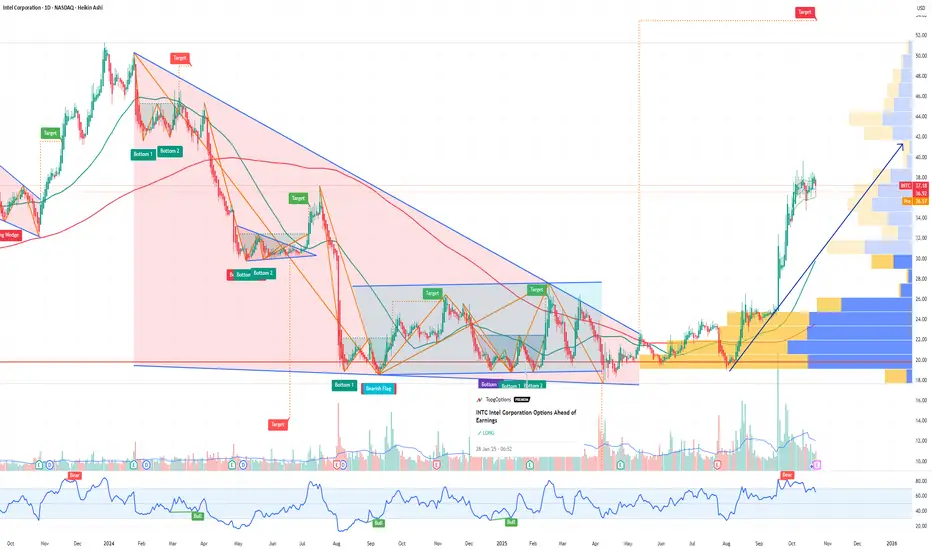
INTC Intel Corporation Options Ahead of EarningsIf you haven`t bought the dip on INTC:
Now analyzing the options chain and the chart patterns of INTC Intel Corporation prior to the earnings report this week,
I would consider purchasing the 48usd strike price Calls with
an expiration date of 2026-3-20,
for a premium of approximately $2.75.
If these options prove to be profitable prior to the earnings release, I would sell at least half of them.
NEM Newmont Corporation Options Ahead of EarningsAnalyzing the options chain and the chart patterns of NEM Newmont Corporation prior to the earnings report this week,
I would consider purchasing the 87usd strike price Puts with
an expiration date of 2025-10-24,
for a premium of approximately $2.18.
If these options prove to be profitable prior to the earnings release, I would sell at least half of them.

PG The Procter & Gamble Company Options Ahead of EarningsIf you haven`t bought the dip on PG:
Now analyzing the options chain and the chart patterns of PG The Procter & Gamble Company prior to the earnings report this week,
I would consider purchasing the 152.50usd strike price Calls with
an expiration date of 2025-11-21,
for a premium of approximately $3.55.
If these options prove to be profitable prior to the earnings release, I would sell at least half of them.

EURJPY Trading Opportunity! SELL! My dear followers,
This is my opinion on the EURJPY next move:
The asset is approaching an important pivot point 176.95
Bias - Bearish
Technical Indicators: Supper Trend generates a clear short signal while Pivot Point HL is currently determining the overall Bearish trend of the market.
Goal - 176.33
About Used Indicators:
For more efficient signals, super-trend is used in combination with other indicators like Pivot Points.
Disclosure: I am part of Trade Nation's Influencer program and receive a monthly fee for using their TradingView charts in my analysis.
———————————
WISH YOU ALL LUCK

GOLD What Next? SELL!
My dear subscribers,
This is my opinion on the GOLD next move:
The instrument tests an important psychological level 4125.9
Bias - Bearish
Technical Indicators: Supper Trend gives a precise Bearish signal, while Pivot Point HL predicts price changes and potential reversals in the market.
Target - 4093.5
My Stop Loss - 4146.0
About Used Indicators:
On the subsequent day, trading above the pivot point is thought to indicate ongoing bullish sentiment, while trading below the pivot point indicates bearish sentiment.
Disclosure: I am part of Trade Nation's Influencer program and receive a monthly fee for using their TradingView charts in my analysis.
———————————
WISH YOU ALL LUCK

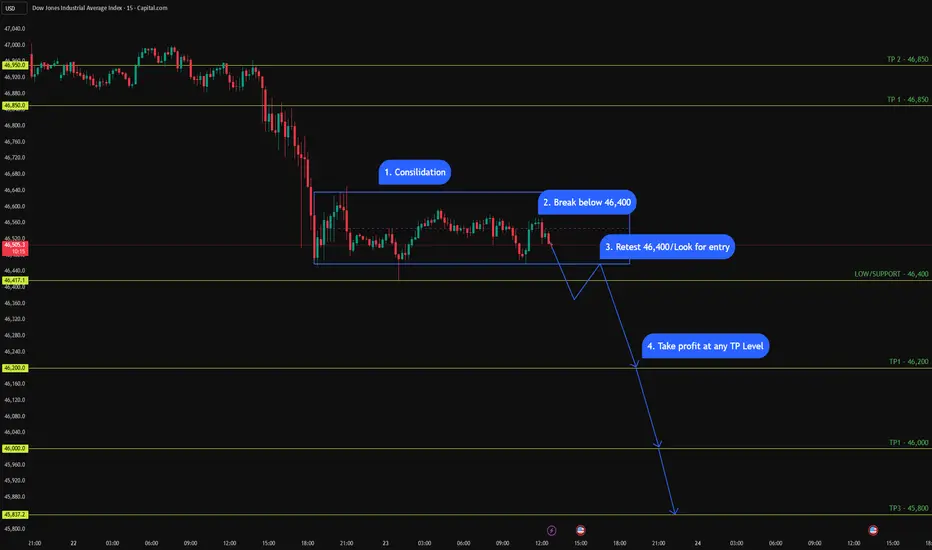
US30 (15M - 1M Daily Setup) - Bearish Bias US30 (15M - 1M Daily Setup) - Bearish Bias 📉
Price is consolidating under key resistance, forming lower highs. I’m watching 46,400 as the make-or-break level.
✅ Plan:
1️⃣ Consolidation phase complete
2️⃣ Looking for a clean break below 46,400
3️⃣ Retest → possible short entry
4️⃣ Target zones:
• TP1 → 46,200
• TP2 → 46,000
• TP3 → 45,800
📍 Bias stays bearish as long as price remains below 46,850 – 47,000.
Let’s see if the breakdown plays out. 👀
GOLD BEARS WILL DOMINATE THE MARKET|SHORT
GOLD SIGNAL
Trade Direction: short
Entry Level: 4,107.17
Target Level: 3,579.84
Stop Loss: 4,459.30
RISK PROFILE
Risk level: medium
Suggested risk: 1%
Timeframe: 1D
Disclosure: I am part of Trade Nation's Influencer program and receive a monthly fee for using their TradingView charts in my analysis.
✅LIKE AND COMMENT MY IDEAS✅

AUD/CHF SENDS CLEAR BEARISH SIGNALS|SHORT
AUD/CHF SIGNAL
Trade Direction: short
Entry Level: 0.519
Target Level: 0.514
Stop Loss: 0.522
RISK PROFILE
Risk level: medium
Suggested risk: 1%
Timeframe: 6h
Disclosure: I am part of Trade Nation's Influencer program and receive a monthly fee for using their TradingView charts in my analysis.
✅LIKE AND COMMENT MY IDEAS✅

AUD/NZD SELLERS WILL DOMINATE THE MARKET|SHORT
Hello, Friends!
It makes sense for us to go short on AUD/NZD right now from the resistance line above with the target of 1.127 because of the confluence of the two strong factors which are the general downtrend on the previous 1W candle and the overbought situation on the lower TF determined by it’s proximity to the upper BB band.
Disclosure: I am part of Trade Nation's Influencer program and receive a monthly fee for using their TradingView charts in my analysis.
✅LIKE AND COMMENT MY IDEAS✅

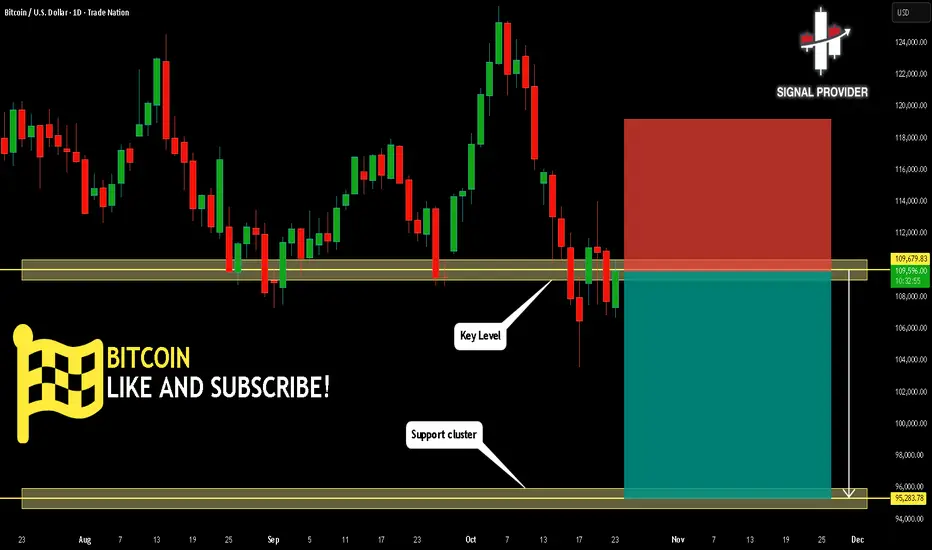
BITCOIN Will Go Down From Resistance! Short!
Take a look at our analysis for BITCOIN.
Time Frame: 1D
Current Trend: Bearish
Sentiment: Overbought (based on 7-period RSI)
Forecast: Bearish
The market is approaching a key horizontal level 109,679.83.
Considering the today's price action, probabilities will be high to see a movement to 95,283.78.
P.S
The term oversold refers to a condition where an asset has traded lower in price and has the potential for a price bounce.
Overbought refers to market scenarios where the instrument is traded considerably higher than its fair value. Overvaluation is caused by market sentiments when there is positive news.
Like and subscribe and comment my ideas if you enjoy them!
NZDUSD Will Go Higher! Buy!
Please, check our technical outlook for NZDUSD.
Time Frame: 1D
Current Trend: Bullish
Sentiment: Oversold (based on 7-period RSI)
Forecast: Bullish
The market is approaching a significant support area 0.574.
The underlined horizontal cluster clearly indicates a highly probable bullish movement with target 0.584 level.
P.S
We determine oversold/overbought condition with RSI indicator.
When it drops below 30 - the market is considered to be oversold.
When it bounces above 70 - the market is considered to be overbought.
Like and subscribe and comment my ideas if you enjoy them!

EURAUD Will Go Down! Sell!
Here is our detailed technical review for EURAUD.
Time Frame: 1D
Current Trend: Bearish
Sentiment: Overbought (based on 7-period RSI)
Forecast: Bearish
The market is on a crucial zone of supply 1.780.
The above-mentioned technicals clearly indicate the dominance of sellers on the market. I recommend shorting the instrument, aiming at 1.755 level.
P.S
Overbought describes a period of time where there has been a significant and consistent upward move in price over a period of time without much pullback.
Like and subscribe and comment my ideas if you enjoy them!

GBPJPY Will Move Higher! Long!
Take a look at our analysis for GBPJPY.
Time Frame: 12h
Current Trend: Bullish
Sentiment: Oversold (based on 7-period RSI)
Forecast: Bullish
The price is testing a key support 203.667.
Current market trend & oversold RSI makes me think that buyers will push the price. I will anticipate a bullish movement at least to 205.373 level.
P.S
Please, note that an oversold/overbought condition can last for a long time, and therefore being oversold/overbought doesn't mean a price rally will come soon, or at all.
Like and subscribe and comment my ideas if you enjoy them!

The Ultimate GOLD || Intraday Trading Plan (10/23/2025)Welcome to Trade with Decrypters!
DETAILED AND COMPLETE ANALYSIS ( 5 TRADE SETUPS )
Central Bank Buying
Central banks added net 19t in August led by Kazakhstan (14t), Bulgaria and El Salvador, Q3 on pace for 1,000t+ annually up 41% from historical norms. BRICS drivers like China (300t+ YTD) and India's $100B reserves fuel de-dollarization and inflation hedges; Poland reaffirms targets amid risks. Silver links to EV/solar boom (+70% China demand). Outlook: Unfazed 1,000t buys lift prices into 2026.
ETF Inflows & Sentiment
Gold ETFs hit $472B AUM in Q3 (+23% q/q) with $64B YTD inflows, September $17B record led by North America/Europe; Asia minor outflows. Safe-haven rush amid trade wars, minor profit-taking post $4k peak. RSI 75 overbought, $3,900 support holds. Silver +$2B YTD on industry bets. Forecast: Gold $4,200 test, silver $50+.
Macro & Geopolitical Events
Fed Oct cut vs. 2.9% inflation/shutdown-delayed jobs—labor firmer but risks grow.
Trump's China tariffs fuel wars; BRICS stalls de-dollarization but boosts gold; Ukraine/Mideast hikes energy/inflation. Drives 50%+ YTD metals gains; tariffs add 1–2% CPI.
Silver Deficit
Fifth straight deficit at 118M oz in 2025 (down 21% YoY), demand stable 1.20B oz vs supply +3% to 1.05B oz, industrial record 680M+ oz from solar/EVs. Renewables offset jewelry drops
Futures & Options Flow
CME gold OI ~528k contracts, steady amid volumes; CVOL moderate, call/put skew bullish for rate-cut squeezes
Fundamentals & Forecast
Gold +51% to $4,062, silver +43% to $48—via 1,000t+ CB buys, inflation, cuts, 7% GDP deficits. De-dollarization/geo-risks dominate. Projection: Gold $4,400 Q4, silver $57 mid-2026

Derivatives Make Trading EasyIntroduction
Derivatives are among the most influential financial innovations of the modern era, playing a crucial role in shaping global financial markets. A derivative is a financial contract whose value is derived from an underlying asset, index, or rate. These underlying assets can include commodities, currencies, bonds, equities, or market indices. The primary purpose of derivatives is to manage risk, enhance liquidity, and enable traders and investors to speculate or hedge against future price movements.
In today’s complex and interconnected markets, derivatives have become indispensable tools. They make trading easier by allowing market participants to transfer risk, leverage capital efficiently, and discover prices more transparently. From futures and options to swaps and forwards, derivatives are central to both institutional and retail trading strategies worldwide.
Understanding Derivatives
A derivative derives its price from an underlying asset or benchmark. For instance, a crude oil futures contract is based on the expected future price of oil. The buyer or seller of a derivative does not necessarily have to own the physical asset; rather, they engage in a contract based on the price movement of that asset.
There are four main types of derivatives:
Futures – Standardized contracts to buy or sell an asset at a specified future date and price.
Options – Contracts that give the holder the right, but not the obligation, to buy or sell an asset at a predetermined price.
Forwards – Customized, over-the-counter (OTC) agreements to trade an asset in the future at a fixed price.
Swaps – Contracts in which two parties exchange cash flows or other financial instruments over time.
These instruments are used for hedging, speculation, and arbitrage—three pillars that make derivatives essential in trading.
Derivatives as a Tool for Risk Management
One of the greatest advantages of derivatives is their ability to hedge risk. Price volatility in assets like oil, currencies, and equities can significantly affect businesses, investors, and governments. Derivatives provide a means to protect against adverse price movements.
For example, consider an airline company concerned about fluctuating oil prices. Since fuel costs represent a large portion of operational expenses, the company may purchase oil futures to lock in a price for future deliveries. This strategy ensures that even if oil prices rise sharply, the airline’s fuel costs remain stable. Similarly, exporters and importers use currency derivatives to hedge against foreign exchange volatility.
In essence, derivatives transfer risk from those who want to avoid it (hedgers) to those who are willing to take it (speculators). This risk redistribution stabilizes markets and enables participants to focus on their core activities without worrying about unpredictable price swings.
Facilitating Leverage and Capital Efficiency
Another reason derivatives make trading easier is through leverage. Leverage allows traders to control large positions with relatively small amounts of capital. This is because derivatives require only a margin or initial deposit rather than full payment of the underlying asset’s value.
For instance, instead of buying 100 shares of a company at ₹1,000 each (totaling ₹1,00,000), a trader could buy a futures contract that represents the same 100 shares by depositing a margin of just 10%, or ₹10,000. If the stock price rises, the percentage return on the margin is magnified, offering higher potential profits.
While leverage increases both gains and risks, it allows participants to deploy capital more efficiently, freeing funds for other investments or hedging needs. For professional traders, portfolio managers, and institutions, this efficiency is a cornerstone of modern trading strategies.
Enhancing Market Liquidity
Derivatives also increase liquidity in financial markets. Liquidity refers to the ease with which assets can be bought or sold without significantly affecting their prices. Derivative markets attract diverse participants—hedgers, speculators, and arbitrageurs—who together contribute to high trading volumes and continuous price discovery.
For example, the introduction of futures and options on equity indices such as the Nifty 50 or S&P 500 has dramatically boosted liquidity in underlying stock markets. Traders can enter or exit positions quickly, and price discrepancies between derivatives and underlying assets are swiftly corrected through arbitrage. This constant interaction between cash and derivative markets ensures price stability and efficiency.
Thus, derivatives not only make trading more active but also promote smoother market functioning, benefitting investors, institutions, and regulators alike.
Price Discovery and Transparency
Price discovery is the process through which markets determine the fair value of assets. Derivatives play a vital role in this mechanism. Since derivative prices reflect traders’ expectations about future asset values, they serve as leading indicators of market sentiment.
For example, if the futures price of gold is significantly higher than its current spot price, it suggests that investors expect gold prices to rise. Similarly, options trading activity can reveal expectations about market volatility. Analysts and policymakers closely monitor derivatives data—like the VIX index, derived from options on the S&P 500—to gauge investor confidence and predict potential market movements.
This informational efficiency makes derivatives indispensable in modern trading, enabling participants to anticipate trends and adjust strategies accordingly.
Speculation and Profit Opportunities
While hedging focuses on risk management, speculation involves taking positions to profit from price fluctuations. Derivatives make speculation more accessible and efficient. Since derivatives require lower capital outlays and offer high liquidity, traders can speculate on short-term movements in equities, commodities, interest rates, or currencies without owning the underlying assets.
For instance, a trader who believes that crude oil prices will increase might buy oil futures. If prices indeed rise, the trader can sell the contract for a profit without ever dealing with the physical commodity. Similarly, options traders can design complex strategies—such as straddles, strangles, and spreads—to profit from both rising and falling markets.
Speculators play a crucial role in maintaining market balance. Their willingness to assume risk provides liquidity and ensures smoother price adjustments, indirectly benefiting hedgers and investors.
Arbitrage and Market Efficiency
Arbitrage—the practice of exploiting price differences between related markets—is another area where derivatives simplify trading. Arbitrageurs identify discrepancies between the spot price of an asset and its derivative price, buying in one market and selling in another to lock in risk-free profits.
For instance, if a stock trades at ₹500 in the cash market but its futures contract is priced at ₹510, an arbitrageur could buy the stock and simultaneously sell the futures. When the prices converge, they earn a small profit with minimal risk.
This activity keeps markets aligned, preventing excessive mispricing and enhancing overall efficiency. The continuous presence of arbitrageurs ensures that derivative prices accurately reflect the underlying asset’s value.
Applications Across Sectors
Derivatives are not limited to financial institutions. They are used across sectors for strategic and operational benefits:
Corporations use currency and interest rate derivatives to manage cross-border risks and borrowing costs.
Farmers and commodity producers hedge against unpredictable weather or price fluctuations using futures contracts.
Investors and fund managers use equity and index derivatives to balance portfolios and protect returns.
Governments and central banks utilize derivatives for monetary policy operations and debt management.
By providing flexibility and adaptability, derivatives make trading and financial management easier for all these entities.
Derivatives and Globalization
The rise of global trade and interconnected capital markets has further amplified the importance of derivatives. With cross-border investments, exchange rate volatility, and global supply chains, businesses face multiple layers of financial risk. Derivatives provide a universal language for managing these exposures.
For example, multinational corporations use foreign exchange swaps to manage international cash flows, while global investors employ interest rate futures to navigate shifting monetary policies across countries. In this way, derivatives enable smoother international trade and investment, fostering global financial integration.
Technological Advancements and Derivative Trading
Modern technology has revolutionized derivative trading. Algorithmic and high-frequency trading systems execute thousands of derivative transactions per second, ensuring real-time liquidity and efficient pricing. Online trading platforms allow retail investors to access futures and options markets with ease, democratizing financial participation.
Additionally, innovations like exchange-traded derivatives (ETDs) and clearinghouses have enhanced safety and transparency. Centralized clearing reduces counterparty risk, ensuring that both sides of a trade are guaranteed by the exchange. This framework has made derivatives trading more secure and accessible than ever before.
Challenges and Risks
While derivatives make trading easier, they also come with risks. Excessive leverage can amplify losses, and complex derivative structures can be misused or misunderstood. The 2008 global financial crisis highlighted how poorly regulated derivatives—especially credit default swaps—can destabilize entire economies.
Therefore, it is vital for traders and institutions to implement strong risk management, compliance, and transparency measures. Exchanges and regulators such as SEBI, CFTC, and ESMA continuously update guidelines to ensure that derivative trading remains fair, secure, and beneficial to the broader economy.
Conclusion
Derivatives have fundamentally transformed how the world trades, invests, and manages financial risk. They simplify trading by enabling participants to hedge exposures, speculate intelligently, discover prices efficiently, and optimize capital use. From farmers and corporations to fund managers and central banks, derivatives serve as versatile instruments that empower decision-making in an uncertain world.
By transferring risk, enhancing liquidity, and increasing efficiency, derivatives make financial markets more resilient and dynamic. However, like any powerful tool, they require discipline, understanding, and regulatory oversight to ensure stability. When used responsibly, derivatives do not just make trading easy—they make it smarter, safer, and more strategic in the global financial ecosystem.

Quantitative and Algorithmic Trading in the Global MarketIntroduction
In the ever-evolving world of financial markets, quantitative and algorithmic trading have emerged as the twin engines powering modern investment and trading strategies. They represent the fusion of finance, mathematics, statistics, and computer science to create data-driven, rule-based systems capable of executing trades with precision and speed beyond human capability. Over the past three decades, these methods have transformed global trading dynamics — reshaping liquidity, price discovery, and even the structure of exchanges. Quantitative and algorithmic trading now dominate trading volumes in equities, forex, commodities, and derivatives markets worldwide.
This essay explores the concepts, strategies, technologies, advantages, and risks associated with quantitative and algorithmic trading, as well as their impact on global financial markets.
Understanding Quantitative and Algorithmic Trading
Quantitative trading refers to the use of mathematical and statistical models to identify trading opportunities. It relies heavily on quantitative analysis, which involves collecting large sets of historical and real-time market data, identifying patterns, and forecasting potential price movements. Quantitative traders, often called “quants,” use sophisticated models to test hypotheses and develop systematic strategies for profit generation.
Algorithmic trading (Algo trading), on the other hand, is the practical implementation of these quantitative models through computer algorithms that automatically execute trades. It involves predefined instructions that specify when, how, and how much to trade, based on parameters such as timing, price, volume, and market conditions.
In simple terms, quantitative trading focuses on the “why” — the logic and mathematical framework — while algorithmic trading handles the “how” — the automation and execution of the strategy.
Historical Evolution
The roots of quantitative trading can be traced back to the 1970s when computers were first used for portfolio optimization and risk management. Pioneers like Edward Thorp, the author of Beat the Market, applied probability theory to stock trading and option pricing, laying the foundation for quant finance.
The 1980s and 1990s witnessed the rise of electronic trading platforms, which enabled automated order matching. Firms like Renaissance Technologies and D.E. Shaw built statistical arbitrage models that consistently delivered high returns using advanced mathematics.
By the 2000s, algorithmic trading became mainstream, aided by technological progress, faster data transmission, and regulatory changes such as the U.S. SEC’s approval of electronic communication networks (ECNs). High-Frequency Trading (HFT) — the fastest form of algorithmic trading — emerged, executing thousands of orders in milliseconds. Today, more than 70% of equity trades in developed markets like the U.S. and Europe are executed algorithmically.
Core Components of Quantitative and Algorithmic Trading
Data Acquisition and Management
Data is the lifeblood of quantitative trading. Traders collect massive datasets — historical prices, order book information, news sentiment, economic indicators, and alternative data such as satellite images or social media trends. This data is cleaned, normalized, and stored for analysis using advanced databases and cloud computing systems.
Model Development and Backtesting
Quant models are developed using statistical and machine learning techniques to forecast price movements or detect inefficiencies. Backtesting evaluates these models on historical data to verify performance and robustness before deployment in live markets.
Execution Algorithms
Algorithms are designed to execute trades efficiently while minimizing market impact and transaction costs. Common execution algorithms include Volume Weighted Average Price (VWAP), Time Weighted Average Price (TWAP), and Percentage of Volume (POV).
Risk Management Systems
Every quantitative model includes strict risk controls — such as stop-loss mechanisms, position limits, and exposure checks — to protect against unforeseen market events and model failures.
Infrastructure and Technology
Cutting-edge hardware, low-latency networks, and co-location services (placing trading servers near exchange data centers) are essential for high-frequency and algorithmic trading. Millisecond delays can mean the difference between profit and loss.
Types of Quantitative and Algorithmic Strategies
Statistical Arbitrage
This involves exploiting short-term price inefficiencies between related securities. For instance, pairs trading identifies two correlated assets — when their price relationship diverges, one is bought and the other is sold short, expecting reversion to the mean.
Trend-Following Models
These algorithms capitalize on persistent market trends using indicators like moving averages or momentum oscillators. When the price breaks above a defined resistance, a buy signal is triggered.
Mean Reversion Strategies
Based on the idea that prices tend to revert to their long-term average, these models look for overbought or oversold conditions.
Market Making Algorithms
Market makers continuously quote buy and sell prices, earning the bid-ask spread while providing liquidity. Algorithms dynamically adjust quotes based on volatility and order flow.
High-Frequency Trading (HFT)
HFT strategies execute thousands of trades per second to exploit micro-inefficiencies. Techniques include latency arbitrage and order anticipation.
Machine Learning-Based Strategies
Modern quants increasingly use artificial intelligence and deep learning models to analyze nonlinear patterns in large datasets, from news sentiment to macroeconomic variables.
Event-Driven Trading
Algorithms react to real-time events such as earnings announcements, mergers, or geopolitical developments. For example, a positive earnings surprise may trigger a buy signal.
Index Arbitrage and ETF Strategies
These exploit price differences between index futures, exchange-traded funds, and their underlying constituents.
Quantitative and Algorithmic Trading in Major Global Markets
United States
The U.S. is the global hub of algorithmic trading, accounting for the majority of automated volume. Major exchanges like NASDAQ and NYSE provide low-latency access, and firms such as Citadel Securities, Renaissance Technologies, and Jane Street dominate market making and quant strategies.
Europe
European markets, regulated under MiFID II, emphasize transparency and fairness in algorithmic trading. London remains a major center for hedge funds and algorithmic firms.
Asia-Pacific
Algorithmic trading is rapidly expanding in markets like Japan, Singapore, Hong Kong, and India. In India, the National Stock Exchange (NSE) supports co-location and direct market access, making it one of the fastest-growing algorithmic ecosystems.
Emerging Markets
Countries such as Brazil, South Africa, and the Middle East are adopting algorithmic platforms, although liquidity and infrastructure remain developmental challenges.
Benefits of Quantitative and Algorithmic Trading
Speed and Efficiency
Algorithms execute orders within microseconds, allowing traders to capture fleeting market opportunities impossible for humans to detect manually.
Reduced Human Bias
Trading decisions are based on predefined logic rather than emotion, minimizing psychological biases such as fear and greed.
Lower Transaction Costs
Smart order routing and optimal execution algorithms reduce slippage and market impact, enhancing profitability.
Liquidity Enhancement
Market-making algorithms continuously provide buy and sell orders, improving liquidity and narrowing bid-ask spreads.
Scalability
A single algorithm can manage thousands of securities across global markets simultaneously, offering unmatched scalability.
Backtesting and Optimization
Quantitative systems can be tested extensively on historical data, refining strategies before real-world application.
Risks and Challenges
Despite their advantages, quantitative and algorithmic trading come with significant risks:
Model Risk
Models are based on assumptions that may fail under changing market conditions. A small coding error or mis-specified model can cause massive losses.
Overfitting and Data Snooping
Over-optimization of models on historical data can produce unrealistic results that fail in live trading.
Liquidity and Flash Crashes
Excessive algorithmic activity can amplify volatility. The 2010 U.S. “Flash Crash” highlighted how algorithmic feedback loops could trigger rapid market collapses.
Regulatory Risk
Regulators globally are tightening oversight of algorithmic trading to prevent manipulation and ensure fairness. Compliance costs and monitoring requirements are rising.
Technology Failures
System outages, latency issues, or cyberattacks can disrupt trading and cause severe financial losses.
Competition and Market Saturation
As more participants adopt similar strategies, profit margins shrink, and edge becomes increasingly difficult to maintain.
Regulatory Framework and Global Standards
Regulators worldwide are implementing rules to govern algorithmic and high-frequency trading.
In the United States, the SEC and CFTC monitor automated trading for fairness, requiring disclosure of algorithms and pre-trade risk checks.
In Europe, MiFID II mandates firms to test algorithms, maintain kill-switch mechanisms, and provide detailed audit trails.
In India, SEBI regulates algorithmic trading by requiring pre-approval, audit certification, and real-time risk management systems.
These measures aim to balance innovation with market integrity and investor protection.
Technological Advancements Driving the Future
The next phase of quantitative and algorithmic trading will be shaped by technologies such as:
Artificial Intelligence and Deep Learning – Algorithms that learn autonomously from new data, improving accuracy over time.
Natural Language Processing (NLP) – Automated interpretation of news, tweets, and reports to derive trading signals.
Quantum Computing – Offering unprecedented processing power for portfolio optimization and complex simulations.
Blockchain Integration – Enhancing transparency, settlement efficiency, and security in algorithmic transactions.
Cloud Computing and Big Data – Allowing scalable data storage and computation across global markets in real time.
Impact on Global Market Dynamics
Quantitative and algorithmic trading have profoundly reshaped market structure. They have enhanced liquidity, tightened spreads, and accelerated price discovery. However, they also contribute to short-term volatility and market fragmentation across multiple venues.
Institutional investors now compete with sophisticated algorithms, while retail traders benefit indirectly through lower costs and better execution. Exchanges have evolved to accommodate high-speed connectivity, and data analytics has become a core asset for every financial institution. The global market, once driven by intuition and human judgment, is now governed largely by algorithms and machine intelligence.
Conclusion
Quantitative and algorithmic trading represent the pinnacle of financial innovation, combining mathematics, computation, and automation to redefine how markets operate. They have democratized access to efficient trading tools while challenging traditional notions of value, speed, and human decision-making.
Yet, with great power comes great responsibility — ensuring transparency, ethical deployment, and robust regulation will determine the sustainable future of algorithmic trading. As artificial intelligence and data science advance further, quantitative trading will continue to evolve, shaping global markets that are faster, smarter, and more interconnected than ever before.
AUDUSD: Monitoring Downside MomentumDaily Timeframe:
Yesterday's session closed with a doji (inside bar). There's a lot of indecision going on. Price is maintaining below the HTL, however, the ranging bars may indicate that there's a lack of selling pressure.
If momentum does not pickup, we might see a fakeout. For the time being, I still maintain a bearish stance on the daily timeframe.
H1 Timeframe:
Price is breaking below the ATL, which is the first indication that momentum may be picking up throughout the Asian session.
Price remains choppy around the EMAs, which is a less reliable momentum signal.
However, I do think this pair has potential if price does not close back above the ATL.

Gold price analysis October 23GOLD UPDATE – Prioritize SELL strategy in the short term
The downward correction of gold continued to extend in yesterday's session, showing that the sellers are still clearly dominant. In the short term, the downtrend may continue, leading the price to lower support zones.
In today's session, the strategy of waiting for SELL following the downtrend is still prioritized. The 4145 zone – the important resistance level of the previous session – will play a key role. If the price cannot overcome this zone and a price rejection signal appears, the possibility of further decline will be reinforced.
Trading strategy:
🔸 SELL trigger when there is a price rejection at the resistance zone of 4145 – 4227
🎯 Target: 3946

GBPJPY: Trend ContinuationOver on the daily timeframe, price is respecting the EMAs. This is indicating a clear uptrend. In addition, the HTL is a resistance turned support level so overall bullish sentiment unless price crosses back below this level.
The H1 timeframe is also supporting the notion that there's momentum to the upside. Structurally, there's momentum to the upside. This is first indicated by price breaking above the DTL.
In this case, price's acceleration away from the EMA is not clear signal. This was quite choppy since October 12th.
There's potential to the upside, but I'd approach this pair a bit more cautiously.
