CAD-CHF Will Fall! Sell!
Hello,Traders!
CADCHF is approaching a horizontal supply area where institutional selling pressure may return. A reaction from this zone could trigger a bearish continuation toward the next liquidity pocket. Time Frame 5H.
Sell!
Comment and subscribe to help us grow!
Check out other forecasts below too!
Disclosure: I am part of Trade Nation's Influencer program and receive a monthly fee for using their TradingView charts in my analysis.
Trading

FCX Freeport-McMoRan Options Ahead of EarningsAnalyzing the options chain and the chart patterns of FCX Freeport-McMoRan prior to the earnings report this week,
I would consider purchasing the 45usd strike price Calls with
an expiration date of 2025-12-19,
for a premium of approximately $1.31.
If these options prove to be profitable prior to the earnings release, I would sell at least half of them.

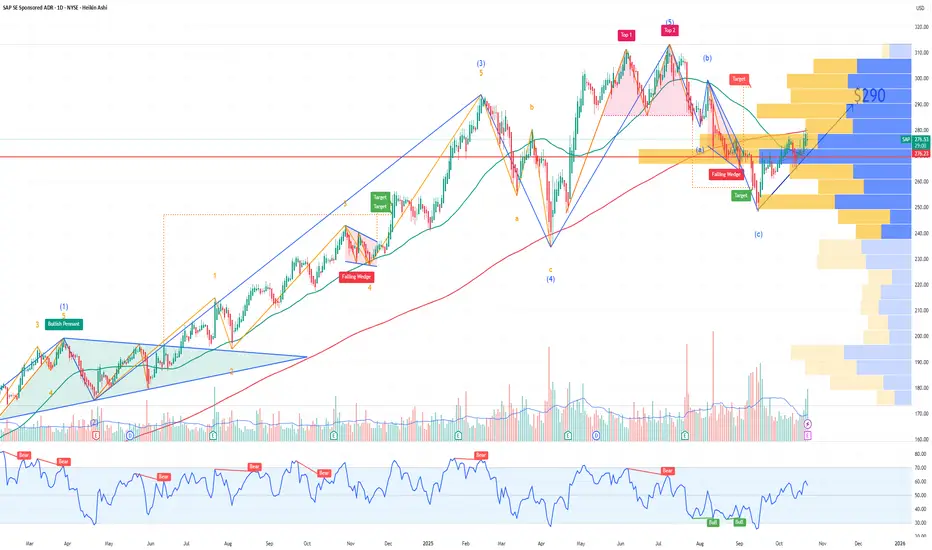
SAP Options Ahead of EarningsAnalyzing the options chain and the chart patterns of SAP prior to the earnings report this week,
I would consider purchasing the 290usd strike price Calls with
an expiration date of 2025-11-21,
for a premium of approximately $6.95.
If these options prove to be profitable prior to the earnings release, I would sell at least half of them.
VKTX Viking Therapeutics Options Ahead of EarningsIf you haven`t bought VKTX before the rally:
Now analyzing the options chain and the chart patterns of VKTX Viking Therapeutics prior to the earnings report this week,
I would consider purchasing the 60usd strike price Calls with
an expiration date of 2027-12-17,
for a premium of approximately $11.05.
If these options prove to be profitable prior to the earnings release, I would sell at least half of them.

AUDCHF: Breaks Below ATLPrice is breaking below the ascending trendline (ATL), which is a signal that the counter-trend move is coming to an end.
The H1 timeframe also demonstrates confluence across price's crossover below the ATL and price's acceleration away from the EMAs.
This is further supported by the fact that price is holding below the horizontal trendline (HTL) on the daily timeframe. We can overall maintain a bearish bias for the time being.
Given that this trade signal is close to the 5 PM rollover, it may result in a closure and then re-entry to avoid a spread spike.

AUDCHF SHORT FROM SUPPLY ZONE|
✅AUDCHF is showing rejection from a major supply zone, suggesting that smart money is preparing for a bearish continuation toward the lower liquidity pool. The setup remains valid while below the supply range. Time Frame 3H.
SHORT🔥
✅Like and subscribe to never miss a new idea!✅

AUD-CAD Free Signal! Buy!
Hello,Traders!
AUDCAD Price has tapped into a horizontal demand area where smart money buyers are likely positioned. A potential bullish reaction could follow as liquidity gets absorbed from the previous lows.
-------------------
Stop Loss: 0.9059
Take Profit: 0.9079
Entry: 0.9068
Time Frame: 3H
-------------------
Buy!
Comment and subscribe to help us grow!
Check out other forecasts below too!
Disclosure: I am part of Trade Nation's Influencer program and receive a monthly fee for using their TradingView charts in my analysis.

USDCAD FREE SIGNAL|LONG|
✅USDCAD Price has reacted from a clean demand zone where buy-side liquidity was accumulated, showing signs of bullish displacement. A continuation toward the next imbalance is expected.
—————————
Entry: 1.3986
Stop Loss: 1.3975
Take Profit: 1.3999
Time Frame: 2H
Setup Risk: High
—————————
LONG🚀
✅Like and subscribe to never miss a new idea!✅

EUR-USD Local Short! Sell!
Hello,Traders!
EURUSD has reached a horizontal supply area where sellers previously stepped in. A bearish reaction from this zone could trigger a move lower as liquidity from buy-side traders gets taken. Time Frame 5H.
Sell!
Comment and subscribe to help us grow!
Check out other forecasts below too!
Disclosure: I am part of Trade Nation's Influencer program and receive a monthly fee for using their TradingView charts in my analysis.

Automated vs Manual Trading — Which One Really Wins?Most traders start out manually, staring at charts for hours, hunting for that perfect setup, trying to outsmart the market.
It feels alive. You’re in control.
But after a while, you realize something brutal:
the real opponent isn’t the market, it’s you.
Fear, greed, hesitation, fatigue. The emotions that ruin good trades. That’s when automation steps in.
Manual Trading
Manual trading builds skill, but it also exposes every weakness you’ve got.
If this sounds familiar, you’re not alone:
Entering late because you hesitated.
Moving your stop loss “just one more time.”
Doubling down after a loss.
Missing setups because you needed sleep.
Manual trading gives flexibility, sure.
But it also gives you the freedom to sabotage your own plan.
Automated Trading
Benefits
Consistency: trades follow predefined rules, eliminating impulsive deviations from the plan.
Scale: automation handles higher frequency and 24/7 market coverage beyond human capacity.
Speed and precision: orders execute with lower latency and exact risk parameters.
Backtest + deploy: strategies validated historically can be deployed reliably across multiple markets.
Operational leverage: frees human time for strategy development, risk oversight, and portfolio decisions.
Disadvantages and risks
Model risk: historical backtests do not guarantee future performance; edge can decay.
Overfitting and brittle rules: overly specific parameters may break under regime changes.
Misaligned incentives: automated systems execute mechanically; they cannot judge rare macro events or qualitative news.
Monitoring burden: automation reduces manual trading work but increases need for robust monitoring, alerts, and contingency plans beforehand.
⚔️ Two Traders, One Market
Here’s the truth: two traders can run the same strategy and get completely different results.
Trader A trades manually, emotional, inconsistent.
Trader B runs automation, same logic, perfect execution.
Same system. Different outcome.
Guess which one ends up consistent?
EURCAD My Opinion! BUY!
My dear friends,
Please, find my technical outlook for EURCAD below:
The instrument tests an important psychological level 1.6247
Bias - Bullish
Technical Indicators: Supper Trend gives a precise Bullish signal, while Pivot Point HL predicts price changes and potential reversals in the market.
Target - 1.6323
About Used Indicators:
Super-trend indicator is more useful in trending markets where there are clear uptrends and downtrends in price.
Disclosure: I am part of Trade Nation's Influencer program and receive a monthly fee for using their TradingView charts in my analysis.
———————————
WISH YOU ALL LUCK

NZDCAD Will Explode! BUY!
My dear friends,
Please, find my technical outlook for NZDCAD below:
The price is coiling around a solid key level - 0.8037
Bias - Bullish
Technical Indicators: Pivot Points High anticipates a potential price reversal.
Super trend shows a clear buy, giving a perfect indicators' convergence.
Goal - 0.8048
Safe Stop Loss - 0.8031
About Used Indicators:
The pivot point itself is simply the average of the high, low and closing prices from the previous trading day.
Disclosure: I am part of Trade Nation's Influencer program and receive a monthly fee for using their TradingView charts in my analysis.
———————————
WISH YOU ALL LUCK

AIA - BOTTOM IN?Bottom can be in on NASDAQ:AIA ; I'm taking my chance here around 1.150$ ✅📈
If we fall more, then —> 1.00 - 0.980🎯
Volatile & likely manipulated asset.
High risk reward setup, #DYOR.

C'mon Do something! -BTCC’mon… do something! 😤
This sideways phase = pure laziness.
So, 100k test incoming or not? 🧐
#Bitcoin

EURUSD The Target Is UP! BUY!
My dear subscribers,
My technical analysis for EURUSD is below:
The price is coiling around a solid key level - 1.1581
Bias - Bullish
Technical Indicators: Pivot Points Low anticipates a potential price reversal.
Super trend shows a clear buy, giving a perfect indicators' convergence.
Goal - 1.1630
About Used Indicators:
By the very nature of the supertrend indicator, it offers firm support and resistance levels for traders to enter and exit trades. Additionally, it also provides signals for setting stop losses
Disclosure: I am part of Trade Nation's Influencer program and receive a monthly fee for using their TradingView charts in my analysis.
———————————
WISH YOU ALL LUCK

USDCAD My Opinion! SELL!
My dear friends,
My technical analysis for USDCAD is below:
The market is trading on 1.4027 pivot level.
Bias - Bearish
Technical Indicators: Both Super Trend & Pivot HL indicate a highly probable Bearish continuation.
Target - 1.4012
Recommended Stop Loss - 1.4037
About Used Indicators:
A pivot point is a technical analysis indicator, or calculations, used to determine the overall trend of the market over different time frames.
Disclosure: I am part of Trade Nation's Influencer program and receive a monthly fee for using their TradingView charts in my analysis.
———————————
WISH YOU ALL LUCK

SILVER Is Bearish! Short!
Please, check our technical outlook for SILVER.
Time Frame: 1D
Current Trend: Bearish
Sentiment: Overbought (based on 7-period RSI)
Forecast: Bearish
The market is trading around a solid horizontal structure 4,794.2.
The above observations make me that the market will inevitably achieve 4,123.0 level.
P.S
The term oversold refers to a condition where an asset has traded lower in price and has the potential for a price bounce.
Overbought refers to market scenarios where the instrument is traded considerably higher than its fair value. Overvaluation is caused by market sentiments when there is positive news.
Like and subscribe and comment my ideas if you enjoy them!

EURUSD Is Very Bearish! Sell!
Here is our detailed technical review for EURUSD.
Time Frame: 2h
Current Trend: Bearish
Sentiment: Overbought (based on 7-period RSI)
Forecast: Bearish
The market is testing a major horizontal structure 1.158.
Taking into consideration the structure & trend analysis, I believe that the market will reach 1.154 level soon.
P.S
We determine oversold/overbought condition with RSI indicator.
When it drops below 30 - the market is considered to be oversold.
When it bounces above 70 - the market is considered to be overbought.
Like and subscribe and comment my ideas if you enjoy them!

USDJPY Is Going Up! Buy!
Take a look at our analysis for USDJPY.
Time Frame: 1D
Current Trend: Bullish
Sentiment: Oversold (based on 7-period RSI)
Forecast: Bullish
The market is approaching a key horizontal level 151.763.
Considering the today's price action, probabilities will be high to see a movement to 154.639.
P.S
Overbought describes a period of time where there has been a significant and consistent upward move in price over a period of time without much pullback.
Like and subscribe and comment my ideas if you enjoy them!

NZDJPY Will Go Up! Long!
Please, check our technical outlook for NZDJPY.
Time Frame: 4h
Current Trend: Bullish
Sentiment: Oversold (based on 7-period RSI)
Forecast: Bullish
The market is approaching a significant support area 86.230.
The underlined horizontal cluster clearly indicates a highly probable bullish movement with target 87.213 level.
P.S
Please, note that an oversold/overbought condition can last for a long time, and therefore being oversold/overbought doesn't mean a price rally will come soon, or at all.
Like and subscribe and comment my ideas if you enjoy them!

USDCHF Is Going Up! Long!
Here is our detailed technical review for USDCHF.
Time Frame: 1h
Current Trend: Bullish
Sentiment: Oversold (based on 7-period RSI)
Forecast: Bullish
The market is on a crucial zone of demand 0.793.
The oversold market condition in a combination with key structure gives us a relatively strong bullish signal with goal 0.796 level.
P.S
Overbought describes a period of time where there has been a significant and consistent upward move in price over a period of time without much pullback.
Like and subscribe and comment my ideas if you enjoy them!

USOIL BEARISH BIAS RIGHT NOW| SHORT
USOIL SIGNAL
Trade Direction: short
Entry Level: 58.02
Target Level: 57.01
Stop Loss: 58.69
RISK PROFILE
Risk level: medium
Suggested risk: 1%
Timeframe: 2h
Disclosure: I am part of Trade Nation's Influencer program and receive a monthly fee for using their TradingView charts in my analysis.
✅LIKE AND COMMENT MY IDEAS✅

CAD/CHF BEST PLACE TO SELL FROM|SHORT
CAD/CHF SIGNAL
Trade Direction: short
Entry Level: 0.568
Target Level: 0.564
Stop Loss: 0.570
RISK PROFILE
Risk level: medium
Suggested risk: 1%
Timeframe: 5h
Disclosure: I am part of Trade Nation's Influencer program and receive a monthly fee for using their TradingView charts in my analysis.
✅LIKE AND COMMENT MY IDEAS✅
