Quantum's KWEB Trading Guide 4/13/25Analysis:
Post-Close Options Activity (April 11):
Data: System reports 469.32K contracts traded on April 11, with puts at 10.99% (calls ~89%). High call volume at $31/$32 strikes suggests bullish bets.
Interpretation: Call-heavy flow indicates retail/institutional optimism, likely targeting a sweep above $31.35 (weekly high). Potential for a liquidity sweep trapping longs, aligning with ICT/SMT reversal.
RSI (14) Level and Trend:
Estimate: Daily RSI ~55 (neutral-bullish), based on April 11 close ($30.52, +2.97% from $29.62). Uptrend from April 8 low ($27.95) but below March 17 peak ($38.401) avoids overbought.
Interpretation: RSI supports bullish setups (above 50), with room for upside before resistance (~70). A sweep to $31.50 could push RSI higher, signaling OTE retracement.
Anonymized X Post Insights (April 11–13):
Summary: Posts highlight Chinese tech optimism (e.g., DeepSeek AI, consumer spending), tempered by tariff fears (Trump’s 125% threats). Some speculate on KWEB breaking $31, others note volatility risks.
Interpretation: Mixed sentiment leans bullish, with chatter about AI and stimulus driving buy-side interest. Tariff uncertainty suggests potential sell-side sweeps if news escalates.
Potential Reversals/Catalysts:
Liquidity Sweeps: Call-heavy options and X speculation point to a buy-side sweep above $31.35 (W-High), trapping retail longs before an OTE reversal to $30.00 (HVN).
Institutional Positioning: High call OI suggests dealers hedging bullish bets, but tariff risks could trigger smart money to fade retail.
Catalysts: Retail Sales (April 15) or tariff relief news could spike KWEB, while escalation could drive sell-side volatility.
Why: Sentiment aligns with ICT/SMT, where bullish retail chatter sets up sweeps, and smart money reverses at OTE. Neutral-bullish RSI and call volume support a setup.
Action: Log sentiment as neutral-bullish, expect sweep above $31 or drop to $29 on tariff news. Highlight for video: “KWEB’s call-heavy buzz could trap retail—watch for a smart money reversal.”
Tariff Impact
Assessment: Severe
Exposure:
KWEB’s holdings (e.g., PDD, JD.com, Tencent) rely on China’s internet economy, with significant supply chain and consumer exposure to U.S.-China trade. Tariffs (e.g., 125% proposed) raise costs for e-commerce and tech exports, hurting revenues.
Example: PDD (Temu) faces U.S. import duties, squeezing margins; JD.com’s logistics chain is tariff-sensitive.
Current Policy (April 13):
Context: Trump’s April 10 statement escalates tariffs to 125% on Chinese goods, with no relief confirmed by April 13. Web reports (Reuters, April 4) note market volatility from tariff fears, impacting KWEB’s April 8 low ($27.95).
Impact: Severe, as KWEB’s ETF structure amplifies holdings’ tariff pain (e.g., Alibaba, Tencent ADRs). Sentiment sours on escalation, driving sell-side sweeps.
Tariff Relief Potential:
Scenario: A 90-day pause or negotiation (rumored on X, inconclusive) could lift KWEB +3–5% ($31.50–$32.00), as seen in past relief rallies (e.g., February 2025, +1.6% on pause news).
Fundamentals: Relief boosts consumer spending on KWEB’s holdings, supporting bullish MSS. Without relief, bearish pressure persists.
AMT Tie-In: Tariff news creates imbalances (LVN breaks), with price seeking HVNs (e.g., $30.00) post-volatility.
Why: Severe tariff exposure makes KWEB sensitive to trade news, fueling sweeps (buy-side on relief, sell-side on escalation), per ICT/SMT.
Action: Rate tariff impact severe, monitor April 14 for negotiation updates. Video: “Tariffs could sink KWEB, but relief might spark a sweep to $32—stay sharp.”
News/Catalysts
Current (April 11, 2025)
Closing Price:
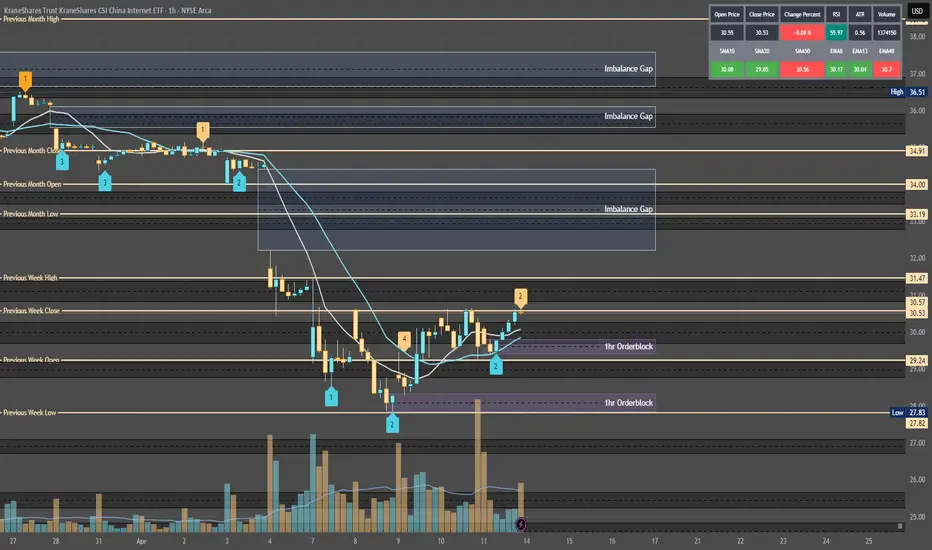
System Data: KWEB closed at $30.52 (currentPrice), +2.97% from prevDayClose ($29.62).
Verification: Matches April 11 high ($30.63), low ($29.41), open ($30.12).
Drivers:
Positive: Call-heavy options (89% calls) and AI buzz (DeepSeek, X posts) drove the rally. Web reports note Chinese tech resilience despite tariffs.
Negative: Tariff fears capped gains, with X posts citing Trump’s 125% threat as a drag.
Sector Trends: China ETFs rose (e.g., MCHI +2.1%, April 11), supporting KWEB’s move.
Why: Options flow and AI speculation fueled bullish momentum, but tariffs restrained breakout above $31.
Action: Highlight $30.52 close, +2.97%, driven by calls and AI. Video: “KWEB jumped 3% on AI hype, but tariffs loom large.”
Upcoming (Week of April 14–18)
Events:
April 15, Retail Sales (8:30 AM): Measures U.S. consumer spending, impacting KWEB’s e-commerce holdings (PDD, JD.com).
April 16–18, Tariff Talks: Potential U.S.-China negotiations, per X chatter (inconclusive).
Ongoing, China Stimulus: Rumored fiscal measures could lift Chinese tech, no date confirmed.
Predictions:
Bullish (+3%, ~$31.50): Strong Retail Sales (+0.5% MoM) or stimulus news boosts e-commerce, sweeping buy-side liquidity ($31.35).
Bearish (-3%, ~$29.50): Weak Retail Sales (-0.2% MoM) or tariff escalation triggers sell-side sweep ($29.41).
Neutral (±1%, $30.20–$30.80): Mixed data or no tariff news keeps KWEB near $30.00 (HVN).
Why: Catalysts drive displacement (sweeps to OHLC/LVNs), setting up OTE entries, per AMT/ICT.
Action: Set alerts for Retail Sales (April 15), monitor X for tariff updates. Video: “Retail Sales could push KWEB to $32 or drop it to $29—big week ahead.”
Technical Setup
Multi-Timeframe Analysis (Adjusted to April 11 Close, $30.52)
Weekly Chart
HVN (High Volume Node):
Level: $30.00 (POC, near W-Open $29.59, D-Close $30.52).
Role: Support, price consolidated March 24–April 11 ($29–$31).
Stance: Bullish (price above HVN, defending $30.00).
LVN (Low Volume Node):
Level: $31.50 (near W-High $31.35, April 4).
Role: Fast-move zone, price dropped post-$31.35 (April 4–8).
Stance: Neutral (price below LVN, potential sweep target).
EMA Trend:
Status: 8-week ($31.50) < 13-week ($32.00) < 48-week ($33.50), downtrend but flattening.
Stance: Neutral (price below EMAs, but $30.52 tests 8-week).
RSI (14):
Level: ~55 (neutral-bullish, up from 45 at $27.95, April 8).
Stance: Bullish (>50, room to 70).
MACD:
Status: Above signal, nearing zero (bullish crossover April 10).
Stance: Bullish (gaining momentum).
Bollinger Bands:
Status: Price at midline ($30.50), bands narrowing.
Stance: Neutral (breakout pending).
Donchian Channels:
Status: Above midline ($29.65, W-Low to W-High).
Stance: Bullish (breakout potential).
Williams %R:
Level: ~-40 (neutral, not overbought).
Stance: Bullish (>-50, rising).
ADR (Average Daily Range):
Status: Expanding (~3%, $0.90/day).
Stance: Bullish (volatility supports moves).
VWAP:
Status: Above VWAP (~$30.20, April 11).
Stance: Bullish (buyers control).
ICT/SMC:
MSS: Bearish (lower highs from $38.401, March 17, but higher low $27.95, April 8, signals potential shift).
Trend: Neutral (consolidation $29–$31, testing W-High $31.35).
Summary: Neutral-bullish, price at HVN ($30.00) with LVN ($31.50) as sweep target. Indicators favor upside, but MSS needs confirmation.
1-Hour Chart
Support/Resistance:
Support: $29.41 (D-Low, April 11), aligns with W-Open ($29.59), HVN ($30.00).
Resistance: $30.63 (D-High, April 11), near LVN ($31.50), W-High ($31.35).
Stance: Bullish (price above support, testing resistance).
RSI (14):
Level: ~60 (bullish, rising from 50 at $29.41).
Stance: Bullish (>50, not overbought).
MACD:
Status: Above signal, positive histogram.
Stance: Bullish (momentum building).
Bollinger Bands:
Status: Price near upper band ($30.60).
Stance: Bullish (breakout potential).
Donchian Channels:
Status: Above midline ($30.02).
Stance: Bullish (trend strength).
Williams %R:
Level: ~-30 (bullish, not overbought).
Stance: Bullish (>-50).
VWAP:
Status: Above VWAP (~$30.30, intraday April 11).
Stance: Bullish (buyers dominate).
ICT/SMC:
Buy-Side Liquidity: Above $30.63 (D-High), $31.35 (W-High), LVN ($31.50). Retail stops cluster here.
Sell-Side Liquidity: Below $29.41 (D-Low), $27.95 (W-Low/M-Low).
OB: Bullish OB at $29.80–$30.00 (April 10 consolidation, demand zone, near HVN $30.00).
FVG: Bullish FVG at $30.00–$30.20 (April 11 gap, unfilled, aligns with D-Open $30.12).
OTE: Fib 61.8%–78.6% from $29.41 (low) to $30.63 (high) = $30.05–$30.15 (overlaps OB/FVG/HVN).
Displacement: Potential impulsive move to $31.50 (LVN) or $29.00 (below D-Low) on Retail Sales or tariff news.
Summary: Bullish bias, with OTE ($30.05–$30.15) as entry zone post-sweep, supported by OB/FVG/HVN.
10-Minute Chart
Closing Move (April 11):
Status: Rallied to $30.52, closed near high ($30.63), strong volume.
Stance: Bullish (buyers pushed close).
EMA Direction:
Status: 8-EMA ($30.45) > 13-EMA ($30.40) > 48-EMA ($30.30), uptrend.
Stance: Bullish (EMAs rising).
RSI (14):
Level: ~65 (bullish, cooling from 70).
Stance: Bullish (>50, not overbought).
MACD:
Status: Above zero, bullish crossover.
Stance: Bullish (momentum intact).
VWAP:
Status: Above VWAP (~$30.40, late April 11).
Stance: Bullish (buyers control).
ICT/SMC:
Liquidity Sweep: Wick to $30.63 (8:50 AM, April 11) tested buy-side, no clear rejection yet.
Retracement: Potential retrace to $30.05–$30.15 (OTE) if sweep completes (e.g., April 14, 8:00 AM).
Entry Signal: Pin bar or engulfing at OTE (e.g., $30.10, 10-minute candle).
Summary: Bullish, awaiting sweep above $30.63 or $31.35, retrace to OTE for entry.
Options Data
Analysis:
GEX (Gamma Exposure):
Status: Positive GEX at $31 strike (high call OI), neutral at $30.
Impact: Dealers buy stock to hedge calls, supporting $31 pin or slight lift to $31.50.
Explanation: Positive GEX stabilizes price near high OI strikes, aligning with LVN ($31.50) sweep.
Stance: Neutral-bullish (pinning likely, breakout possible).
DEX (Delta Exposure):
Status: High call delta (+0.3, 89% call volume).
Impact: Bullish pressure, as dealers hedge calls by buying KWEB.
Explanation: Call-heavy delta fuels upside momentum, supporting buy-side sweep.
Stance: Bullish.
IV (Implied Volatility):
Status: Moderate (~25%, vs. 20–35% norm for KWEB).
Impact: Steady swings ($0.50–$1.00/day), good for ATM/OTM calls.
Explanation: Moderate IV balances premium cost and volatility, ideal for OTE entries.
Stance: Bullish (volatility supports options).
OI (Open Interest):
Status: Call-heavy (65% calls at $31, 20% at $32, 15% puts at $30).
Impact: Momentum toward $31–$32, potential pin at $31 (high OI).
Explanation: High call OI marks targets (W-High $31.35, LVN $31.50), puts at $30 guard HVN.
Stance: Bullish (calls drive upside).
Cem Karsan’s Application and Weekly Trading Breakdown:
Gamma: High at $31 (pinning risk), low at $32 (breakout potential).
Vanna: Rising IV (25% to 30% on Retail Sales) lifts calls, dealers buy KWEB, pushing to $31.50.
Charm: Near OPEX (April 18), $31 calls hold delta if ITM, spiking volatility April 17–18.
Volatility Skew: Call skew (higher IV for $32 vs. $30) favors upside breakouts.
Weekly OI (Exp. April 18): 65% calls at $31, 20% at $32. Pinning likely at $31 unless Retail Sales sparks breakout to $32.
Options Strategy:
Trade: Buy $31 calls at OTE ($30.10, April 14, 8:50 AM), premium ~$0.50.
Exit: $31.50 (W-High/LVN, premium ~$0.90), profit $0.40.
Stop: Below OB ($29.80, premium ~$0.20), risk $0.30.
R:R: 1.33:1 (adjust to 2:1 with partial exit).
ICT/SMC Tie-In: Enter post-sweep ($31.35), retrace to OTE ($30.10), target $31.50.
Vanna:
Status: IV rise (25% to 30%) amplifies calls, dealers buy KWEB.
Impact: Bullish lift to $31–$31.50, aligns with LVN sweep.
Explanation: Vanna boosts delta near high OI, supporting OTE reversal.
Charm:
Status: OPEX (April 18) nears, $31 calls gain delta if KWEB hits $31.
Impact: Volatility spikes April 17–18, favors quick OTE trades.
Explanation: Charm accelerates delta, amplifying sweep-to-OTE moves.
Timeframe Analysis:
Weekly (Exp. April 18):
OI: 65% calls ($31), 20% ($32), 15% puts ($30).
IV: Moderate (25%), rising on catalysts.
Stance: Bullish (calls dominate, breakout risk).
Monthly (Exp. May 2):
OI: Balanced (50% calls $32, 50% puts $29).
IV: Stable (~24%).
Stance: Neutral (consolidation likely).
3-Month (Exp. July 7):
OI: Call skew ($33–$35, 60% calls).
IV: Low (~22%).
Stance: Bullish (long-term upside).
Directional Bias:
Synthesis: Positive GEX ($31 pin), high call DEX (+0.3), moderate IV (25%), call-heavy OI (65% at $31), vanna (IV lift), charm (OPEX volatility), and ICT/SMC (buy-side sweep to $31.35, OTE at $30.10) suggest a bullish trend for April 14, with potential retracement post-sweep.
Why: Options data aligns with ICT/SMT (call OI = buy-side liquidity, OTE = dealer hedging zone), per AMT (LVN sweep, HVN reversal).
Action: Focus on $31 calls, highlight pinning vs. breakout. Video: “KWEB’s $31 call wall could pin or pop—perfect for an OTE play.”
Sympathy Plays
Correlated Assets:
MCHI (iShares MSCI China ETF): Tracks broader Chinese equities, rises ~2–3% if KWEB rallies (e.g., $31.50), due to shared holdings (Alibaba, Tencent).
BABA (Alibaba ADR): KWEB’s top holding, moves +3–4% on KWEB’s sweep to $31.35, driven by e-commerce/AI overlap.
Opposite Mover:
GLD (SPDR Gold ETF): Risk-off asset, fades ~1–2% if KWEB rallies (risk-on), as investors shift from safe havens to tech.
Why: Sympathy plays confirm sector momentum (Chinese tech), while GLD hedges tariff fears, per ICT/SMT sentiment.
Action: Monitor MCHI/BABA for confirmation, GLD for divergence. Video: “If KWEB pops, MCHI and BABA follow—watch gold for the flip side.”
Sector Positioning with RRG
Sector: Technology – Emerging Markets (China Internet).
RRG Position: Improving (vs. MCHI ETF).
Rationale: KWEB’s April 11 rally (+2.97%) outpaces MCHI (+2.1%), with RSI (~55) and call OI signaling strength. Tariff fears weaken absolute gains, but relative momentum grows.
Tie-In: Improving quadrant supports bullish MSS, OTE entries at HVN ($30.00).
Why: RRG aligns with sentiment (call-heavy) and technicals (above HVN), per AMT value area.
Action: Highlight Improving RRG for video: “KWEB’s gaining steam in China tech—prime for a sweep setup.”
Targets
Bullish:
Target: +3.5% to $31.60.
Levels: W-High ($31.35), LVN ($31.50), next resistance ($32.00).
Rationale: Buy-side sweep to $31.35 (W-High), breakout to LVN on Retail Sales or tariff relief, per ICT/SMC.
Bearish:
Target: -3.2% to $29.55.
Levels: D-Low ($29.41), below W-Open ($29.59), HVN ($29.50).
Rationale: Sell-side sweep below $29.41 on weak Retail Sales or tariff escalation, retracing to HVN, per AMT.
Why: Targets tie to OHLC (W-High, D-Low), HVNs/LVNs, and catalysts, ensuring ICT/SMC alignment (liquidity to OTE).
Trading
ETHUSD: Bears Are Winning! Short!
My dear friends,
Today we will analyse ETHUSD together☺️
The price is near a wide key level
and the pair is approaching a significant decision level of 1.582.3 Therefore, a strong bearish reaction here could determine the next move down.We will watch for a confirmation candle, and then target the next key level of 1.551.4..Recommend Stop-loss is beyond the current level.
❤️Sending you lots of Love and Hugs❤️

BTCUSD: Will Go Up! Long!
My dear friends,
Today we will analyse BTCUSD together☺️
The recent price action suggests a shift in mid-term momentum. A break above the current local range around 83,753.33 will confirm the new direction upwards with the target being the next key level of 85,164.89 and a reconvened placement of a stop-loss beyond the range.
❤️Sending you lots of Love and Hugs❤️

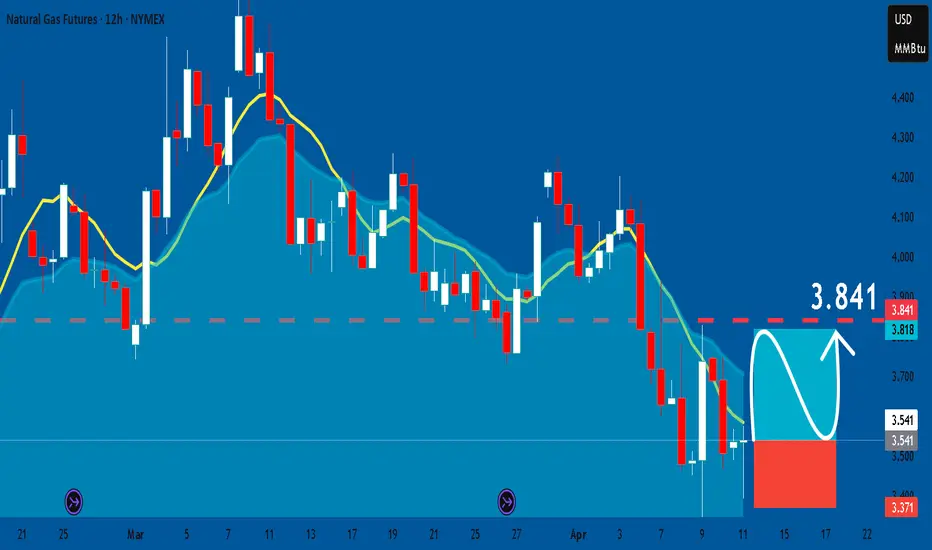
NATGAS: Long Trade Explained
NATGAS
- Classic bullish formation
- Our team expects pullback
SUGGESTED TRADE:
Swing Trade
Long NATGAS
Entry - 3.541
Sl - 3.371
Tp - 3.841
Our Risk - 1%
Start protection of your profits from lower levels
Disclosure: I am part of Trade Nation's Influencer program and receive a monthly fee for using their TradingView charts in my analysis.
❤️ Please, support our work with like & comment! ❤️
Trading opportunity for SUIUSDTBased on technical factors there is a Sell position in :
📊 SUIUSDT
🔴 Sell Now
🪫Stop loss 2.8700
🔋Target 1.1100
📏 R/R 2
💸RISK : 1%
We hope it is profitable for you ❤️
Please support our activity with your likes👍 and comments📝

CADJPY Sellers In Panic! BUY!
My dear friends,
CADJPY looks like it will make a good move, and here are the details:
The market is trading on 103.54 pivot level.
Bias - Bullish
Technical Indicators: Supper Trend generates a clear long signal while Pivot Point HL is currently determining the overall Bullish trend of the market.
Goal - 104.58
Recommended Stop Loss - 102.96
About Used Indicators:
Pivot points are a great way to identify areas of support and resistance, but they work best when combined with other kinds of technical analysis
Disclosure: I am part of Trade Nation's Influencer program and receive a monthly fee for using their TradingView charts in my analysis.
———————————
WISH YOU ALL LUCK

EURUSD Trading Opportunity! SELL!
My dear followers,
I analysed this chart on EURUSD and concluded the following:
The market is trading on 1.1042 pivot level.
Bias - Bearish
Technical Indicators: Both Super Trend & Pivot HL indicate a highly probable Bearish continuation.
Target - 1.1006
About Used Indicators:
A super-trend indicator is plotted on either above or below the closing price to signal a buy or sell. The indicator changes color, based on whether or not you should be buying. If the super-trend indicator moves below the closing price, the indicator turns green, and it signals an entry point or points to buy.
Disclosure: I am part of Trade Nation's Influencer program and receive a monthly fee for using their TradingView charts in my analysis.
———————————
WISH YOU ALL LUCK

EURUSD Will Collapse! SELL!
My dear friends,
My technical analysis for EURUSD is below:
The market is trading on 1.1358 pivot level.
Bias - Bearish
Technical Indicators: Both Super Trend & Pivot HL indicate a highly probable Bearish continuation.
Target - 1.1204
Recommended Stop Loss - 1.1454
About Used Indicators:
A pivot point is a technical analysis indicator, or calculations, used to determine the overall trend of the market over different time frames.
Disclosure: I am part of Trade Nation's Influencer program and receive a monthly fee for using their TradingView charts in my analysis.
———————————
WISH YOU ALL LUCK

Trading opportunity for AVAXUSDTBased on technical factors there is a Sell position in :
📊 AVAXUSDT
🔴 Sell Now
🪫Stop loss 22.50
🔋Target 14.50
📏 R/R 2
💸RISK : 1%
We hope it is profitable for you ❤️
Please support our activity with your likes👍 and comments📝

GBPUSD What Next? SELL!
My dear followers,
I analysed this chart on GBPUSD and concluded the following:
The market is trading on 1.3089 pivot level.
Bias - Bearish
Technical Indicators: Both Super Trend & Pivot HL indicate a highly probable Bearish continuation.
Target - 1.2979
About Used Indicators:
A super-trend indicator is plotted on either above or below the closing price to signal a buy or sell. The indicator changes color, based on whether or not you should be buying. If the super-trend indicator moves below the closing price, the indicator turns green, and it signals an entry point or points to buy.
Disclosure: I am part of Trade Nation's Influencer program and receive a monthly fee for using their TradingView charts in my analysis.
———————————
WISH YOU ALL LUCK

Trading opportunity for BTCUSDTBased on technical factors there is a Sell position in :
📊 BTCUSDT
🔴 Sell Now
🪫Stop loss 91000.00
🔋Target 75000.00
📏 R/R 1,5
💸RISK : 1%
We hope it is profitable for you ❤️
Please support our activity with your likes👍 and comments📝

XAUUSD. Weekly trading levels 14 - 18.04.2025During the week you can trade from these price levels. Finding the entry point into a transaction and its support is up to you, depending on your trading style and the development of the situation. Zones show preferred price ranges WHERE to look for an entry point into a trade.
If you expect any medium-term price movements, then most likely they will start from one of the zones.
Levels are valid for a week, the date is in the title. Next week I will adjust the levels based on new data and publish a new post.
! Please note that brokers have a difference in quotes, take this into account when trading.
The history of level development can be seen in my previous posts. They cannot be edited or deleted. Everything is fair. :)
----------------------------------------------
I don’t play guess the direction (that’s why there are no directional arrows), but zones (levels) are used for trading. We wait for the zone to approach, watch the reaction, and enter the trade.
Levels are drawn based on volumes and data from the CME. They are used as areas of interest for trading. Traded as classic support/resistance levels. We see the reaction to the rebound, we trade the rebound. We see a breakout and continue to trade on a rollback to the level. The worst option is if we revolve around the zone in a flat.
Do not reverse the market at every level; if there is a trend movement, consider it as an opportunity to continue the movement. Until the price has drawn a reversal pattern.
More information in my RU profile.
Don't forget to like Rocket and Subscribe!!! Feedback is very important to me!

EURUSD. Weekly trading levels 14 - 18.04.2025During the week you can trade from these price levels. Finding the entry point into a transaction and its support is up to you, depending on your trading style and the development of the situation. Zones show preferred price ranges WHERE to look for an entry point into a trade.
If you expect any medium-term price movements, then most likely they will start from one of the zones.
Levels are valid for a week, the date is in the title. Next week I will adjust the levels based on new data and publish a new post.
! Please note that brokers have a difference in quotes, take this into account when trading.
The history of level development can be seen in my previous posts. They cannot be edited or deleted. Everything is fair. :)
----------------------------------------------
I don’t play guess the direction (that’s why there are no directional arrows), but zones (levels) are used for trading. We wait for the zone to approach, watch the reaction, and enter the trade.
Levels are drawn based on volumes and data from the CME. They are used as areas of interest for trading. Traded as classic support/resistance levels. We see the reaction to the rebound, we trade the rebound. We see a breakout and continue to trade on a rollback to the level. The worst option is if we revolve around the zone in a flat.
Do not reverse the market at every level; if there is a trend movement, consider it as an opportunity to continue the movement. Until the price has drawn a reversal pattern.
More information in my RU profile.
Don't forget to like Rocket and Subscribe!!! Feedback is very important to me!

Trading Week 15 Review 2025Hello fellow traders , my regular and new friends!
How was your trading this week?
Did you get a killing on the SNP, EURUSD etc?
This part will be on the review for this week.
Moving forward I will separate both the Trade review and Coming week trade analysis for easy viewing!
-- Get the right tools and an experienced Guide, you WILL navigate your way out of this "Dangerous Jungle"! --
*********************************************************************
Disclaimers:
The analysis shared through this channel are purely for educational and entertainment purposes only. They are by no means professional advice for individual/s to enter trades for investment or trading purposes.
*********************************************************************

DXY Will Fall! Short!
Here is our detailed technical review for DXY.
Time Frame: 1D
Current Trend: Bearish
Sentiment: Overbought (based on 7-period RSI)
Forecast: Bearish
The market is trading around a solid horizontal structure 99.769.
The above observations make me that the market will inevitably achieve 96.117 level.
P.S
Please, note that an oversold/overbought condition can last for a long time, and therefore being oversold/overbought doesn't mean a price rally will come soon, or at all.
Disclosure: I am part of Trade Nation's Influencer program and receive a monthly fee for using their TradingView charts in my analysis.
Like and subscribe and comment my ideas if you enjoy them!

USOIL BULLISH BIAS RIGHT NOW| LONG
USOIL SIGNAL
Trade Direction: long
Entry Level: 61.45
Target Level: 73.89
Stop Loss: 53.11
RISK PROFILE
Risk level: medium
Suggested risk: 1%
Timeframe: 1D
Disclosure: I am part of Trade Nation's Influencer program and receive a monthly fee for using their TradingView charts in my analysis.
✅LIKE AND COMMENT MY IDEAS✅

GBP/USD BEST PLACE TO SELL FROM|SHORT
Hello, Friends!
The BB upper band is nearby so GBP/USD is in the overbought territory. Thus, despite the uptrend on the 1W timeframe I think that we will see a bearish reaction from the resistance line above and a move down towards the target at around 1.287.
Disclosure: I am part of Trade Nation's Influencer program and receive a monthly fee for using their TradingView charts in my analysis.
✅LIKE AND COMMENT MY IDEAS✅

NIFTY Strategy May Be 99% Wrong - Trade with Extreme Caution!📈 Hourly Chart Technical Analysis
🔸 RSI Cooling Off:
The RSI recently reversed from a scorching 88 on the hourly chart, signaling overbought conditions 🚨. This hints at a possible short-term pullback before the bulls decide their next move 🐂⏳.
🔸 🚧 Resistance Ahead:
📍 23,350 is the key level to watch – it’s a strong resistance zone that’s been tough to crack in the past. A breakout here could light up the index! 💥📊
🔸 🛡️ Support Zones:
📉 22,800 is holding firm as immediate support, backed by solid open interest data – a level the bulls will want to protect.
Nifty Trading Plan Could Miss the Mark – Risk Level: 99%
⚠️ Strategy for Monday – April 14
✅ Above 23,000:
🚀 Bullish bias – Eyes on a move up to 23,350. Consider buying only on strong breakout confirmation. Momentum is key! 🔍📈
🟡 Between 23,000 and 22,800:
🎯 Expect sideways action – a choppy range where scalpers might thrive. Trade light and keep those stop losses tight! 🪙⚖️
🔻 Below 22,800:
🐻 A bearish signal – this opens the door for a drop toward 22,555. Consider short positions only with strict risk control 🎯🛑

Trading opportunity for FETUSDTBased on technical factors there is a Sell position in :
📊 FETUSDT
🔴 Sell Now
🪫Stop loss 0.540
🔋Target 0.350
📏 R/R 2,3
💸RISK : 1%
We hope it is profitable for you ❤️
Please support our activity with your likes👍 and comments📝

EUR_JPY SHORT FROM SUPPLY LEVEL|
✅EUR_JPY is set to retest a
Strong resistance level above
After trading in a local uptrend for some time
Which makes a bearish pullback a likely scenario
With the target being a local support below
SHORT🔥
✅Like and subscribe to never miss a new idea!✅
Disclosure: I am part of Trade Nation's Influencer program and receive a monthly fee for using their TradingView charts in my analysis.

EUR_CHF SUPPORT AHEAD|LONG|
✅EUR_CHF is about to retest a key structure level of 0.9204
Which implies a high likelihood of a move up
As some market participants will be taking profit from short positions
While others will find this price level to be good for buying
So as usual we will have a chance to ride the wave of a bullish correction
LONG🚀
✅Like and subscribe to never miss a new idea!✅

EUR-USD Will Keep Growing! Buy!
Hello,Traders!
EUR-USD is trading in a
Strong uptrend and the pair
Made a strong bullish breakout
Of key horizontal level of 1.1245
Which is now a support and
As the breakout is confirmed
Which is only reinforces our
Bullish bias we will be
Expecting a further bullish
Move up towards the
Target of 1.1507
Buy!
Comment and subscribe to help us grow!
Check out other forecasts below too!
Disclosure: I am part of Trade Nation's Influencer program and receive a monthly fee for using their TradingView charts in my analysis.

USD-CAD Swing Long! Buy!
Hello,Traders!
USD-CAD fell sharply to
Retest a horizontal support
Level of 1.3855 and as it is
A strong horizontal demand
Are we will be expecting a
Bullish correction on Monday
Buy!
Comment and subscribe to help us grow!
Check out other forecasts below too!
Disclosure: I am part of Trade Nation's Influencer program and receive a monthly fee for using their TradingView charts in my analysis.
