Liberation, Altercation or Doom? ES Futures weekly planCME_MINI:ES1!
Quick Update
The upcoming week is poised to be critical for financial markets as President Donald Trump's so-called "Liberation Day" on April 2 approaches. On this date, the administration plans to implement new tariffs aimed at reducing the U.S. trade deficit by imposing reciprocal duties on imports from various countries.
As April 2 looms, the full impact of these tariffs remains uncertain, leaving markets and investors in a state of heightened anticipation.
We may get clarity on the tariff situation on April 2, 2025.
Universal tariff announcement of categories of imports may clarify US administration’s maximum tariff escalation approach.
A phased out and unclear tariff approach may keep markets in limbo.
Economic Calendar
Keep an eye on the data docket, NFP and other key releases are due this week.
Tuesday, Apri 1, 2025 : ISM Manufacturing PMI, JOLTS Job Openings
Wednesday April 2, 2025 : ADP Employment Change, Factory Orders MoM
Thursday April 3, 2025 : Balance of Trade, Imports, Exports, ISM Services PMI, Initial Jobless Claims
Friday, April 4, 2025 : Non-Farm Payrolls, Unemployment rate, Average Hourly Earnings MoM,Average Hourly Earnings YoY, Fed Chair Powell Speech
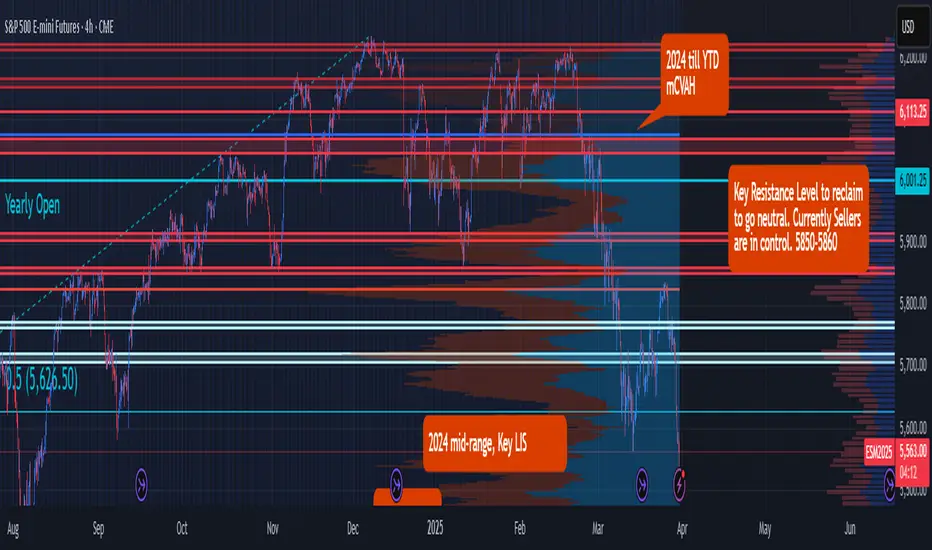
Key Levels to Watch:
Yearly Open 2025 : 6001.25
Key Resistance : 5850- 5860
LVN : 5770 -5760
Neutral Zone : 5705-5720
Key LIS Mid Range 2024 : 5626.50
2024-YTD mCVAL : 5381
2022 CVAH : 5349.75
August 5th, 2024 Low : 5306.75
Scenario 1: Bold but Strategic Tariffs (Effective Use of Tariff to reduce trade deficit and raise revenue) : In this scenario, we may see relief rally in ES futures, price reclaiming 2024 mid-range with a move higher towards key resistance level.
Scenario 2: Maximum pressure, maximum tariff (All out trade war) : In this scenario, we anticipate a sell-off with major support levels, such as 2024- YTD mCVAL, 2022 CVAH and August 5th, 2024 low as immediate downside targets.
Scenario 3: Further delays in Tariff policy (A negotiating tool, with looming uncertainty) : In this scenario, sellers remain in control and uncertainty persists, while we anticipate that rallies may be sold, market price action may remain choppy and range bound.
Tradingstrategy
Easy & Effective Multi-Timeframe Trading StrategyI show you how to use simple market structure to determine a bias, 18 period moving average to confirm trend on entry timeframe, and how to use the %R to time your entries into the market in alignment with the dominant momentum.

20323.3-20647.3 The key is whether it can rise above this level
Hello, traders.
If you "Follow", you can always get new information quickly.
Please also click "Boost".
Have a nice day today.
-------------------------------------
The April TradingView competition is sponsored by PEPPERSTONE.
Accordingly, we will look at the coins (tokens) and items that can be traded in the competition.
Let's talk about the NAS100 chart.
--------------------------------------
(NAS100 1M chart)
I think the stock market is fluctuating due to the rapidly changing situation and various economic issues.
Therefore, I think it is not easy to analyze index charts such as NAS100 and US30.
However, since the HA-High indicator of the current 1M chart is newly generated and is showing a downward trend, if it does not rise above 20647.3 when the competition starts, it is likely to eventually fall.
If it falls below the M-Signal indicator of the 1M chart, it is necessary to check for support near the Fibonacci ratio range of 0.5 (15898.2) ~ 0.618 (17130.8).
-
(1D chart)
The key is whether it can receive support near 19598.6, the HA-Low indicator point of the 1D chart, and rise above the M-Signal indicator of the 1W chart.
If not, it is expected that it will eventually meet the M-Signal indicator of the 1M chart and determine the trend again.
Currently, the price is being maintained above the M-Signal indicator of the 1M chart, so it is maintaining an upward trend in the medium to long term.
Therefore, when the competition starts, you should respond depending on whether the price is being maintained above or below the M-Signal indicator of the 1D chart.
Currently, the short-term support zone is 19269.9-19598.6, and the medium to long-term resistance zone is 20323.3-20647.3.
Even if it is supported and rises in the short-term support zone, if it fails to break through the medium to long-term resistance zone, it will eventually fall.
-
Thank you for reading to the end.
I hope you have a successful transaction.
--------------------------------------------------

69.374-70.880 section is a crossroads
Hello, traders.
If you "Follow", you can always get new information quickly.
Please also click "Boost".
Have a nice day today.
-------------------------------------
The April TradingView competition is sponsored by PEPPERSTONE.
Accordingly, we will look at the coins (tokens) and items that can be traded in the competition.
Let's talk about the SPOTCRUDE chart.
--------------------------------------
(SPOTCRUDE 1M chart)
We need to see whether it will rise along the trend line (1) or fall along the trend line (2).
Since the volume profile section is formed around 75.723, the key is whether it can rise above this section.
If it fails to rise, it will eventually meet the HA-Low indicator of the 1M chart.
Currently, the HA-Low indicator of the 1M chart is formed at 43.327.
-
(1D chart)
The M-Signal indicators of the 1D, 1W, and 1M charts are in reverse arrangement.
Therefore, in order to continue the upward trend, it must eventually rise above the M-Signal indicator of the 1M chart.
Therefore, the key is which direction it deviates from the 69.374-70.880 section.
When the competition started,
- If the price is maintained above 70.880, the long position is expected to be advantageous,
- If the price is maintained below 69.374, the short position is expected to be advantageous.
However, since the overall trend of the chart is down, a short and quick response is required when trading with a long position.
-
Thank you for reading to the end.
I hope you have a successful transaction.
--------------------------------------------------

The key is whether the price can be maintained above 3044.61
Hello, traders.
If you "Follow", you can always get new information quickly.
Please also click "Boost".
Have a nice day today.
-------------------------------------
The April TradingView competition is sponsored by PEPPERSTONE.
Accordingly, we will look at the coins (tokens) and items that can be traded in the competition.
I will tell you about the XAAUSD chart.
--------------------------------------
(XAAUSD 1D chart)
It is continuously updating the new high (ATH).
Accordingly, the key is whether the price can be maintained above 3044.61 and rise to around the Fibonacci ratio 1.414 (3102.84).
Therefore, if the price is maintained above 3044.61 when the competition starts, a long position is expected to be advantageous.
-
(30m chart)
The areas marked with circles correspond to support and resistance areas.
Among them, the important support and resistance areas are around 3044.61, 3019.81, and 2998.08.
-
Thank you for reading to the end.
I hope you have a successful trade.
--------------------------------------------------

The key is whether it can be supported and rise near 137.28
Hello, traders.
If you "Follow", you can always get new information quickly.
Please also click "Boost".
Have a nice day today.
-------------------------------------
The April TradingView competition is sponsored by PEPPERSTONE.
Accordingly, we will look at the coins (tokens) and items that can be traded in the competition.
Let's talk about the SOLUSD chart.
--------------------------------------
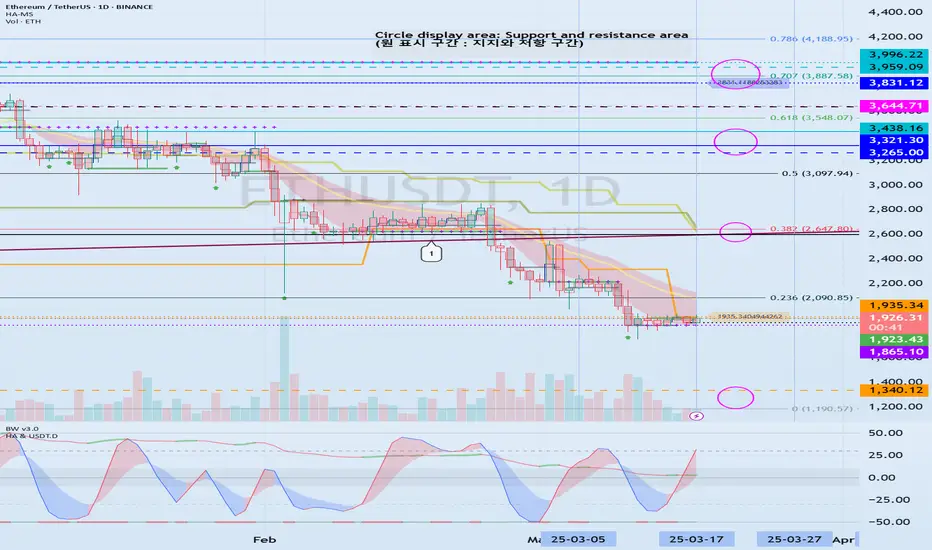
(ETHUSD 1D chart)
The circled sections on the chart are important support and resistance sections.
Since the M-Signal indicators on the 1D, 1W, and 1M charts are passing through the 137.28-180.38 range, it is important to see whether it can receive support and rise this time.
If it fails to rise, it is likely to fall to the Fibonacci ratio range of 2 (80.31) ~ 1.902 (88.47).
-
We need to see if the OBV can rise above the Fibonacci ratio of 1.27 (141.08) as it rises above the middle line.
Since the OBV indicator itself has fallen below the 0 point, there is a high possibility that the selling pressure will increase.
Therefore, we need to check the support and resistance points when the OBV rises above the 0 point.
If it shows support near 180.38, I think it is highly likely that it will turn into an upward trend and rise.
-
Therefore, when the competition starts, check if it is located in the 137.28-180.38 range, and if not, it is expected that a sell (SHORT) position will be advantageous.
Even if the price is maintained above 137.28,
- There is a possibility that it will be difficult to maintain a buy (LONG) position due to the fact that the OBV is located below the 0 point,
- The M-Signal indicator on the 1W, 1M charts is in a reverse arrangement, etc.
-
Thank you for reading to the end.
I hope you have a successful transaction.
--------------------------------------------------
- This is an explanation of the big picture.
I used TradingView's INDEX chart to check the entire range of BTC.
I rewrote it to update the previous chart while touching the Fibonacci ratio range of 1.902 (101875.70) ~ 2 (106275.10).
(Previous BTCUSD 12M chart)
Looking at the big picture, it seems to have been following a pattern since 2015.
In other words, it is a pattern that maintains a 3-year bull market and faces a 1-year bear market.
Accordingly, the bull market is expected to continue until 2025.
-
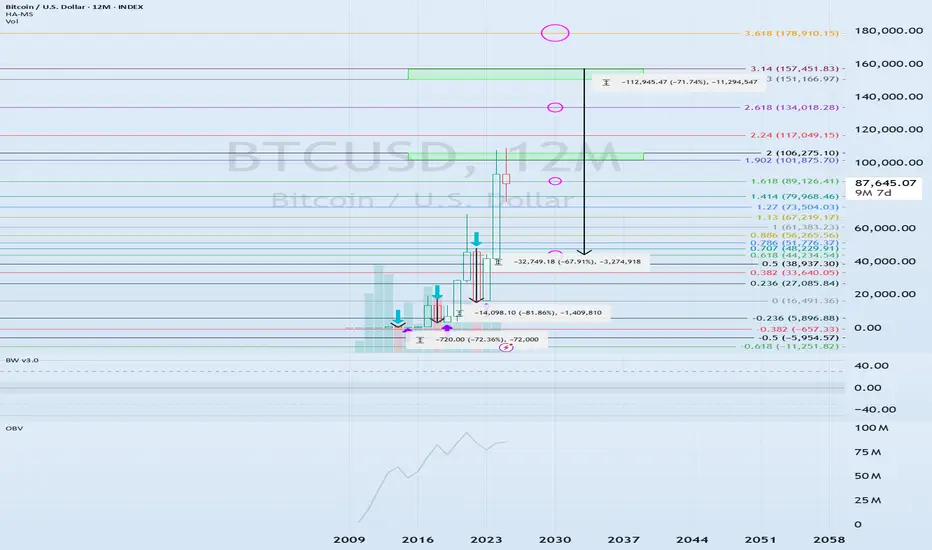
(Current BTCUSD 12M chart)
Based on the currently written Fibonacci ratio, it is displayed up to 3.618 (178910.15).
It is expected that it will not fall again below the Fibonacci ratio of 0.618 (44234.54).
(BTCUSDT 12M chart)
I think it is around 42283.58 when looking at the BTCUSDT chart.
-
I will explain it again with the BTCUSD chart.
The Fibonacci ratio ranges marked in the light green boxes, 1.902 (101875.70) ~ 2 (106275.10) and 3 (151166.97) ~ 3.14 (157451.83), are expected to be important support and resistance ranges.
In other words, it seems likely to act as a volume profile range.
Therefore, in order to break through this section upward, I think the point to watch is whether it can rise with support near the Fibonacci ratios of 1.618 (89126.41) and 2.618 (134018.28).
Therefore, the maximum rising section in 2025 is expected to be the 3 (151166.97) ~ 3.14 (157451.83) section.
To do that, we need to look at whether it can rise with support near 2.618 (134018.28).
If it falls after the bull market in 2025, we don't know how far it will fall, but considering the previous decline, we expect it to fall by about -60% to -70%.
So, if the decline starts near the Fibonacci ratio 3.14 (157451.83), it seems likely that it will fall to around Fibonacci 0.618 (44234.54).
I will explain more details when the downtrend starts.
------------------------------------------------------

The key is whether it can rise to 2271.0-2356.31
Hello, traders.
If you "Follow", you can always get new information quickly.
Please also click "Boost".
Have a nice day today.
-------------------------------------
The April TradingView competition is sponsored by PEPPERSTONE.
Accordingly, we will look at the coins (tokens) and items that can be traded in the competition.
I will talk about the ETHUSD chart.
--------------------------------------
(ETHUSD 1W)
If you look at the 1W chart, you can see how important the current price position is.
If it continues to decline this time, it is likely to fall to around 1337.54.
Therefore, the key is whether it can maintain the price by rising near the Fibonacci ratio of 0.236 (2089.91).
In order to turn upward on the 1W chart, it must rise near the Fibonacci ratio of 0.382 (2646.14) and maintain the price.
-
(1D chart)
Since the HA-Low indicator on the 1D chart is formed at the point of 1935.88, the key is whether it can receive support and rise near this area.
If it does not and falls below 1871.55, it is highly likely to fall to around 1626.95.
-
The M-Signal indicator on the 1W and 1M charts is passing near the Fibonacci ratio of 0.382 (2646.14).
Therefore, in order to turn into an uptrend, the price must rise above the M-Signal indicator on the 1W and 1M charts and be maintained.
To do so, we need to see if it can naturally rise above the M-Signal indicator on the 1W and 1M charts while maintaining the price by rising around 2271.0-2356.31.
However, in order to continue the uptrend, it is expected that the price must rise above the Fibonacci ratio of 0.382 (2646.14) and be maintained.
-
If the OBV does not rise above the upper line of the price channel and show an uptrend, it is likely that it will be difficult to sustain even if an uptrend appears.
The StochRSI indicator is showing a downward trend in the overbought zone.
Therefore, if the StochRSI indicator turns upward again and maintains the price around 1935.88, it is expected that it will lead to an attempt to rise to around 2271.0.
Therefore, when the competition started,
- If the StochRSI indicator did not turn upward,
- If the OBV did not rise above the upper line and showed an upward trend,
- If it did not receive support near 1935.88, it is expected that the SHORT position would be advantageous.
-
Thank you for reading to the end.
I hope you have a successful trade.
--------------------------------------------------
- Here is an explanation of the big picture.
I used TradingView's INDEX chart to check the entire range of BTC.
I rewrote the previous chart to update it while touching the Fibonacci ratio range of 1.902 (101875.70) ~ 2 (106275.10).
(Previous BTCUSD 12M chart)
Looking at the big picture, it seems that it has been maintaining an upward trend following a pattern since 2015.
That is, it is a pattern that maintains a 3-year bull market and faces a 1-year bear market.
Accordingly, the bull market is expected to continue until 2025.
-
(Current BTCUSD 12M chart)
Based on the currently written Fibonacci ratio, it is displayed up to 3.618 (178910.15).
It is expected that it will not fall again below the Fibonacci ratio of 0.618 (44234.54).
(BTCUSDT 12M chart)
Based on the BTCUSDT chart, I think it is around 42283.58.
-
I will explain it again with the BTCUSD chart.
The Fibonacci ratio ranges marked in the green boxes, 1.902 (101875.70) ~ 2 (106275.10) and 3 (151166.97) ~ 3.14 (157451.83), are expected to be important support and resistance ranges.
In other words, it seems likely that they will act as volume profile ranges.
Therefore, in order to break through these ranges upward, I think the point of interest is whether they can be supported and rise near the Fibonacci ratios of 1.618 (89126.41) and 2.618 (134018.28).
Therefore, the maximum rising range in 2025 is expected to be the 3 (151166.97) ~ 3.14 (157451.83) range.
In order to do that, we need to see if it is supported and rises near 2.618 (134018.28).
If it falls after the bull market in 2025, we don't know how far it will fall, but based on the previous decline, we expect it to fall by about -60% to -70%.
Therefore, if it starts to fall near the Fibonacci ratio of 3.14 (157451.83), it seems likely that it will fall to around Fibonacci 0.618 (44234.54).
I will explain more details when the bear market starts.
------------------------------------------------------

Gann Astro Trading Strategy with 92% Win Rate !Gann Astro Trading Strategy with 92% Win Rate !
Unlocking Gann's Secrets: Time Cycles, Square of 9, and Planetary Influence
In this video, we will dive deep into Gann’s trading methods, uncovering how time cycles, Square of 9 calculations, and planetary influences — especially the Mars-Jupiter cycle and lunar cycles — shape market movements. We’ll explore how numerology shifts and square roots reveal hidden support and resistance levels, plus how planetary declinations influence both price action and market psychology. Whether you’re a seasoned trader or just discovering Gann’s techniques, this breakdown will give you powerful insights to time the markets more effectively.
What You’ll Learn in This Video:
- How to apply Gann’s Square of 9 to track market highs and lows.
- The power of Mars-Jupiter cycles in driving momentum and expansion.
- How lunar cycles and faster planets like Mercury influence short-term moves.
- Using numerology shifts and square roots to uncover hidden support and resistance levels.
- The role of planetary declinations in shaping market psychology and major trend reversals.
Why This Video is Essential for Traders:
- Understand how Gann’s time cycles predict market turning points.
- Gain an edge with astrological market analysis — beyond traditional technical methods.
- Learn to combine fast and slow planets to time entries and exits more precisely.
- Decode historic market moves like the 2008 crash through planetary geometry.
Unlock the power of Gann’s time cycles, Square of 9, Gann Wheel, Gann angles, and Gann Fan to forecast market moves with precision. Discover how the Mars-Jupiter cycle, lunar phases, Gann Master Time Factor, Gann Emblem, and planetary declinations impact price action and trend shifts. Learn how Gann’s Law of Vibration, numerology shifts, square roots, price-time squaring, and hidden vibrational levels reveal key support and resistance zones. Whether it’s tracking historic market crashes, price-time balance, or Gann’s astro-numerology, this strategy will refine your entry-exit timing for maximum profitability.

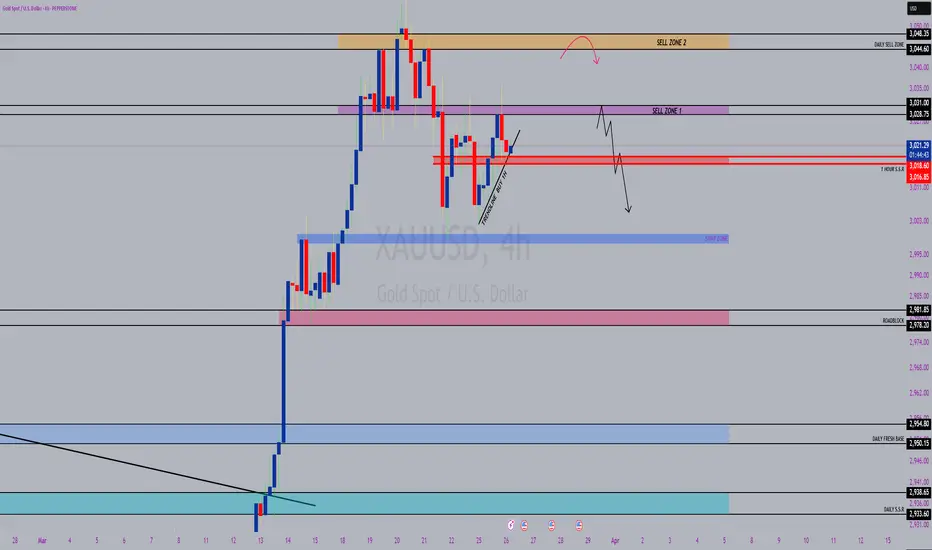
GOLD, XAUUSDTHIS ANALYSIS FOR "XAUUSD , GOLD" ON MULTIPLE TIME FRAME.
- What i can see on Gold right now price wanna make a big retreacement on daily time frame as we can see DXY already make clear breakout resistance on time frame 4 hour, possible now its time for DXY make a retracement.
- If trendline 1 hour and 1 hour S.S.R zone breakout just wait price comeback into this zone then we can SELL
- Or we can find opportunity on SELL ZONE 1
- If price make Sell desicon point on sell zone 2 please hold the position a bit far
- But if price break Sell zone 2 and minor resistance we just focus Buy
#TradeWhatYouSeeNotWhatYouThink
All the best !!!
If you want more update on "XAUUSD , GOLD". Kindly follow and like.
Feel free to comment my outlook and share with your friends. Thanks!
About AI's theme coin (token)...
Hello, traders.
If you "Follow", you can always get new information quickly.
Please also click "Boost".
Have a nice day today.
-------------------------------------
It seems that AI themes are currently classified into 5.
I will explain the coin (token) with the highest market capitalization in each theme.
-------------------------------------
(NEARUSDT 1D chart)
NEAR is classified as an AI & Big Data theme.
In order to turn into an uptrend, the price must be maintained above 3.756 and rise above the M-Signal indicator on the 1M chart.
Since OBV has broken through the upper line of the Price channel, the point to watch is whether it can continue to rise.
-
(FETUSDT.P 1D chart)
FET is classified as an AI Agents theme.
The key is whether it can maintain the price by rising above 0.848.
Since OBV is passing through the middle line of the Price channel, we should see whether it can be supported and rise near the M-Signal indicator on the 1D chart.
-
(VIRTUALUSDT.P 1D chart)
VIRTUAL is the No. 1 market cap ranking of the AI Agent Launchpad theme.
The key is whether it can maintain the price near the M-Signal indicator on the 1D chart and rise to around 1.1602.
-
(FARTCOINUSDT.P 1D chart)
FARTCOIN is classified as AI Memes theme.
The key is whether the price can be maintained around the Fibonacci ratio 0.236 (0.6228) and rise to around 1.4148.
If it fails to rise, it should check for support around 0.3822.
-
(TAOUSDT 1D chart)
TAO is classified as Generative AI theme.
The key is whether it can be maintained by receiving support around 271.1 and rising above 312.5.
In the meantime, it should be checked whether it can rise above the M-Signal indicator on the 1W chart.
If the M-Signal indicator of the 1W chart rises above and the price is maintained, it is expected to turn into an upward trend.
-------------------------------------------
Most coins (tokens) are showing the same flow as the coins (tokens) above.
This shows that the current section is an important turning point.
I think that in order to survive this important turning point and turn into an upward trend, an increase in trading volume must accompany it.
Therefore, I think it would be a good idea to check the current trading volume status by checking the flow of OBV of each coin (token).
There are three ways to interpret the OBV indicator.
1. If OBV is rising from the 0 point, it is an increase in buying power, and if it is falling, it is an increase in selling power.
2. If OBV is located above the EMA line of OBV, it is highly likely that buying power will increase, and if not, it is highly likely that selling power will increase.
3. Applying the formula of the Price channel to OBV, if each Price channel line breaks upward, there is a high possibility that the buying force will increase, and if it breaks downward, there is a high possibility that the selling force will increase.
In addition to the interpretation of 1, 2 and 3 can be interpreted as the possibility that the price will rise when the buying force increases, and the possibility that the price will fall when the selling force increases.
In 1, the price area around the 0 point is considered the selling area (volume profile) and is likely to play the role of support and resistance points.
-
Thank you for reading to the end.
I hope you have a successful transaction.
--------------------------------------------------
- This is an explanation of the big picture.
I used TradingView's INDEX chart to check the entire section of BTC.
I rewrote the previous chart to update it by touching the Fibonacci ratio section of 1.902 (101875.70) ~ 2 (106275.10).
(Previous BTCUSD 12M chart)
Looking at the big picture, it seems to have been following a pattern since 2015 and has been rising.
In other words, it is a pattern that maintains a 3-year bull market and faces a 1-year bear market.
Accordingly, the bull market is expected to continue until 2025.
-
(Current BTCUSD 12M chart)
Based on the currently written Fibonacci ratio, it is displayed up to 3.618 (178910.15).
It is expected that it will not fall again below the Fibonacci ratio of 0.618 (44234.54).
(BTCUSDT 12M chart)
I think it is around 42283.58 when looking at the BTCUSDT chart.
-
I will explain it again with the BTCUSD chart.
The Fibonacci ratio ranges marked in the light green boxes, 1.902 (101875.70) ~ 2 (106275.10) and 3 (151166.97) ~ 3.14 (157451.83), are expected to be important support and resistance ranges.
In other words, it seems likely to act as a volume profile range.
Therefore, in order to break through this section upward, I think the point to watch is whether it can rise with support near the Fibonacci ratios of 1.618 (89126.41) and 2.618 (134018.28).
Therefore, the maximum rising section in 2025 is expected to be the 3 (151166.97) ~ 3.14 (157451.83) section.
To do that, we need to look at whether it can rise with support near 2.618 (134018.28).
If it falls after the bull market in 2025, we don't know how far it will fall, but considering the previous decline, we expect it to fall by about -60% to -70%.
So, if the decline starts near the Fibonacci ratio 3.14 (157451.83), it seems likely that it will fall to around Fibonacci 0.618 (44234.54).
I will explain more details when the downtrend starts.
------------------------------------------------------

Gold/EUR Analysis –Bearish Continuation from Channel Resistance📉
Market Structure & Trend
The chart represents a descending channel where price has continuously rejected from the upper boundary.
Multiple lower highs and lower lows indicate a bearish trend.
Gold/EUR has once again reached the channel resistance and failed to break above, suggesting a strong sell opportunity.
Key Technical Levels
🔴 Resistance:
2,809 - Local resistance where price has faced rejection multiple times.
2,849 - Major resistance level, a break above this could invalidate the bearish outlook.
🟢 Support & Target Levels:
2,790 - Short-term support; if broken, further downside is expected.
2,740 - First key target where previous demand is present.
2,660 - Major support and final bearish target if selling pressure continues.
Trade Setup & Strategy
📍 Sell Below: 2,790
🎯 Target 1: 2,740
🎯 Target 2: 2,660
❌ Stop-Loss: Above 2,810
Conclusion
Bearish bias remains strong as long as price stays below 2,809.
A breakdown below 2,790 could accelerate selling pressure.
Traders can look for bearish confirmation signals (e.g., break of structure, candlestick patterns) to enter short positions.
Would you like a refined strategy based on lower timeframes?

I have revised the description of the big picture
Hello, traders.
If you "Follow", you can always get new information quickly.
Please also click "Boost".
Have a nice day today.
-------------------------------------
I used TradingView's INDEX chart to check the entire range of BTC.
I rewrote it to update the previous chart while touching the Fibonacci ratio range of 1.902 (101875.70) ~ 2 (106275.10).
(Previous BTCUSD 12M chart)
Looking at the big picture, it seems to have been maintaining an upward trend following a pattern since 2015.
In other words, it is a pattern that maintains a 3-year uptrend and faces a 1-year downtrend.
Accordingly, the upward trend is expected to continue until 2025.
-
(Current BTCUSD 12M chart)
Based on the currently written Fibonacci ratio, it is displayed up to 3.618 (178910.15).
It is expected that it will not fall again below the Fibonacci ratio of 0.618 (44234.54).
(BTCUSDT 12M chart)
Based on the BTCUSDT chart, I think it is around 42283.58.
-
I will explain it again with the BTCUSD chart.
The Fibonacci ratio ranges marked in the green boxes, 1.902 (101875.70) ~ 2 (106275.10) and 3 (151166.97) ~ 3.14 (157451.83), are expected to be important support and resistance ranges.
In other words, it seems likely that they will act as volume profile ranges.
Therefore, in order to break through these ranges upward, I think the point of observation is whether it can receive support and rise near the Fibonacci ratios of 1.618 (89126.41) and 2.618 (134018.28).
Therefore, the maximum rising range in 2025 is expected to be the 3 (151166.97) ~ 3.14 (157451.83) range.
In order to do that, we need to see if it is supported and rises near 2.618 (134018.28).
If it falls after the bull market in 2025, we don't know how far it will fall, but based on the previous decline, we expect it to fall by about -60% to -70%.
Therefore, if it starts to fall near the Fibonacci ratio 3.14 (157451.83), it seems likely that it will fall to around Fibonacci 0.618 (44234.54).
I will explain the details again when the bear market starts.
-
Thank you for reading to the end.
I hope you have a successful trade.
-----------------
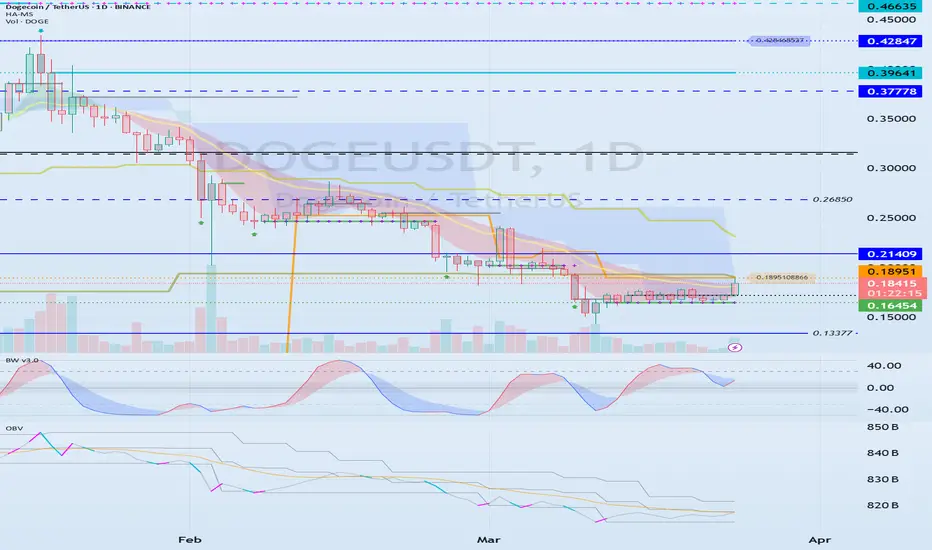
The key is whether it supports around 0.18951
Hello, traders.
If you "Follow", you can always get new information quickly.
Please also click "Boost".
Have a nice day today.
-------------------------------------
(DOGEUSDT 1D chart)
The key is whether it can maintain the price by rising above 0.18951.
If it rises after receiving support near 0.18951, we need to see whether it can rise above the M-Signal indicator on the 1W chart.
In other words, we need to see whether it can maintain the price above 0.21409.
If not, it is likely to show a downward trend like the previous trend.
-
Therefore, I think this is a great opportunity to turn into an upward trend in line with the flow of BTC.
What we need to do is to check if it is supported around 0.18951.
If it is supported, it is a time to buy.
Since the M-Signal indicator of the 1M chart is passing around 0.18951, it is highly likely that it will show a different flow than before.
Since OBV has to break through the upper line of the Price channel to surge, it is better not to rush too much and check if it is supported around 0.18951 before trading.
-
Thank you for reading to the end.
I hope you have a successful trade.
--------------------------------------------------
- Big picture
I used TradingView's INDEX chart to check the entire range of BTC.
(BTCUSD 12M chart)
Looking at the big picture, it seems to have been following a pattern since 2015.
In other words, it is a pattern that maintains a 3-year bull market and faces a 1-year bear market.
Accordingly, the bull market is expected to continue until 2025.
-
(LOG chart)
Looking at the LOG chart, we can see that the increase is decreasing.
Accordingly, the 46K-48K range is expected to be a very important support and resistance range from a long-term perspective.
Therefore, we do not expect to see prices below 44K-48K in the future.
-
The Fibonacci ratio on the left is the Fibonacci ratio of the uptrend that started in 2015.
That is, the Fibonacci ratio of the first wave of the uptrend.
The Fibonacci ratio on the right is the Fibonacci ratio of the uptrend that started in 2019.
Therefore, this Fibonacci ratio is expected to be used until 2026.
-
No matter what anyone says, the chart has already been created and is already moving.
It is up to you how to view and respond to it.
Since there is no support or resistance point when the ATH is updated, the Fibonacci ratio can be appropriately utilized.
However, although the Fibonacci ratio is useful for chart analysis, it is ambiguous to use it as a support and resistance role.
The reason is that the user must directly select the important selection points required to create the Fibonacci.
Therefore, it can be useful for chart analysis because it is expressed differently depending on how the user specifies the selection point, but it can be seen as ambiguous for use in trading strategies.
1st: 44234.54
2nd: 61383.23
3rd: 89126.41
101875.70-106275.10 (when overshooting)
4th: 134018.28
151166.97-157451.83 (when overshooting)
5th: 178910.15
-----------------
The start of the first important volatility period of the year
Hello, traders.
If you "Follow", you can always get new information quickly.
Please click "Boost" as well.
Have a nice day today.
-------------------------------------
(BTCUSDT 1D chart)
This is the first day of the volatility period.
The key is whether it can rise from the downward channel.
This volatility period is expected to last until March 26.
The point of interest is whether it can break out of the downward channel and receive support near the Fibonacci ratio range of 2.618 (87814.27) ~ 1.618 (89050.0).
If not, we should see if it can find support near Fibonacci 2.24 (83646.12) and rise without going below the downtrend line.
If it holds above the downtrend line, we should see if it can rise above Fibonacci 1.618 (89050.0) during the next volatility period around April 5th.
In any case, if it breaks out of the downtrend channel and holds, I think it is likely to turn into an uptrend.
-
(1M chart)
As I mentioned before, we should not forget that there is no trend line formed by the low point of the StochRSI indicator on the 1M chart, so volatility may occur to create a trend line.
Therefore, whether it can complete the trend line while receiving support near the 69000 ~ 73499.86 range and rising is an important point of observation from a long-term perspective.
In this sense, what we can choose is to see whether it can receive support near the current location, that is, the StochRSI 50 indicator point of 83983.20.
If the support is broken, it can fall along the downtrend line.
This period of volatility is expected to be the first important period of the year.
-
Thank you for reading to the end.
I hope you have a successful trade.
--------------------------------------------------
- Big picture
I used TradingView's INDEX chart to check the entire range of BTC.
(BTCUSD 12M chart)
Looking at the big picture, it seems that it has been maintaining an upward trend following a pattern since 2015.
That is, it is a pattern that maintains a 3-year uptrend and faces a 1-year downtrend.
Accordingly, the uptrend is expected to continue until 2025.
-
(LOG chart)
As you can see from the LOG chart, the uptrend is decreasing.
Accordingly, the 46K-48K range is expected to be a very important support and resistance range from a long-term perspective.
Therefore, we expect that we will not see prices below 44K-48K in the future.
-
The Fibonacci ratio on the left is the Fibonacci ratio of the uptrend that started in 2015.
In other words, it is the Fibonacci ratio of the first wave of the uptrend.
The Fibonacci ratio on the right is the Fibonacci ratio of the uptrend that started in 2019.
Therefore, this Fibonacci ratio is expected to be used until 2026.
-
No matter what anyone says, the chart has already been created and is already moving.
It is up to you to decide how to view and respond to this.
When the ATH is updated, there are no support and resistance points, so the Fibonacci ratio can be used appropriately.
However, although the Fibonacci ratio is useful for chart analysis, it is ambiguous when used as support and resistance.
This is because the user must directly select the important selection points required to create Fibonacci.
Therefore, since it is expressed differently depending on how the user specifies the selection points, it can be useful for chart analysis, but it can be seen as ambiguous when used for trading strategies.
1st : 44234.54
2nd : 61383.23
3rd : 89126.41
101875.70-106275.10 (Overshooting)
4th : 134018.28
151166.97-157451.83 (Overshooting)
5th : 178910.15
-----------------

Gann Trading Strategy: Understanding Gann Price CyclesGann Trading Strategy: Understanding Gann Price Cycles.
Gann Trading Strategy with a deep dive into Gann Price Cycles and candle range averaging to forecast upcoming highs and lows. Learn how to apply Gann's time and price principles, predict market turning points, and enhance your trading accuracy.
Gann Price Cycles: Understanding Market Movements with Precision
- Gann Price Cycles are a fundamental concept in W.D. Gann's trading methodology, used to predict market highs and lows based on historical price movements and time cycles. Gann believed that markets move in predictable cycles, influenced by both price and time relationships. By studying these cycles, traders can anticipate future turning points with greater accuracy.
Key Principles of Gann Price Cycles:
1. Repeating Market Patterns – Price movements follow specific cyclical patterns that repeat over time. Identifying these patterns helps traders forecast future price swings.
2. Time and Price Symmetry – Gann emphasized that time and price must be in balance. When a market completes a significant time cycle, it often results in a reversal or acceleration of trend.
3. Natural Market Rhythms – Just like planetary cycles, financial markets move through predictable 360-degree price cycles, based on Gann’s Square of Nine and Gann Angles.
4. Averaging Price Ranges – By analyzing historical price ranges and averaging them, traders can estimate the next high or low in the market.

The key is whether it can be supported around 15.45
Hello, traders.
If you "Follow", you can always get new information quickly.
Please click "Boost" as well.
Have a nice day today.
-------------------------------------
(LINKUSDT 1D chart)
How to interpret the OBV indicator
1. If OBV is rising from the 0 point, it is interpreted as an increase in buying power, and if it is falling, it is interpreted as an increase in selling power
2. How to create an EMA indicator for OBV and interpret it as rising or falling above the EMA indicator
3. How to add the price channel formula to the OBV indicator and interpret it like Bollinger Bands
-
If the price is maintained at the current price position, it is expected to attempt to rise above 15.45.
However, since the StochRSI indicator is showing a downward trend in the overbought zone, the key point is whether there is support near 15.45.
If it fails to rise, we should check whether there is support near 13.13.
-
I think we are facing a golden opportunity to turn into an upward trend.
If it fails to turn into an upward trend this time, there is a possibility that it will eventually fall to around 10.0, so we should think about a response plan for this.
Therefore, what we should pay close attention to is whether there is support near 15.45 and it can rise.
If support is confirmed near 15.45, it is the time to buy.
The first sell zone is 19.52-20.51.
-
Thank you for reading to the end.
I hope you have a successful transaction.
--------------------------------------------------
- Big picture
I used TradingView's INDEX chart to check the entire range of BTC.
(BTCUSD 12M chart)
Looking at the big picture, it seems to have been maintaining an upward trend following a pattern since 2015.
In other words, it is a pattern that maintains a 3-year upward trend and faces a 1-year downward trend.
Accordingly, the upward trend is expected to continue until 2025.
-
(LOG chart)
Looking at the LOG chart, you can see that the upward trend is decreasing.
Accordingly, the 46K-48K range is expected to be a very important support and resistance range from a long-term perspective.
Therefore, I expect that we will not see prices below 44K-48K in the future.
-
The Fibonacci ratio on the left is the Fibonacci ratio of the uptrend that started in 2015.
That is, the Fibonacci ratio of the first wave of the uptrend.
The Fibonacci ratio on the right is the Fibonacci ratio of the uptrend that started in 2019.
Therefore, this Fibonacci ratio is expected to be used until 2026.
-
No matter what anyone says, the chart has already been created and is already moving.
It is up to you how to view and respond to it.
Since there is no support or resistance point when the ATH is updated, the Fibonacci ratio can be appropriately utilized.
However, although the Fibonacci ratio is useful for chart analysis, it is ambiguous to use it as a support and resistance role.
The reason is that the user must directly select the important selection points required to create the Fibonacci.
Therefore, it can be useful for chart analysis because it is expressed differently depending on how the user specifies the selection point, but it can be seen as ambiguous for use in trading strategies.
1st: 44234.54
2nd: 61383.23
3rd: 89126.41
101875.70-106275.10 (when overshooting)
4th: 134018.28
151166.97-157451.83 (when overshooting)
5th: 178910.15
-----------------

Gann Trading Strategy | Predict Market Highs & Lows with Gann.Gann Trading Strategy | Predict Market Highs & Lows with Gann Trading Strategy
In this video we will unlock historical secrets of Sacred Geometry and how they apply to financial markets through W.D. Gann's Time & Price concepts. This video explores the deep connection between natural mathematical principles, the Golden Ratio (0.618), Fibonacci levels, and market structure—all rooted in ancient sacred geometry used in art, architecture, and astronomy.
Markets are not random; they follow universal laws found in nature, human anatomy, and celestial movements. Gann discovered that time and price cycles repeat in predictable patterns, allowing traders to anticipate reversals with precision. This video will guide you through how to use these ancient principles in modern trading.
What You'll Learn in This Video:
✅ Understanding Gann’s Time & Price Geometry – The foundation of market movements
✅ Golden Ratio & Fibonacci Trading – How 0.618, 0.786, and 1.618 shape market trends
✅ The ABCD Pattern in Trading – How to use structured price action setups.
Discover the hidden connections between Sacred Geometry, W.D. Gann’s Time & Price principles, and financial markets in this powerful Gann trading lesson. Markets are not random; they move according to natural laws, mathematical ratios, and planetary cycles—the same principles found in ancient architecture, astronomy, and human biology. Gann’s work revealed that time and price must synchronize for major market reversals, and by understanding these patterns, traders can anticipate key turning points with accuracy. This lesson will dive deep into Gann’s geometric approach, the Golden Ratio (0.618), Fibonacci levels, and structured price action setups, all of which play a crucial role in market movements.

About the Volume OBV indicator...
Hello, traders.
If you "Follow", you can always get new information quickly.
Please click "Boost" as well.
Have a nice day today.
-------------------------------------
I think TradingView is attractive because users can create charts as they want.
However, since the number of indicators that can be added to the chart is limited depending on the plan, you have to add indicators that fit your plan.
As a result, I ended up integrating multiple indicators into one indicator.
-
The HA-MS indicator in this chart is a public indicator.
If you search the Internet, you can find detailed explanations on how to interpret the OBV indicator.
I expressed it as follows to make this interpretation method more realistic.
The body color of the candlestick is indicated by the 4-stage OBV indicator.
The OBV indicator is distinguished in the same way as the Price Channel indicator.
You can interpret it like the Bollinger Band.
That is, if the middle line that divides 2 and 3 rises by more than 3, you can interpret that the buying force is increasing.
1: It means below the lower line of the Price Channel and is indicated in dark red.
If you enter this section, there is a high possibility of a sharp decline.
You should check the support and resistance points because it is likely to stop falling soon and rise to 2.
2: It means between the lower line and the middle line of the Price Channel and is indicated in red.
This section is likely to show a weak downward sideways movement.
Therefore, if it rises from 1->2, there is a possibility of a short rise. However, if it fails to rise to 3, it is likely to fall back to 1, so it is recommended to make short trades.
3: It means between the middle line and the upper line of the Price Channel and is displayed in green.
This section is likely to show a weak upward sideways movement.
If it rises from 2 -> 3 and shows a sideways movement, you should focus on finding a buying point.
4: It means above the upper line of the Price Channel and is displayed in dark green.
If it enters this section, there is a high possibility of a sharp rise.
Since it is likely to stop rising soon and fall to 3, you should check the support and resistance points.
-
What we should pay attention to is when it changes from 1 -> 2, 4 -> 3.
As explained above, 1 is a section located below the lower line of the Price Channel, so there is a high possibility of a sharp fall.
4 is a section located above the upper line of the Price Channel, so there is a high possibility of a sharp rise.
Therefore, you can proceed with an aggressive buy when it changes from 1 -> 2, and you can proceed with a sell when it changes from 4 -> 3.
In the case of futures, it can be used as reference information for entering and liquidating LONG and SHORT positions.
-
They say that the only things you need on a chart are price and trading volume.
However, it is not easy to interpret this in reality.
To compensate for this, we hid the colors of the existing candles and displayed them in 4 stages of OBV so that you can intuitively see which stage the current price is at.
-
Thank you for reading to the end.
I hope you have a successful transaction.
--------------------------------------------------

The key is whether there is support near 1935.34
Hello, traders.
If you "Follow", you can always get new information quickly.
Please also click "Boost".
Have a nice day today.
-------------------------------------
(ETHUSDT 1D chart)
The important support and resistance zones have changed as it has fallen below the long-term upward trend line (1).
After March 18, the key is whether ETH can maintain its price by receiving support near 1935.34 and rising above the M-Signal indicator on the 1D chart, that is, the Fibonacci ratio of 0.236 (2090.85).
If it falls after receiving resistance near 1935.34, it is possible that it will fall to around 1340.12, so you should also consider a response plan for this.
-
In order to turn into an uptrend, the price must rise above the M-Signal indicator on the 1M chart and maintain it.
To do so, the price must be maintained near the Fibonacci ratio of 0.382 (2647.80).
-
Therefore, if it rises after receiving support near 1935.34,
1st: M-Signal on the 1D chart (Fibonacci ratio of 0.236 (2090.85))
2nd: M-Signal on the 1M chart (Fibonacci ratio of 0.382 (2647.80))
You should respond depending on whether there is support near the 1st and 2nd above.
Currently, the StochRSI indicator is showing signs of entering the overbought zone, so even if there is an additional rise, it is expected to eventually show a downward trend.
In order to ignore this law, an explosive trading volume or favorable market news is required.
-
(30m chart)
Since the StochRSI indicator is in the oversold zone, it is highly likely to rise even if it continues to fall further.
However, since it is a 30m chart, you should respond based on day trading or short-term trading.
Since the HA-High (1936.67) indicator and the BW (100) (1944.96) indicator are located near 1935.34, we can see that it is forming a resistance zone.
Therefore, even if there is an additional rise, it seems likely to be resisted in this resistance zone (1936.67-1944.96).
If it falls below 1923.43,
1st: Heikin Ashi's Close on the 1D chart
2nd: HA-Low indicator (1885.30)
3rd: 1865.10
We need to check if it is supported near the 1st-3rd above.
-
Therefore, if it is supported and rises near 1935.34,
1st: M-Signal on 1D chart (Fibonacci ratio 0.236 (2090.85))
2nd: M-Signal on 1M chart (Fibonacci ratio 0.382 (2647.80))
You need to respond depending on whether there is support near the 1st and 2nd above.
Since the StochRSI indicator is currently showing signs of entering the overbought zone, it is expected that it will eventually show a downward trend even if there is an additional rise.
In order to ignore this law, an explosive trading volume or favorable market conditions must occur.
-
Thank you for reading to the end.
I hope you have a successful trade.
--------------------------------------------------
- Big picture
I used TradingView's INDEX chart to check the entire range of BTC.
(BTCUSD 12M chart)
Looking at the big picture, it seems to have been maintaining an upward trend following a pattern since 2015.
In other words, it is a pattern that maintains a 3-year upward trend and faces a 1-year downward trend.
Accordingly, the upward trend is expected to continue until 2025.
-
(LOG chart)
Looking at the LOG chart, you can see that the upward trend is decreasing.
Accordingly, the 46K-48K range is expected to be a very important support and resistance range from a long-term perspective.
Therefore, we expect that we will not see prices below 44K-48K in the future.
-
The Fibonacci ratio on the left is the Fibonacci ratio of the uptrend that started in 2015.
In other words, it is the Fibonacci ratio of the first wave of the uptrend.
The Fibonacci ratio on the right is the Fibonacci ratio of the uptrend that started in 2019.
Therefore, it is expected that this Fibonacci ratio will be used until 2026.
-
No matter what anyone says, the chart has already been created and is already moving.
How to view and respond to this is up to you.
When the ATH is updated, there are no support and resistance points, so the Fibonacci ratio can be used appropriately.
However, although the Fibonacci ratio is useful for chart analysis, it is ambiguous when used as support and resistance.
This is because the user must directly select the important selection points required to create Fibonacci.
Therefore, since it is expressed differently depending on how the user specifies the selection points, it can be useful for chart analysis, but it can be seen as ambiguous when used for trading strategies.
1st : 44234.54
2nd : 61383.23
3rd : 89126.41
101875.70-106275.10 (Overshooting)
4th : 134018.28
151166.97-157451.83 (Overshooting)
5th : 178910.15
-----------------
Volatility Period: Around March 22-25
Hello, traders.
If you "Follow", you can always get new information quickly.
Please also click "Boost".
Have a nice day today.
-------------------------------------
(BTCUSDT 1D chart)
I think it always falls less than expected and rises more than expected.
Therefore, trades should always be done in split trades.
This volatility period is expected to last from March 21st to 26th.
Therefore, the key is whether it can break out of the downtrend channel and maintain the price after this volatility period.
In order to do that, it is important to see if it can be supported near the Fibonacci ratio range of 2.618 (87814.27) ~ 1.618 (89050.0).
If it breaks out of the downtrend channel and falls, if it does not fall below the downtrend line, it is expected to rise.
In other words, we need to check if it is supported near the Fibonacci ratio point of 2.24 (83646.12).
If not, if it falls, it is expected to touch the M-Signal indicator on the 1M chart.
In other words, it is expected to touch near 73499.86.
-
Thank you for reading to the end.
I hope you have a successful trade.
--------------------------------------------------
- Big picture
I used TradingView's INDEX chart to check the entire range of BTC.
(BTCUSD 12M chart)
Looking at the big picture, it seems to have been following a pattern since 2015.
In other words, it is a pattern that maintains a 3-year bull market and faces a 1-year bear market.
Accordingly, the bull market is expected to continue until 2025.
-
(LOG chart)
Looking at the LOG chart, we can see that the increase is decreasing.
Accordingly, the 46K-48K range is expected to be a very important support and resistance range from a long-term perspective.
Therefore, we do not expect to see prices below 44K-48K in the future.
-
The Fibonacci ratio on the left is the Fibonacci ratio of the uptrend that started in 2015.
That is, the Fibonacci ratio of the first wave of the uptrend.
The Fibonacci ratio on the right is the Fibonacci ratio of the uptrend that started in 2019.
Therefore, this Fibonacci ratio is expected to be used until 2026.
-
No matter what anyone says, the chart has already been created and is already moving.
It is up to you how to view and respond to it.
Since there is no support or resistance point when the ATH is updated, the Fibonacci ratio can be appropriately utilized.
However, although the Fibonacci ratio is useful for chart analysis, it is ambiguous to use it as a support and resistance role.
The reason is that the user must directly select the important selection points required to create the Fibonacci.
Therefore, it can be useful for chart analysis because it is expressed differently depending on how the user specifies the selection point, but it can be seen as ambiguous for use in trading strategies.
1st: 44234.54
2nd: 61383.23
3rd: 89126.41
101875.70-106275.10 (when overshooting)
4th: 134018.28
151166.97-157451.83 (when overshooting)
5th: 178910.15
-----------------

Chart Analysis and Trading Strategy (2)
Hello, traders.
If you "Follow", you can always get new information quickly.
Please also click "Boost".
Have a nice day today.
-------------------------------------
If you look at the candle that the finger is pointing to, you can see that it is a bearish candle with Open > Close.
If you look at this on a 30m chart, you can see that it moves as follows and forms lows and highs.
These candle movements come together to form a candle arrangement, and by looking at this, we ultimately set support and resistance points.
As your understanding of candles deepens, you will study charts in various ways.
The reason is that you may know it when you look at the chart, but you cannot when you trade.
That is, because the understanding of candles is not clear.
As you study the charts over and over again, you will learn that charts tend to converge to the median and average values.
You learn that they converge to the median and average values while studying various indicators, but you end up not knowing what you can learn from them.
What is important in the arrangement of candles is that the arrangement of the Open and Close bodies and the Low and High tails that make up the candles play an important role in setting support and resistance points.
I recommend that you understand this explanation through the Internet or a book.
The reason is that it is something that requires a lot of time investment to acquire.
-
The HA-MS indicator was created to quickly display support and resistance points as objective information.
Therefore, you can see that when the channel composed of the HA-Low indicator and the HA-High indicator is broken, a trend is formed, and if not, a sideways movement is shown.
The HA-Low, HA-High indicators are indicators created by combining the arrangement of candles and the RSI indicator on the Heikin-Ashi chart.
Therefore, the trading strategy is used to create a trading strategy depending on whether there is support near the HA-Low, HA-High indicators.
The other indicators, BW(0), BW(100), DOM(-60), and DOM(60), are used as support and resistance to create a detailed response strategy.
-
Based on this information, trading should be divided into trading in the sideways section and trading in the trend to create a trading strategy.
This trading time is created based on whether there is support in the HA-Low, HA-High indicators.
Since it is made of indicators, I think it provides objective information for chart interpretation with others, reducing the room for controversy.
This is the fundamental reason for using indicators.
It is because we can share objective information with each other.
-
In trading within the sideways section, information about the trend is not particularly necessary.
If you set the sideways section with your own indicator or support and resistance points, you can trade based on whether there is support at the end of that section.
-
However, when you leave the sideways section, information about the trend is necessary.
That is why we use the M-Signal indicator and Trend Cloud indicator on the 1D, 1W, and 1M charts as indicators for the trend.
For short-term information, you can use the M-Signal indicator and Trend Cloud indicator on the 1D chart.
If the Trend Cloud indicator is displayed in green and the price is maintained above the M-Signal indicator on the 1D chart, it can be interpreted that there is a high possibility of a turn to an uptrend.
If not, it can be interpreted that there is a high possibility of a downtrend.
The mid- to long-term trend can be identified by checking the arrangement status of the M-Signal indicator on the 1W chart and the M-Signal indicator on the 1M chart.
That is, if the M-Signal on the 1W chart > the M-Signal on the 1M chart, it can be interpreted that the mid- to long-term trend is maintaining an uptrend.
Therefore, in order to continue the uptrend from a long-term perspective, the price must be maintained above the M-Signal indicator on the 1M chart.
If not, it is recommended to make short trades if possible.
-
To better set the support and resistance points, look at the 1M chart > 1W chart > 1M chart in that order and draw a horizontal line on the indicators (HA-Low, HA-High, BW(0), BW(100), DOM(-60), DOM(60)) displayed on the chart and mark them on the chart.
Mark the support and resistance points on the chart as above.
This marks the support and resistance points with the low and high points.
-
It is not easy to start trading at the low or high points every time.
Therefore, as I mentioned earlier, it is important to create a detailed response strategy based on the median and average values.
For this, the StochRSI 50 indicator is displayed.
In addition, the Close of the Heikin-Ashi chart of the 1D chart, which can be usefully utilized when trading below the 1D chart, is added.
-------------------------------------------------
The information I mentioned above is ultimately information that can be obtained through chart analysis.
You can create a trading strategy by deciding whether to check it directly with your eyes and indicate support and resistance points, or to use an indicator that can be checked more quickly.
Chart analysis is about understanding the movement of the chart, and actual trading is conducted according to the trading strategy.
You may think that chart analysis is the trading strategy, but it is not.
No matter how well you analyze charts with your eyes, if you analyze charts when your psychological state is unstable due to subjective thoughts based on various information other than the chart, as I mentioned earlier, you may end up trading in the wrong direction.
To prevent this, it is necessary to use indicators so that subjective thoughts are not applied.
Even if you start trading at the support and resistance points created by the indicator, and it goes in the opposite direction and you suffer a loss, the influence will be weak.
The reason is that you created a trading strategy with the support and resistance points created by the indicator in advance.
Things to consider when starting a trade in a trading strategy are:
1. When to buy or how to buy
2. When to cut loss or how to cut loss
3. How to realize profit
For this reason, it is important to set support and resistance points through chart analysis.
-
It is better to do chart analysis briefly.
If you spend too much time analyzing charts, you may end up being trapped in your own subjective thoughts, so be careful.
I think you can tell whether you will do chart analysis in an analyst-like manner or in a chart analysis necessary for trading by looking at how the support and resistance points are marked on the chart.
The ideas of chart analysis often do not include things that need to be considered when starting a trade.
Therefore, in order to apply them to actual trading, you need to create a trading strategy through chart analysis.
The chart analysis for trading reduces the need for separate chart analysis because the information necessary for the trading strategy is displayed on the chart.
However, it may need to change depending on your investment style or the time frame chart you are actually trading on, but it can be advantageous for trading because the support and resistance points are marked.
To ensure this, you need to create an indicator and receive support and resistance points as objective information.
-
Thank you for reading to the end.
I hope you have a successful trade.
--------------------------------------------------

ETH/USDT – Ascending channel. Breakdown below support?Ethereum - is a smart contract platform that allows developers to build decentralized applications (DApps) on its blockchain.
CoinMarketCap : #2
↗️ Ethereum is moving within an ascending channel, and the bullish trend remains intact.
Inside the channel, there are two triangles.
The first triangle, with a base of 88%, has played out—its third wave broke through the triangle.
Liquidity grabs and shakeouts before the growth in the inner channel zones are marked with yellow circles.
Currently, we see a mirrored situation with a new triangle, this time with a 156% base. However, if this pattern plays out, it will break the ascending channel.
At the moment, the price has been dragged below the channel support, and there is a lot of negative sentiment in the news and opinions. Few believe in an upward move, and many have been liquidated. To me, this looks like a strong trigger.
⤵️The bearish scenario implies a -61% drop. (A less likely scenario.)
I've marked everything on the chart—consider this in your trading strategy. Remember, there's a lot of negativity around Ethereum, just like with all altcoins...
I also believe that on the monthly chart, it will end up being just a wick of the candle.

SCRT/USDT – Testing support. Will the scenario repeat?Secret - is a privacy-focused blockchain built on Cosmos. Its smart contracts, called Secret Contracts, enable DApps to utilize private data on Secret, similar to how smart contracts function on other blockchains. However, Secret Contracts transmit encrypted data through encrypted channels without exposing it. This is made possible by encrypting the contract state during execution.
All the charts are cropped, so I found a more complete historical chart of the coin and overlaid it to the left.
This coin has dropped by approximately -98% since its distribution. To put it in perspective, if you had invested $1,000 , you would now have only $20 …
We observe a formation resembling an internal channel (120%) and an external channel (280%) . The price is once again being squeezed near support at the lowest price zones available on Binance (where the main liquidity is).
My previous trading idea played out successfully in three zones .
Profit from the time of publication to the squeeze: +270%.
The price is moving within a descending channel , but at the same time, the sideways range I previously anticipated is also forming. Here, it’s crucial to adapt to the situation.
Right now, the entire market is experiencing a pullback toward support levels .
I've marked potential final liquidity grab zones on the chart—consider these in your trading strategy.
Also, I want to highlight how negative the news sentiment is at the moment. No one believes in a rally. But that's exactly how it always looks in similar price reversal zones !)))
