CADCHF at strong resistanceCADCHF is approaching significant resistance from which I expect a fall.
Good trading!
If you find it useful, like, follow, share!
Tradingstrategy

Key Levels and Market overview for the Asian session open 2/03A review of the price action from the European session and US sessions which gave us some choppy price action. Markets remain under some pressure from sellers with DAX and FTSE giving back earlier gains while the US edged lower. The USD found some sellers which supported Gold while US bond yields rallied again and Oil ranged....mixed bag really!! I look at some key levels to watch and the price action setups I expect to see play out.
Markets covered :-
DOW
Nasdaq
DAX
FTSE
ASX200
Hang Seng
USD Index
Gold
Oil
Copper

GBPCHF is on strong supportThe price has reached a strong support, forming a wedge pattern from which it can return to previous significant levels.
D1:

Short Selling Opportunity Ahead: AUDCAD Analysis | 4h chartHello traders,
As you can see in my previous post the resistance level reached and profit target hit.
Now again short selling opportunity on the horizon. Wait for the OANDA:AUDCAD to close below stable support (0.91200-0.91500) and test resistance before opening short position.
Avoid long position due to downward trend and high supply.
Thanks & regards,
Alpha Trading Station
Disclaimer: This view is for educational purpose only & any stock mentioned here should not be taken as a trading/investing advice. We may or may not have position in the stocks mentioned here. Please consult your financial advisor before investing. Because Price is the "King of Market".

Back With The Charts EURAUD BullishAs a trader, it's important to not only identify potential trading opportunities, but also to manage risk effectively. With that in mind, based on my analysis of the EURAUD pair, I have a bullish bias on the 4-hour timeframe.
One reason for my bullish bias is that the pair has broken through a major resistance level , and has made a new higher high. This indicates that there may be further upside potential for the pair.
However, before entering into a trade, it's important to wait for a pullback to the former resistance level , which should now act as support. This allows for a more favorable risk-reward ratio, as you can place a stop loss below the support level to limit potential losses.
Additionally, it's important to have personal entry criteria in place, such as waiting for confirmation through candlestick patterns or indicators before entering a trade. This helps to ensure that you're entering into trades with a higher probability of success.
Overall, while this analysis and prediction may provide a potential trading opportunity, it's important to remember to manage risk effectively. This includes setting appropriate stop loss levels, and being mindful of position sizing to avoid over-exposure to any one trade.

Bitcoin is now expected to reach levels 23.8K - K22.4 - K21.5The first target was reached by Bitcoin yesterday, by a slight difference, and the price bounced from it, and it is expected to return to touching this level, and it is considered a minor and weak support, and it can be broken easily
Today, it is expected to break 22.8K, and head towards the second support levels at 22.4K, and it is likely to be broken if the rise continues on Dominance Tether..

AUDUSD Short Trade Idea: High U.S. Inflation and Hawkish FedThe AUDUSD pair is currently under pressure as a result of stubbornly high U.S. inflation and signals from the Fed that interest rates may need to be raised for a longer period than previously anticipated. We are looking to take a short trade on AUDUSD at 0.68977, with a take profit target at 0.67519 and a stop loss at 0.70014. This trade idea is based on the potential for the U.S. Dollar to continue to strengthen, while the Australian Dollar may weaken due to concerns about containing inflation. #AUDUSD #shorttrade #USinflation #hawkishFed #tradingstrategy 📈📊💰

Matic - trendline, support and resistanceMatic broke the secondary trendline and targeted the following resistances: 1.3500, 1.4000, 1.4400. Support zone: 1.2000
Good trading!
If you find it useful, like, follow, share!

Nasdaq on significant supportThe nadaq has returned to the previous high, which is the fibo level of 0.618, this may be a good level to go up further. The next support is at 11870.
The next resistances: 12480; 12800; 13168; 13600.
D1:
Good trading!
If you find it useful, like, follow, share!

How to Spot the Confluence Zone | Pro Fibonacci Technique
If you are struggling with the identification of accurate trading entries,
you definitely should try confluence zones.
Note: there are hundreds of variations of confluence elements.
In this example, we will discuss trend lines and fibonnachi.
❗️To identify a confluence zone, the price must follow a trend line
(it should match higher lows if the market is bullish ;
it should match lower highs if the market is bearish ).
Once the trend line is confirmed by at least two touches and consequent reactions,
you can look for a confluence zone.
1️⃣Project a trend line and identify the next POTENTIAL touchpoint of the market with a trend line .
2️⃣Take the last impulse in the direction of the trend.
Draw a fib retracement based on it
(swing low to swing high in case if the market is bullish ,
swing high to swing low in case if the market is bearish ).
3️⃣Take the previous impulse (it must be in the same direction as the initial one).
Draw a fib retracement based on it.
4️⃣Look for a match of retracement levels of the last two impulses and a projected trend line .
In case if two retracement fib.levels & trend line match, you found a confluence point.
5️⃣ Apply it as a safe entry point.
You will get a perfect trend following opportunity.
Let me know, traders, what do you want to learn in the next educational post?

DOW Jones Buy or Sell ?Pair : US30 ( DJI - Dow Jones )
Description :
Impulse Correction Impulse
Completed " 1234 " Corrective Pattern
Divergence
S / R Level
Symmetrical Triangle as a Corrective Pattern need to wait until it Breaks the Upper or Lower Trend Line

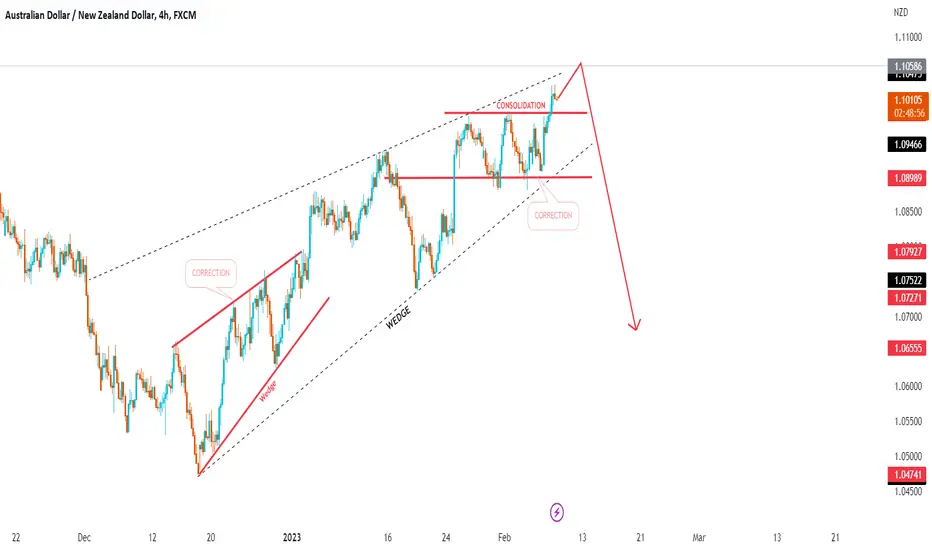
AUDNZD Next Move ? Breakout or RejectPair : AUDNZD ( Australian Dollar / New Zealand Dollar )
Description :
Rising Wedge as a Corrective Pattern in Long Term and Short Term
We have Consolidation Phase and Breakout the Upper Trend Line and Completing the Retracement
S / R Level
Divergence
Fibonacci
Dogecoin trendline, key levelsI expect the DOGE to follow the trend line to the next resistances, after it breaks the secondary trend line.
D1:

Best advice for achieving success in trading!✅Here's the deal, guys. If you want to make this year a successful year in trading, you got to have an edge. It doesn't have to be rocket science, just a solid strategy. There are plenty of resources out there, so don't be shy to do your research. Once you got a strategy, test it out with a small account or paper money before committing fully.
And when you commit, commit fully. Don't be that person that changes their mind after one loss. Ignore the noise on social media and focus on your own system and 'PnL. It's none of your concern how other people are trading.
Don't buy the hype. You're not going to turn chump change into a fortune overnight. Trading has its ups and downs. So, don't be caught off guard and expect the unexpected. And always be ready for the ride.
And here's the truth, not every trade will be a winner. But there will be a select few that'll make up for the majority of your 'PnL increase. Just make sure you have enough capital to cover 'bills, taxes, and other boring stuff.
And don't be dumb and emotional. Risk management and trading psychology are crucial. If you're having panic attacks before executing a trade, it's a sign you're either not suitable for trading or you're taking excessive risks. Take a step back and assess your current financial situation and the amount of money you're putting in.
Embrace failure as fuel. It's not a setback, but a lesson in disguise. Realize that success is not a straight path, but a journey full of ups and downs.
And lastly, come prepared. Write down a plan for each day, whether it's a simple excel sheet or a written plan. It'll help you stay focused and aware of what's happening in the markets. And remember, trading is hard. Don't fall for the social media hype that makes it seem easy.
Happy trading!

NASDAQ - double bottom, channel upThe price is moving up in a ascending channel, broke a strong level. After a pullback I expect further upside until the next significant resistance.
D1:
Good trading!
If you find it useful, like, follow, share!

Learn to Read the Strength of the Candlestick | Trading Educati
What it is?
Candlestick rejection strategy is a pure price action swing trading strategy. It makes use of the concept of price rejection or candlestick rejection patterns to invalidate counter-trend momentum for a trade continuation.
By applying such candlestick rejection strategy onto swing trading, it allows trades to capture spots at which market prices are at rest during retracements before rejoining back the existing dominant trend.
How to use?
Some trade recommendation for such candlestick rejection strategy is to use it as a candlestick rejection pattern on counter-trend moves. This means that we pick candlestick rejection pattern only for the sake of searching for breakout continuation with the dominant trend at counter trend waves.Entry can be made after the breakout occurs at the high or low of The Mother Bar and stop loss order can be placed at the opposing breakout side's high or low.
Further trade help can also be incorporated to help increase the trade's probability of success. For instance, it can be used together with other technical tools such as dynamic moving averages and Fibonacci retracement tool. Some may even want to consolidate other trading strategies to further increase trade’s probability of success.
✅LIKE AND COMMENT MY IDEAS✅
Please, like this post and subscribe to our tradingview page!👍

PEPSI - Ascending channel patternThe price is moving up in a ascending channel, that has reached its bottom, so I expect a rebound.
D1:
Good trading!
If you find it useful, like, follow, share!

EURUSD analisys, key levels, sell opportunityI expect a fall because the EURUSD has reached a strong resistance level.
H4: the EURUSD pair reached the upper part of the channel.
Weekly: the price is testing the fibo 50 level, and reached a strong trend line.
Good trading!

Why you should only think about charts when looking at chartsHello?
Traders, welcome.
If you "Follow", you can always get new information quickly.
Please also click "Boost".
Have a nice day.
-------------------------------------
When looking at the investment market, the first thing to do is to analyze the chart, and I wanted to say that the most important thing is how to create a trading strategy that suits your investment style with that chart.
-------------------------------------------------
Most people try to predict the movement of the investment market by looking at the announcement of various economic indicators and the contents of global issues (war, corona, etc.).
A big issue must be something that can cause great volatility in the investment market, but it is also clear that when such an issue accumulates, it can no longer create volatility.
So, you should be careful that trying to predict the movement of the investment market with such issues can make a wrong prediction.
Sudden big issues For example, in the case of a global shock due to an issue such as the 9/11 terrorist attack, it may cause great volatility without time to respond.
Other than these issues, most of the chart's price movement will react first.
In order to see this pre-reflection in advance, you need to look at the chart without reflecting factors that can change your psychological state, such as the announcement of various economic indicators or global issues.
I don't think this kind of work is a big deal, but it is a very important factor that occupies a fairly important part of investing.
We need to think a lot about how to figure out the trend only with the movement of the chart, away from the announcement of various economic indicators and thoughts about global issues.
As it rises above the indicator called Low, which was created on June 19, 2022, we can see that it is splitting the flow of the chart in half.
A change in the -100 indicator has always completed a low.
Although it is currently showing a different look than before, it will form a low as long as the -100 indicator is created.
The +100 indicator is an indicator that starts generating when a high is formed.
Therefore, a rise above the +100 indicator means that the uptrend to break the high is likely.
Therefore, in order to show a full-fledged uptrend from the current price position, it must rise above 38K.
The high point has been holding for a long time now.
However, the low point has not yet formed a clear point due to the change of the -100 indicator.
However, as the -100 point is moved near the current price range, the possibility of forming a low is very high.
This shows that we are facing a new trend.
Keeping the price above 17941.69 is most important from a short-term perspective to create this new trend.
The next most important thing is to keep the price above 20552.75.
Then, it completes the appearance of a trough (a phenomenon in which the price drops more before making a bigger rise) before showing an uptrend.
The StochRSI indicator is showing a fairly rapid decline.
We will verify what we said above by looking at where the Stoch RSI indicator finds support and resistance when it turns upside down.
This change in support and resistance points can tell you which direction the movement of the current chart is about to head.
You may think my explanation is inconclusive, but the conclusion has already been drawn.
We live in a flood of information.
It is quite difficult to infer an objective conclusion by synthesizing such a large amount of information.
Therefore, it is necessary to objectify all information using objectified tools and indicators.
Many celebrities' chart analysis methods and trading methods are introduced on the Internet or in books.
In order to make the contents of these people my own, it can only be acquired through numerous transactions and numerous experiences.
Over time, trends change and all patterns change and evolve.
In order to read the chart in line with these changes, I think it is better to use a simpler and faster way to analyze.
This is because you can keep up with the ever-changing trends.
It is more important to make your own mental state stable due to volatility by investing more time in the trading strategy than the time used for analysis.
What do you guys think?
-------------------------------------------------- -------------------------------------------
** All descriptions are for reference only and do not guarantee profit or loss in investment.
** If you share this chart, you can use the indicators normally.
** The MRHAB-T indicator includes indicators that indicate points of support and resistance.
** Check the formulas for the MS-Signal, HA-Low, and HA-High indicators at ().
** SR_R_C indicators are displayed as StochRSI (line), RSI (columns), and CCI (bgcolor).
** The CCI indicator is displayed in the overbought section (CCI > +100) and oversold section (CCI < -100).
(Short-term Stop Loss can be said to be a point where profit or loss can be preserved or additional entry can be made by split trading. This is a short-term investment perspective.)
---------------------------------

Polkadot key levels, support and resistance levelsThe primary trend is short. DOT has reached the resistance zone. We are waiting for the secondary trend to break.
Key levels
Supports levels:
4.300
3.800
Resistance levels:
4.700
5.100
5.700

EURAUD - Long EOD set upThe technicals give me the signal but if anyone is interested in rate hikes and fundamentals, may be take a slice of advice from Bank of America.
© Oliver Levingston
Merrill Lynch (Australia)
oliverllewellyn.levingston@bofa.com
• The RBA will likely deliver a third consecutive 25bp hike next week. A cooler monthly inflation print has investors betting on a lower terminal rate in 2023
• The AU curve still looks too steep and we see inflation risks as increasingly skewed to the upside.
Slowing down, not a slowdown
We expect the Reserve Bank of Australia (RBA) to hike the cash rate by another 25bp to 3.1% at its 6 December meeting. Markets are pricing in a 76% chance of a 25bps hike (24% chance of a pause) as at the time of writing. The message will echo its determination to keep the economy on ‘an even keel’, balancing the challenge of suppressing rising inflation with the risk that rate hikes could tip the economy into recession.
The RBA has moved cautiously on rate hikes: not only was it slow to lift off, waiting until May 2022 to do so; it also surprised markets by downshifting to a 25bp hike in October, becoming the first major DM central bank to slowdown the pace of rate increases. It then stuck to its gradual hiking pace at its November meeting, despite a strong 3Q CPI print (see RBA review: Sticking to 25, 1 November 2022). The RBA has cited the high frequency of its meetings – the RBA meets 11 times, the FOMC and ECB each have 8 meetings scheduled per year – as a reason why it can afford to take a gradual approach.
Market pricing reflects increasingly dovish sentiment – markets are now pricing rates to rise to just 3.5% in mid-2023, down about 30bps in a month. Optimism on rates grew after the RBA’s monthly CPI for October, released on 30 November, showed both the headline inflation slowing to 6.9%YoY (vs. 7.3% in Sep) and the trimmed mean measure easing to 5.3%YoY (5.4% in Sep). However, we caution that for October, the new monthly series contains only 62% of the price data used in the Australian Bureau of Statistics’ (ABS) quarterly CPI – it omits, for example, new information on many administered prices such as utilities, which are not priced until the final month of the quarter.
For these reasons, the RBA has stated that “the quarterly CPI is likely to remain the principal measure of CPI inflation in Australia for the foreseeable future,”1 making it premature to call for a peaking in inflation based on the October monthly CPI print. Nor does it change the fact that inflation is likely to remain well above the RBA’s target band of 2-3%.
Yet the RBA will likely remain less hawkish than its counterparts overseas. Australia’s Wage Price Index (WPI) has only recently started to pick up above 3%. The RBA does not yet see signs of a wage-price spiral, though it has stressed the need to remain vigilant. It noted in its November Statement on Monetary Policy (SMP) that “reports of higher labour costs contributing to price increases have so far been largely contained to price increases have so far been largely contained to a few specific sectors.” A softer retail trade print (-0/2% MoM) and Governor Lowe’s apology before the Senate for the RBA’s (abandoned) promise to hold interest rates steady out to 2024 have added to growing expectations of a lower terminal RBA rate.
For these reasons, the risk of a recession in AU in 2023 remains a low probability and the risks to inflation remain skewed to the upside, in our view. The RBA’s restrained approach, sustained strength in the labour market and a continued boost from a record term of trade make an economic contraction less likely than peers. We do not have cuts in our profile.
Waiting for the wave
The main risk reflected in market pricing and the RBA’s published commentary is that households have not yet sustained the full impact of rate hikes. We have pencilled in hikes until May 2023 just before the mortgage rate reset wave accelerates in mid-2023. The maturity profile of fixed-rate mortgages taken out when lending rates were as low as 2% suggests the “cliff” may have traction. The line of questioning at Governor Lowe’s attendance before the Senate Economics Legislation Committee and public speeches from the RBA confirm that fixed-rate mortgage resets are at the front of their minds when they consider risks to the economy.
Yet Australia continues to enjoy meaningful protection from downside risks, in our view. A positive terms-of-trade shock that has reduced Australian Government funding requirements also means the challenges of housing headwinds should be easy for policymakers to counteract should we see signs of household distress in 2023. At the same time, a long period of low unemployment is likely to generate higher wages and partly offset the dampening effect of rising loan payments on consumer demand, reducing the risk of a housing-led downturn. On the upside, the prospects of a substantial shift away from COVID Zero policies in China continue to gather pace as a steady stream of announcements suggest the country is like to gradually reopen in 2023. The Chinese reopening could boost Australian GDP and increase the scope for the RBA to tighten rates further.
We see the RBA holding rates at 4.1% from May 2023. A rise in cash rates and signs of economic resilience should mean a flatter curve. We have also maintained a view that the AU 2s10s curve is too steep relative to other developed markets (a positive slope of 40bp for AU government bonds compared to -72 for the US). We continue to like a box flattener (AU steepener vs US flattener) and outright AU curve flatteners.

GBPJPY - EOD long entry ideaFollowing on from the bullish signal in the EURJPY, a few days ago we had a GBPJPY long signal setup. Still waiting for a trigger and also due to the Central Banks this week, I wanted to hold off from publishing it.
We have now had the Fed, BoE and ECB, so feel better that this is still pending to go long.

EURJPY long End of Day trend follower (EOD)Here is what the fundamentals are following the ECB rate decision today, words from ©Lloyds Bank
European Central Bank (Dec): We're not pivoting
The European Central Bank (ECB) raised interest rates today by 50bps, in line with expectations. It follows 75bp hikes in the last two meetings in September and October, and a 50bp rise in July. There was broad agreement (not unanimity) on the decision and it brings the deposit rate up to 2%. There were similar increases in the main refinancing rate and the marginal lending rate to 2.5% and 2.75%, respectively. Policy rates have been raised by a total of 250bp since July (Chart 1).
Although the hiking pace was reduced today, the ECB warned that interest rates will “still have to rise significantly” and that they will be kept at “restrictive levels” to dampen demand and guard against second-round effects on inflation. President Christine Lagarde indicated that more 50bp rises could occur early next year (the next update is on 2 February). She said, “we’re not pivoting” and that the ECB is “in for a long game” and there is more ground to cover.
Current inflation was described as “far too high” (Chart 4) and forecast to stay above target for what is seen as “too long”. The ECB’s new quarterly economic projections upgraded inflation for 2023 to 6.3% (from 5.5%) and for 2024 to 3.4% (from 2.3%). The first forecast for 2025 is 2.3%, still above the 2% target (Chart 2). The ECB envisages a “short and shallow” recession – while next year’s GDP growth was revised down to 0.5%, it remains above the consensus forecast (Chart 3).
Detail on the start of quantitative tightening (QT) – the reversal of QE – was also provided today. The ECB said that from March it will no longer reinvest fully the proceeds from maturing assets held in its Asset Purchase Programme (APP) portfolio. From March until the end of Q2 next year, the average decline will be €15bn a month, meaning that about half of estimated redemptions wil be reinvested (Chart 7). This degree of detail could also be interpreted as hawkish, because it reinforces the impetus to reduce the ECB’s balance sheet (Chart 6).
Overall, while today’s interest rate decision was expected, the messaging was nevertheless surprisingly hawkish. There seems to be increasing disquiet about persistent upside surprises to inflation and the extended period in which it is expected to remain above target, while the economic downturn is now perceived as potentially less severe than previously feared. The market reaction saw the euro rise above $1.07 for the first time since June, while the pound fell below €1.15. Markets now expect the ECB ro raise interest rates above 3% next year.
Hann-Ju Ho
Senior Economist
That may be the fundamental reason and may be I am a little early in my trade idea as today's candle hasn't closed.I am assuming that we don't make a new higher high before the end of the NYC session.
