TRB/USDT 1DAY UPDATE AND 4HOUR UPDATE BY CRYPTOSANDERS !!Hello friends, welcome to this BITCOIN update from Crypto Sanders.
Chart Analysis:- 1-day update TRB USDT is bouncing back from fib retracement label 0.5 by breaking out in a triangle pattern and entry-level would be good to take around 0.382 which has a very small stop loss and for long-term TRP USDT will be right.
4 Hour You can see in the chat that the TRB/USDT up trend is going up trend and its support label is 100 MA and the entry level is around $120. Stop loss will be small and it is trading for a long time. Make sure to set end-stop loss.
This is not a piece of financial advice.
I have tried to bring the best possible results in this chart.
If you like it, hit the like button and share your charts in the comments section.
Thank you.
TRBBTC

TRB UPDATE (4H TF)This is the question of many fans of risky coins, what will happen to TRB. There is no doubt that TRB is in the correction phase.
Given the correction that is forming and the waves that have formed, it looks like we have a diametric. From the supply range, we can move towards the demand range.
For risk management, please don't forget stop loss and capital management
Comment if you have any questions
Thank You

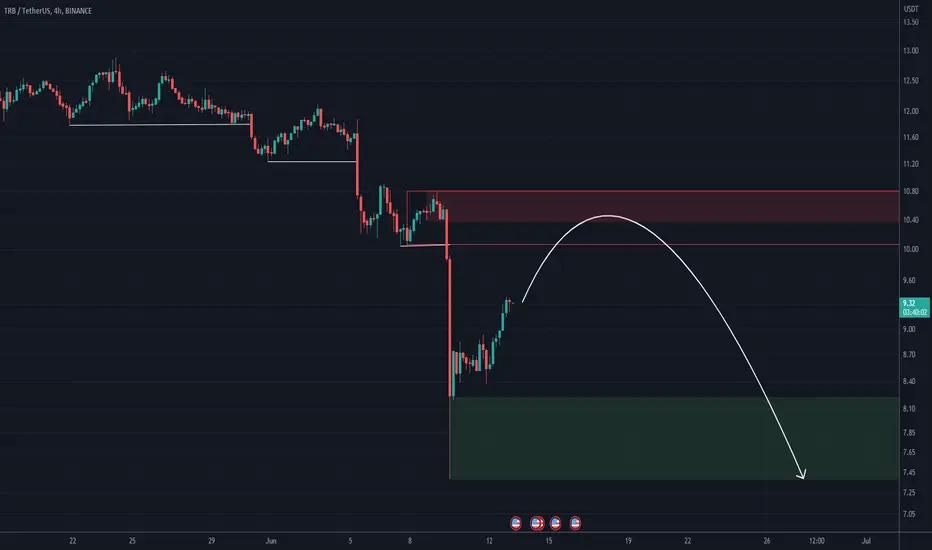
TRB/USDT: Perfect Entry is around the corner 🍀After BINANCE:TRBUSDT crashing around 50% within a week, we can see a slow consolidation with signs of recovering the price.
If we look at the patterns we can see a strong consolidation with strong resistance pushing the price back.
I think TRB has a good potential to reach 140$ again if we get a strong breakout of the price.
In the coming days we can see price getting rejected again at the resistance and i'm expecting the price to breakout successfully after few rejections.
We can enter a LONG trade after the succesful breakout.
We will update this ideas when we enter the trade.
Stay tuned for more updates. Like and share your thoughts in the comments. Your contribution is much appreciated.
Cheers!
GreenCrypto

TRB analysis🛑 Note: This coin is a risky coin, and both long and short positions on this coin are risky.
Following the advertisements of Huobi and Kucoin exchange in social networks, we saw the pump of this currency and it has made many non-technical moves to liquidate small traders and stop hunting them.
It can have a pullback to the red zone and then witness the main drop. If it reaches this area, it can enter a sell/short position with a stop.
For risk management, please don't forget stop loss and capital management
Comment if you have any questions
Thank You

Hunt this TRB positionHi, dear traders. how are you ? Today we have a viewpoint to SELL/SHORT the TRB symbol.
For risk management, please don't forget stop loss and capital management
When we reach the first target, save some profit and then change the stop to entry
Comment if you have any questions
Thank You

TRB has become dangerousIt looks like a triple rising structure is finished.
The first structure seems to have been a diametric one, the second one a zigzag one, and the third one a diametric one.
If a pullback is made to the red zone, it can be an opportunity for a sell/short option
For risk management, please don't forget stop loss and capital management
Comment if you have any questions
Thank You

TRB RED RECOVERY Thanks for reading this update, this update is not trading advice.
TRB seems to have entered a new recovery
We did expect before the increase of TRB from $48
This is the trading world, and every coin comes at a moment of recovery.
The speed of the trend and time frame can be a difference

TRB COIN PRICE ANALYSIS AND NEXT POSSIBLE MOVE!!LSE:TRB Coin Next Possible Moves Near Me !!
• TRB Coin Price almost look overbought too much on tf charts.... Maximum chances Now we see healthy correction in its price.
• Small bounce expected From its Local supports = 92$-76$.
• May Be whales again start accumulate it From 60$-55$.
• In Next few weeks 70%-80% chances we see TRB Coin Price at 60$ or Below From this level.
FOLLOW US FOR MORE FREE ANALYSIS !!

TRB is still falling!As we go further, we can see different scenarios for TRB on the chart.
After hitting TP 1 of the previous analysis, we saw the TRB pump.
By re-examining the TRB, it seems that the bearish triangle is being completed.
This falling triangle whose D wave is time-consuming and has become a diametric is also one of the valid TRB scenarios.
Do not enter the position without capital management and stop loss setting.

TRB's bull run is overTRB has been climbing for a long time and is up around 600%. It has reached an important resistance range that, in my opinion, cannot climb any further.
The red box is a suitable place for SELL/SHORT positions.
I also specified the invalidation level, closing a daily candle above this level will cause an analytical violation.
For risk management, please don't forget stop loss and capital management
I specified two tps .When we reach the first target, save some profit and then change the stop to entry
Comment if you have any questions
Thank You

TRBUSDT again. It's time to go Down #TRBUSDT again. It's time to go Down ..Check my previous analysis about #TRB. That time we are Long but this time we want to stop hunt early buyers..
!! Jai Shree Ram !!
Namaste 🙌

IMP zone for TRBYellow one is an important zone. if bulls win then TRB will go up to 80 dollars and if bears win then, TRB will easily go down to 20 dollars...

Is TRB in Bull Run?As we can see, TRB has made many climbs and broken many resistances.
By checking the chart, I realized that the serious TRB resistance is where I marked with the red box and there is a possibility of rejection there.
Until the price reaches this price box, sell/short positions are dangerous.
To reduce the risk, we can wait for confirmation after hitting the red box.
The green box is also an important and relatively strong support that can be used for the target.
I specified the invalidation level. Closing a 1-day candle above this level violates the analysis.

Short Entry upon Wedge Breakdown for TRBGreetings, Snipers!
TRB has risen over 200% in less than a month during a bear market
The pump and dump forms a rising wedge
In the shorter timeframe, there is a clear diagonal support
We can short once there is a breakdown of this support.
TP1 at $24.4
TP2 at $16.6
Please ensure risk management and stop-loss (trailing $31, $34, $36 for futures) as this coin has a pump-and-dump nature. There is a price discrepancy with TRB futures, so beware of the funding rate.
Happy Sniping!

TRBUSDT Buy Setup!TRBUSDT Technical analysis update
Buy zone : Below $16.80
Stop loss : $15.05
Take Profit 1: $18.30
Take Profit 2 : $22.00
Take Profit 3 : $29.50
Take Profit 4 : $43.50
Thanks
Hexa

TRB LOOKS BULLISH (1D)Hi, dear traders. how are you ? Today we have a viewpoint to BUY/LONG the TRB symbol.
For risk management, please don't forget stop loss and capital management
When we reach the first target, save some profit and then change the stop to entry
Comment if you have any questions
Thank You

TRB ANALYSIS (4H)Hi, dear traders. how are you ? Today we have a viewpoint to SELL/SHORT the TRB symbol.
For risk management, please don't forget stop loss and capital management
When we reach the first target, save some profit and then change the stop to entry
Comment if you have any questions
Thank You
TRBUSD is breaking out - LONG NOW (27 % gains)TRBUSD is breaking out on daily right now
Buy now, sell at 20 -21 $
TRB looks very bullish short-term
Good luck

$TRB/#BTC [#Tellor]: BBand_Breakout Resistance_Breakout_ConfirmaHey traders, Hey traders, we've identified bullish signals on the $TRB / $BTC chart through the detection of both a Bollinger Band breakout and a Resistance Breakout. The Bollinger Band indicates a potential bullish trend as the price has moved outside of the upper band, while the Resistance Breakout confirms this trend by showing the price breaking above a key resistance level. Given the alignment of these signals, it may be a good idea to consider entering a long position and targeting higher levels. Our analysis indicates that the key resistance levels are at 0.000901 | 0.001009 | 0.001243 and the major support zones are at 0.000667 | 0.000541 | 0.000307. However, it is important to also consider other factors such as overall market conditions and other technical indicators before making a trade decision.
Technical Metrics :
Current price: 0.000833
24H Volume: 13.2461 Ƀ
24H Price change: 6.795%
- Pivot Points - Levels :
Resistance: 0.000901 | 0.001009 | 0.001243
Support: 0.000667 | 0.000541 | 0.000307
Indicators recommandation :
Oscillators: NEUTRAL
Moving Averages: STRONG_BUY
Technical Indicators Summary : BUY
- In-depth TRBBTC technical analysis on > Tradingview TA page

$TRB #TRB | LTF SHORTThe lower bound of red box most probably will work as resistance so i looking at bearish breakers around $13.36 . If the price loses red box, the price may dump more than we expect.
Have a nice week!

$TRB #TRB | LTF LONGIf the price passes red line, I expect price visits to upper levels like 15.2 & 15.4.
If the price closes below 14.44 , I expect price visits to lower levels like 13.8.
For short-term trading: Focus on 14.17 & 14.21.
Have a nice week!

TRB CAN GO UPPERI think this currency has the ability to rise. Static and dynamic resistances have been broken. Do not trade without setting stop and capital management

TRB SELL TRADE SETUPHello, dear traders. how are you ? Today we have a setup to buy/long the TRB symbol.
For risk management, please don't forget stop loss and capital management
