USDJPY - Long Done, Soon Short!Hello TradingView Family / Fellow Traders. This is Richard, also known as theSignalyst.
📈As per our last USDJPY analysis, it rejected the orange support zone and has been trading higher.
What's next? As USDJPY approaches the upper blue trendline, we will be looking for shorts.
🏹 The highlighted red circle is a strong area to look for sell setups as it is the intersection of the upper blue trendline and green supply zone.
📚 As per my trading style:
As #USDJPY retests the red circle zone, I will be looking for bearish reversal setups (like a double top pattern, trendline break , and so on...)
Meanwhile, USDJPY would remain bullish medium-term and a bullish continuation towards the red circle is expected.
📚 Always follow your trading plan regarding entry, risk management, and trade management.
Good luck!
All Strategies Are Good; If Managed Properly!
~Rich
Disclosure: I am part of Trade Nation's Influencer program and receive a monthly fee for using their TradingView charts in my analysis.
Trend

USDJPY Potential UpsidesHey Traders, in today's trading session we are monitoring USDJPY for a buying opportunity around 143.500 zone, USDJPY is trading in an uptrend and currently is in a correction phase in which it is approaching the trend at 143.500 support and resistance area.
Trade safe, Joe.

Fartcoin: Is the Smell of a Downtrend in the Air? 📉 Fartcoin: Is the Smell of a Downtrend in the Air? 💨
🚨 Alert: The RSI is holding its nose... and so should we.
After a suspiciously bubbly rally, $FARTCOIN is now showing bearish RSI divergence on the 4H chart — and let’s be honest, it’s starting to stink. 🦨
The recent price action looks like someone tried to pump it... but forgot to ventilate. 💣💨
🧻 Support is about to get wiped.
💩 MACD says momentum is going down the drain.
🚽 Volume drying up like gas after Taco Tuesday.
TA Summary:
RSI Divergence ✅
Rising wedge (aka clogged pipes) ✅
Community still in denial? ✅

DOGE - 1$ NextDoge is getting ready for the next wave. Based on the previous trend we are looking at the next target around 1.1$.
Doge can break 1$ easily based on the current trend and overall interested in DOGE.
Entry: 0.1766
TP1: 0.22086
TP2: 0.30439
TP3: 0.40104
TP4: 0.53436
TP5: 1.13587
Stop Loss: 0.1143
Follow us for more such ideas.
Cheers
GreenCrypto

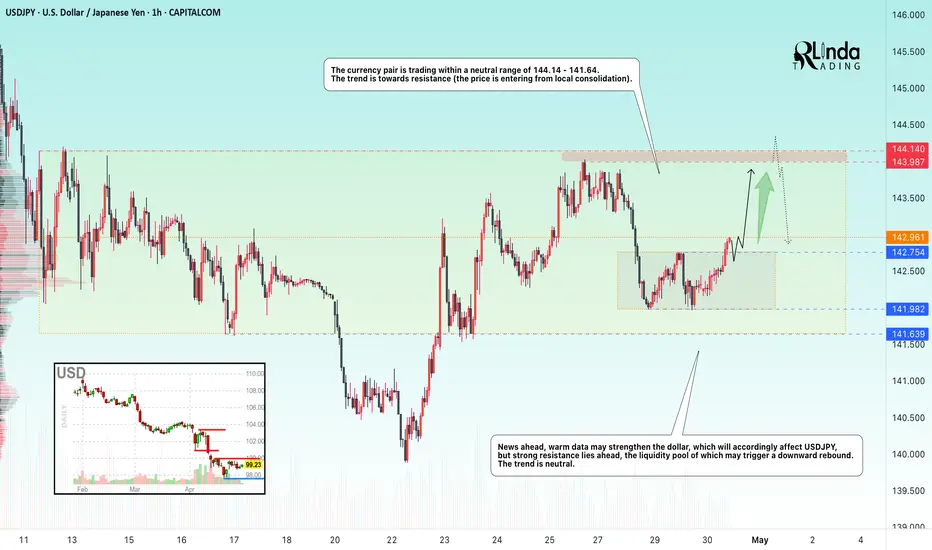
USDJPY → Price in range, retest of resistanceFX:USDJPY is emerging from local consolidation in hopes of seeing economic data that could support the dollar. The target for this movement could be the liquidity zone at 144.00.
The currency pair is trading within a neutral range of 144.14 - 141.64. However, a local consolidation has formed within the range, from which the price has broken out. The main task for the bulls is to hold the defense above 142.75, in which case we will be able to catch the price distribution to the upper border of the global range of 144.14.
News ahead, positive data may strengthen the dollar, which will accordingly affect USDJPY, but there is strong resistance at 144.14, whose liquidity pool may trigger a downward rebound. The trend is neutral.
Resistance levels: 143.9, 144.14
Support levels: 142.75, 141.98
There are no reasons to exit the global range. Over the past two weeks, this will be the first retest of the 144.14 zone, which in general only increases the chances of a false breakout and correction.
Best regards, R. Linda!
$16.50 to $39 in less than 24 hours Uptrend was too good to pass on at $16 so I said this could continue uptrending to $30, $40.
The next morning it goes on a power vertical into $40 area NASDAQ:CEP
Congrats if you saw my messages and jumped in!

EURUSD is Trading Under the Pressure of a Strong DollarHey traders, in today's trading session we are monitoring EURUSD for a selling opportunity around 1.13500 zone, EURUSD is trading in a downtrend and currently is in a correction phase in which it is approaching the trend at 1.13500 support and resistance area.
Trade safe, Joe.

ETH - Longs on the Go!Hello TradingView Family / Fellow Traders. This is Richard, also known as theSignalyst.
📈ETH has been overall bullish from a medium-term perspective trading within the rising channel marked in blue.
Moreover, the red zone is a strong resistance turned support!
🏹 Thus, the highlighted blue circle is a strong area to look for buy setups as it is the intersection of support and lower blue trendline acting as a non-horizontal support.
📚 As per my trading style:
As #ETH approaches the blue circle zone, I will be looking for bullish reversal setups (like a double bottom pattern, trendline break , and so on...)
📚 Always follow your trading plan regarding entry, risk management, and trade management.
Good luck!
All Strategies Are Good; If Managed Properly!
~Rich

GBPNZD - Marco Trend Still Up!Hello TradingView Family / Fellow Traders. This is Richard, also known as theSignalyst.
📈GBPNZD has been overall bullish from a macro perspective trading within the rising channels in blue and orange.
Moreover, the green zone is a strong support, structure and demand.
🏹 Thus, the highlighted blue circle is a strong area to look for buy setups as it is the intersection of support and lower orange/blue trendlines acting non-horizontal support.
📚 As per my trading style:
As #GBPNZD approaches the blue circle zone, I will be looking for bullish reversal setups (like a double bottom pattern, trendline break , and so on...)
📚 Always follow your trading plan regarding entry, risk management, and trade management.
Good luck!
All Strategies Are Good; If Managed Properly!
~Rich
Disclosure: I am part of Trade Nation's Influencer program and receive a monthly fee for using their TradingView charts in my analysis.

EURAUD - Long-Term Correction in the Making!Hello TradingView Family / Fellow Traders. This is Richard, also known as theSignalyst.
📈EURAUD has been bullish trading within the rising channel in blue.
Currently, EURAUD is retesting the upper bound of the channel.
Moreover, the $1.84 - $1.87 is a strong weekly resistance zone.
🏹 Thus, the highlighted red circle is a strong area to look for sell setups as it is the intersection of the upper blue trendline and green resistance zone.
📚 As per my trading style:
As #EURAUD is hovering around the red circle zone, I will be looking for bearish reversal setups (like a double top pattern, trendline break , and so on...)
📚 Always follow your trading plan regarding entry, risk management, and trade management.
Good luck!
All Strategies Are Good; If Managed Properly!
~Rich
Disclosure: I am part of Trade Nation's Influencer program and receive a monthly fee for using their TradingView charts in my analysis.

GBPUSD - Bearish Pressure Soon!Hello TradingView Family / Fellow Traders. This is Richard, also known as theSignalyst.
📈As per our last GBPUSD analysis, it rejected the $1.27 - $1.28 support zone and has been trading higher.
This week, GBPUSD is approaching the upper bound of its rising wedge pattern marked in red.
Moreover, the blue zone around $1.34 is a strong resistance and previous weekly high.
🏹 Thus, the highlighted red circle is a strong area to look for sell setups as it is the intersection of the upper red trendline and resistance.
📚 As per my trading style:
As #GBPUSD retests the red circle zone, I will be looking for bearish reversal setups (like a double top pattern, trendline break , and so on...)
📚 Always follow your trading plan regarding entry, risk management, and trade management.
Good luck!
All Strategies Are Good; If Managed Properly!
~Rich
Disclosure: I am part of Trade Nation's Influencer program and receive a monthly fee for using their TradingView charts in my analysis.

Bitcoin Bullish for ShortermBitcoin currently trade around $93,911 having broken resitance above $88,000-$89,000 zone. The breakout, supported by strong volume, positions Bitcoin favorably for further gains, although a short-term pullback appears likely.
Technical indicators remain bullish:
Price holds above the 21-EMA and 30-SMA, both beginning to slope upward.
Quarterly VWAP levels at $89,485 and $84,484 provide strong support.
The Volume Profile suggests heavy buyer interest around $84,000–$86,000.
A minor retracement toward $88,000–$89,000 could precede a consolidation phase before Bitcoin targets $96,000 and eventually the psychological $100,000 mark.
Bitcoin remains in a strong position. Tactical patience and disciplined risk management will be key to capitalizing on the next major move.

NVDIA Death Cross Quant Perspectives (Light Case Study)NASDAQ: Nvidia (NVDA ) has recently experienced an uptrend after a death cross formed consisting of the 65 and 200 EMAs on the 1 Day chart.
If we analyze back on Nvidia starting in 1999 , we can count a total of 10 death crosses that have occurred, and 9 have been immediately followed by downtrends. Although a single death cross did not have an immediate downtrend, shortly after this event (approx. 282 days) another death cross formed and price then fell roughly twice as it historically has , almost appearing to make up for the missed signal.
From a quantitative perspective:
If we calculate the raw historical success rate using:
Raw Success Rate = 9/10 = 90
With this calculation the observed success of 65/200 EMA death crosses correlating to an immediate downtrend is 90%
In order to avoid overconfidence we can apply Laplace smoothing using:
Smoothed Probability = 9+1/10+2 = 10/12 or 0.8333
With this calculation the observed success of 65/200 EMA death crosses correlating to an immediate downtrend is 83%
Given the results of the data I personally feel that there is a Very High (83%) chance this death cross that recently formed on the 1 Day chart (around 04/16/2025) will immediately lead to a downtrend. And a Low (17%) chance it does not. Furthermore these results support a technical analysis hypothesis that I formed prior.
Many different systemic factors can contribute to the market movement, but mathematics sometimes leave subtle clues. Will the market become bearish? Or will Nvidia gain renewed bullish interest?
Disclaimer: Not Financial Advice.

INJ Is Nearing An Important SupportHey Traders, in today's trading session we are monitoring INJ/USDT for a buying opportunity around 9.90 zone, INJ/USDT is trading in an uptrend and currently is in a correction phase in which it is approaching the trend at 9.90 support and resistance area.
Trade safe, Joe.

USDJPY - Already Over-Sold!Hello TradingView Family / Fellow Traders. This is Richard, also known as theSignalyst.
📈USDJPY has been overall bearish trading within the falling wedge pattern marked in blue and it is currently hovering around the lower bound of it.
Moreover, the orange zone is a strong weekly support.
🏹 Thus, the highlighted blue circle is a strong area to look for buy setups as it is the intersection of support and lower blue trendline acting as a non-horizontal support.
📚 As per my trading style:
As #USDJPY approaches the blue circle zone, I will be looking for bullish reversal setups (like a double bottom pattern, trendline break , and so on...)
📚 Always follow your trading plan regarding entry, risk management, and trade management.
Good luck!
All Strategies Are Good; If Managed Properly!
~Rich
Disclosure: I am part of Trade Nation's Influencer program and receive a monthly fee for using their TradingView charts in my analysis.

Gold is still Strong; Long-Term!Hello TradingView Family / Fellow Traders. This is Richard, also known as theSignalyst.
📈GOLD has been overall bullish from a macro perspective trading within the rising wedge pattern in orange.
After rejecting the $3,500 round number and upper bound of the wedge, XAUUSD signaled the start of the correction phase.
Moreover, the $3,100 - $3,150 zone is a strong support.
🏹 Thus, the highlighted blue circle is a strong area to look for buy setups as it is the intersection of support and lower orange trendline acting non-horizontal support.
📚 As per my trading style:
As #XAUUSD approaches the blue circle zone, I will be looking for bullish reversal setups (like a double bottom pattern, trendline break , and so on...)
📚 Always follow your trading plan regarding entry, risk management, and trade management.
Good luck!
All Strategies Are Good; If Managed Properly!
~Rich
Disclosure: I am part of Trade Nation's Influencer program and receive a monthly fee for using their TradingView charts in my analysis.

LanzaTech (LNZA). Extremely oversold! Rally incoming?NASDAQ: LanzaTech (LNZA) , based in Illinois, USA, has recently has seen a price low of $0.1401 . This waste management company in recent times, has been featured as a top pick for buys by various news outlets. Although in an extremely bearish slump, I have a bullish prediction.
In the technicals on the 1 Day Chart , the RSI appears to be indicating oversold , with a slight potential of more of a dip to come. The Stochastic seems to also be indicating oversold market conditions. A long time frame bullish RSI divergence also appears to be forming starting at the middle of Feb 2023.
LanzaTech recently declined a "lowball" offer for $0.02 a share, which could signal insider bullish sentiment. LanzaTech FY25 Q1 earnings are forecasted to be significantly higher than FY24 Q4 at this time (RH). Their website, marketing and twitter appear to show no real signs of slowing business operations in my opinion.
Analysis also appears shows that there is very little open interest on put options at this time. Conversely there seems to be a large number of call options from $1-$7 expiring in the near future signaling institutions and high profile traders may be entering the market quietly.
Given the above signals and analysis I personally am setting a speculative stretch price target of $7 with various other orders taking profit along the way at key strike price cluster levels. With LanzaTech at a discounted price, a buy now could yield significant results.
Anything can happen in the markets. What do you think? Will LanzaTech recover? Or will value become completely wiped out?
Disclaimer: Not Financial Advice

BTC - Bullish Control, Confirmed!Hello TradingView Family / Fellow Traders! This is Richard, also known as theSignalyst.
🚀 As per my last two setups (highlighted on the chart), BTC rejected the $72,000 support and pushed higher with strength.
📈 This week, BTC broke above the $90,000 structure, confirming a shift in momentum from bearish to bullish.
🟢 For the bulls to stay in control, a break above the $95,200 resistance is still needed.
📊 In the meantime, as BTC retests the $89,000–$90,000 zone, we’ll be looking for medium-term trend-following longs to catch the next impulsive move.
📚 Reminder:
Always stick to your trading plan — entry, risk management, and trade management are key.
Good luck, and happy trading!
All Strategies Are Good, If Managed Properly!
~Rich

Victorias Secret (VSCO) Bull Run Incoming? Insider Signals?Victorias Secret & Co. (VSCO) Based in Ohio, USA has recently seen a dip in asset value to $16, but recovery could be imminent.
On the 1 Day chart both a bullish RSI divergence and CVD divergence seems to be forming. The DMI appears to show the bearish directional movement is slowing, and the ADX still remains above 20.
In march Insiders were reported to have purchased 1.92M shares. Conversely only 20,000 shares were sold by Insiders (Robinhood Analytics). Insider activity may indicate undisclosed company confidence.
The order book shows a decent number of open interest for $25.00. Subsequently this price target is located near key resistance areas that in my opinion, price will most likely touch in the near future.
Earnings are set to be released in May and traders and institutions may begin to price in fundamental factors before the report .
Given the above technical and fundamental signals, insider activity, and approaching earnings report. My hypothesis is bullish with a price target of $25.00 before 06/20/2025.
Will tariffs and politics stop VSCO's upwards movement? Or do the technicals and Insider moves signal a current discounted buy?
Disclaimer: Not financial advice.

NZDJPY - Following the Bears...Hello TradingView Family / Fellow Traders. This is Richard, also known as theSignalyst.
📈From a long-term perspective, NZDJPY has been overall bearish trading within the falling wedge pattern in red.
Moreover, the orange zone is a strong supply.
🏹 Thus, the highlighted red circle is a strong area to look for sell setups as it is the intersection of the upper red trendline and supply.
📚 As per my trading style:
As #NZDJPY approaches the red circle zone, I will be looking for bearish reversal setups (like a double top pattern, trendline break , and so on...)
📚 Always follow your trading plan regarding entry, risk management, and trade management.
Good luck!
All Strategies Are Good; If Managed Properly!
~Rich
Disclosure: I am part of Trade Nation's Influencer program and receive a monthly fee for using their TradingView charts in my analysis.

BTC - Bulls Charging... However!Hello TradingView Family / Fellow Traders. This is Richard, also known as theSignalyst.
As per our last analysis (attached on the chart), BTC rejected the blue trendline support and has been bullish in the medium term. 📈
However, the overall sentiment remains bearish, as BTC is still trading within the falling channel marked in red. 📉
For the bulls to take over long term and initiate the next impulsive wave, a break above the $91,000 major high in blue is needed. 🔵
Meanwhile, BTC may still retest the blue trendline — where we’ll be looking for new short-term longs. 🎯
📚 Always follow your trading plan regarding entry, risk management, and trade management.
Good luck!
All Strategies Are Good; If Managed Properly!
~Rich

NEAR/USDT is Nearing The Daily TrendHey Traders, in today's trading session we are monitoring NEAR/USDT for a selling opportunity around 2.55 zone, NEAR/USDT is trading in a downtrend and currently is in a correction phase in which it is approaching the trend at 2.55 support and resistance area.
Trade safe, Joe.

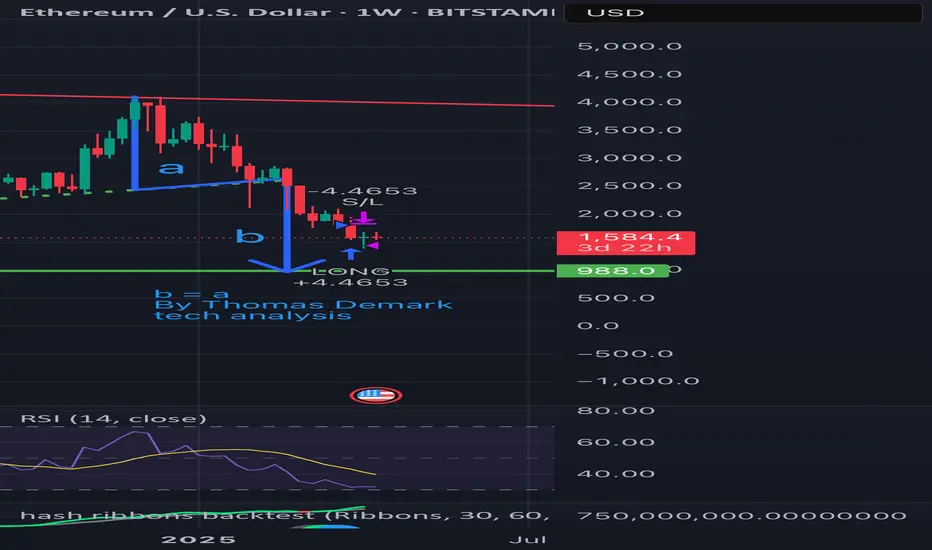
ETH is falling per Demark’s technical analysis: Target at $988?According to Thomas Demark’s method — when b = a, the next target for ETH is around $988.
📉 Price broke the ascending support
🔻 Wave “a” from $4000 to $2500 has already played out
📏 Wave “b” is projected downward — target aligns with a strong historical support zone
📊 Weekly RSI is nearing oversold territory
Conclusion: The $988 area is critical. A reversal may occur there if selling pressure weakens.
Stay sharp.
#ETH #Demark #CryptoAnalysis #TechnicalAnalysis #Ethereum