AUDCHF: Breaks Below Ascending TrendlineMy observations across the Daily (D1) and Hourly (H1) timeframes.
D1 timeframe:
My EMA20 is below the EMA 60. Price has ranged a bit longer than I anticipated, but we are now getting the indication that the downtrend is continuing.
Price is also below EMA20, which helps to signal momentum is picking up.
H1 Timeframe:
After price crossed below the daily ascending trendline, it stalled and then pulled back up. To some, this is a fakeout. To others, this is a liquidity trap.
I remained patient and found an opportunity to enter on the longer bearish bar, which shows price is pushing below prior lows after this breakout lower.
Trend

ETH - Eyes on a New All-Time High?ETHUSDT has been on fire lately, following a textbook bullish structure of Impulse → Fakeout → Impulse.
After breaking above the previous range in July, ETH confirmed strength with a sharp impulse move, only to shake out weak hands via a fakeout retest before pushing higher again. 📈
Currently, ETH is in the midst of another impulsive leg, with the next major target sitting at the ATH around $4,876.
📊 Key Notes:
- Fakeouts have served as liquidity grabs before strong rallies 🏹
- Current momentum favors the bulls 🐂
- As long as price holds above the last breakout zone (~$4,050–$4,150), the path of least resistance remains up.
🎯 Next Stop: ATH and beyond if bullish pressure sustains.
📚 Always follow your trading plan regarding entry, risk management, and trade management.
Good luck!
All Strategies Are Good; If Managed Properly!
~Richard Nasr

AUDUSD - Follow The Macro Trend!Hello TradingView Family / Fellow Traders. This is Richard, also known as theSignalyst.
📈AUDUSD has been overall bullish trading within the rising channel marked in blue.
This week, AUDUSD has been retesting the lower bound of the channel.
Moreover, the green zone is a strong weekly support.
🏹 Thus, the highlighted blue circle is a strong area to look for buy setups as it is the intersection of the lower blue trendline and green support.
📚 As per my trading style:
As #AUDUSD approaches the blue circle zone, I will be looking for trend-following bullish reversal setups (like a double bottom pattern, trendline break , and so on...)
📚 Always follow your trading plan regarding entry, risk management, and trade management.
Good luck!
All Strategies Are Good; If Managed Properly!
~Rich
Disclosure: I am part of Trade Nation's Influencer program and receive a monthly fee for using their TradingView charts in my analysis.

USDCHF - Follow The Bulls!Hello TradingView Family / Fellow Traders. This is Richard, also known as theSignalyst.
📈USDCHF has been overall bullish trading within the rising channel marked in blue.
This week, USDCHF has been retesting the lower bound of the channel.
Moreover, the green zone is a strong demand.
🏹 Thus, the highlighted blue circle is a strong area to look for buy setups as it is the intersection of the lower blue trendline and green demand.
📚 As per my trading style:
As #USDCHF approaches the blue circle zone, I will be looking for trend-following bullish reversal setups (like a double bottom pattern, trendline break , and so on...)
📚 Always follow your trading plan regarding entry, risk management, and trade management.
Good luck!
All Strategies Are Good; If Managed Properly!
~Rich
Disclosure: I am part of Trade Nation's Influencer program and receive a monthly fee for using their TradingView charts in my analysis.

EURUSD - One More Bearish Impulse Soon!Hello TradingView Family / Fellow Traders. This is Richard, also known as theSignalyst.
📈EURUSD has been overall bearish trading within the falling broadening wedge pattern marked in red and it is currently retesting the upper bound of the channel acting as a non-horizontal resistance.
Moreover, the blue zone is a strong supply.
📚 As per my trading style:
As #EURUSD retests the red circle zone, I will be looking for bearish reversal setups (like a double top pattern, trendline break , and so on...)
📚 Always follow your trading plan regarding entry, risk management, and trade management.
Good luck!
All Strategies Are Good; If Managed Properly!
~Rich
Disclosure: I am part of Trade Nation's Influencer program and receive a monthly fee for using their TradingView charts in my analysis.

AUDJPY - One More Bearish Impulse Soon!Hello TradingView Family / Fellow Traders. This is Richard, also known as theSignalyst.
📈AUDJPY has been overall bearish trading within the falling broadening wedge pattern marked in red and it is currently retesting the upper bound of the channel acting as a non-horizontal resistance.
Moreover, the green zone is a strong supply.
📚 As per my trading style:
As #AUDJPY retests the red circle zone, I will be looking for bearish reversal setups (like a double top pattern, trendline break , and so on...)
📚 Always follow your trading plan regarding entry, risk management, and trade management.
Good luck!
All Strategies Are Good; If Managed Properly!
~Rich
Disclosure: I am part of Trade Nation's Influencer program and receive a monthly fee for using their TradingView charts in my analysis.

XAUUSD: The decline has stopped, continue to buyAs the talks between Trump and Putin achieved results on Saturday, risk aversion decreased, gold fell rapidly at the opening, and after briefly breaking through 3330, it found support again and rebounded strongly, reaching a high of 3358. Subsequently, the price of gold entered a slow decline, mainly because the market was waiting for the results of the talks between Trump, Zelensky and several European leaders, which was the main factor affecting the subsequent rise and fall of gold prices.
Personally, I think it is unlikely that this meeting will completely resolve the situation between Russia and Ukraine. Since it cannot be resolved, the geopolitical risks still exist, and the market's risk aversion is unlikely to decline, so gold will continue to rise.
Today's focus is on 3340. If support is found, consider buying.
🏆Trade setup:
📈Buy at 3340
✅Target 1 - 3355
✅Target 2 - 3370
🛑Stop Loss - 3330
📣If you have different opinions, please leave a message below to discuss

LUMIA/USDT WILL THIS COIN FINALLY BREAK UP $1Lumia shows strong potential for new volume. Real-time data will confirm this. Once confirmation is in place, the coin is likely to rise — and we’ll provide follow-up updates
This coin can have risk, and it's not a high-quality choice.

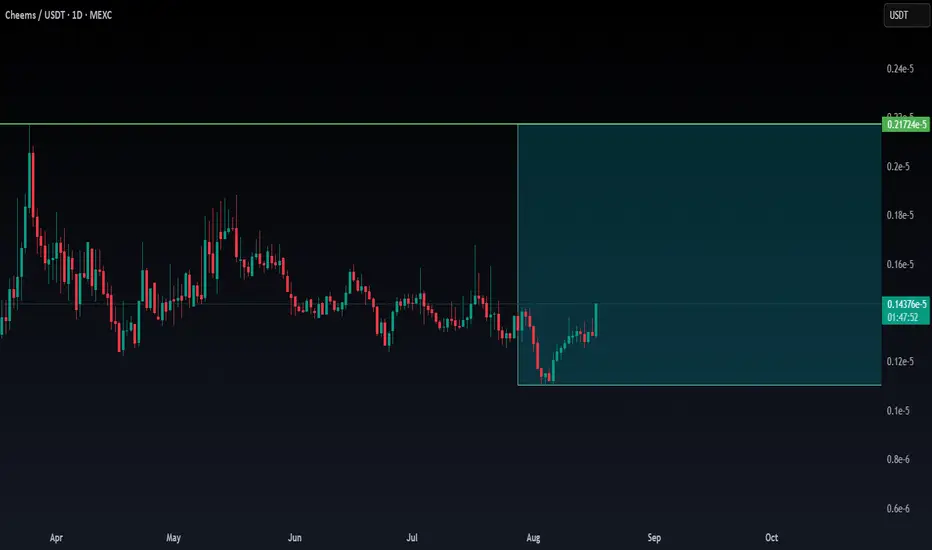
CHEEMS_USDT Can this coin make it on low time frame?Cheems seems to have interesting level confirmation. What could be confirmed in the coming hours?
For this reason, follow this day trade option to see the possibility.
In case there is a confirmation, the update will get a follow-up.
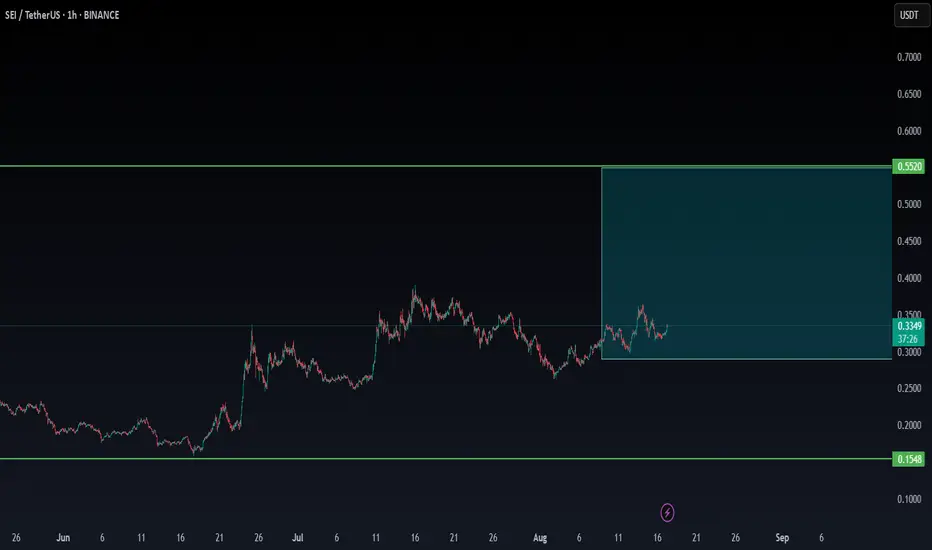
SEI/USDT NEW INCREASE VOLUMESEI is showing a new trend in volume, which may be confirmed in the coming time frames. We will continue to monitor the trend to see if confirmation occurs
USDJPY Sell Setup – Watching 147.600 Key Zone Next WeekHey Traders,
In the coming week, I’m monitoring USDJPY for a potential sell opportunity near 147.600.
Trend: Still in a clear downtrend.
Current move: Price is correcting upward into resistance.
Key level: 147.600 – a major support-turned-resistance area.
If price rejects this zone with confirmation, it could resume the bearish move. I’ll be looking for signs of weakness (candlestick rejection, momentum shift) before entering.
What do you think? Will USDJPY hold below 147.600 or push higher first?
Trade safe,
Joe

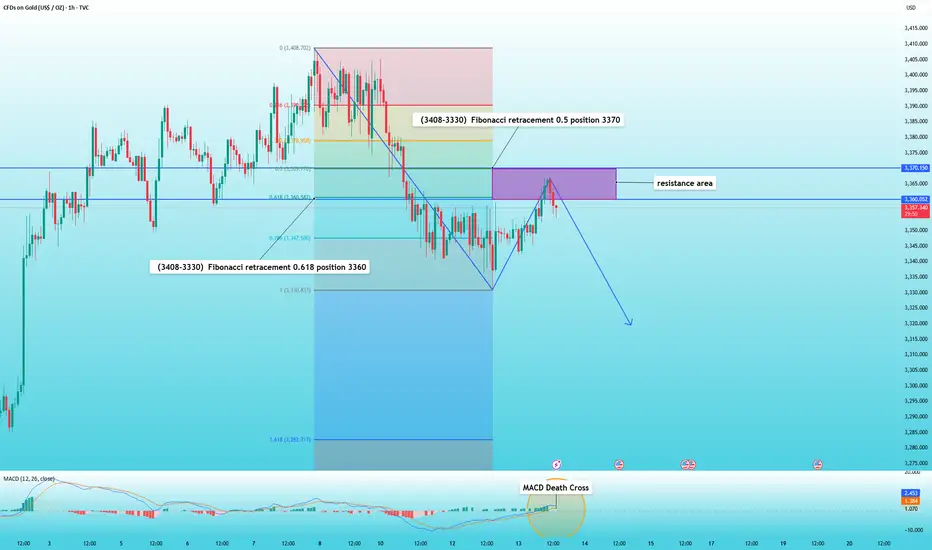
Gold pulls back as expected, you can continue to sellIn my previous trading strategy, I reiterated my view that gold prices would continue to fall if they couldn't break through 3370 in the short term.
And indeed, gold's performance behaved as expected. After hitting 3370, it fell again, reaching a low of 3350.
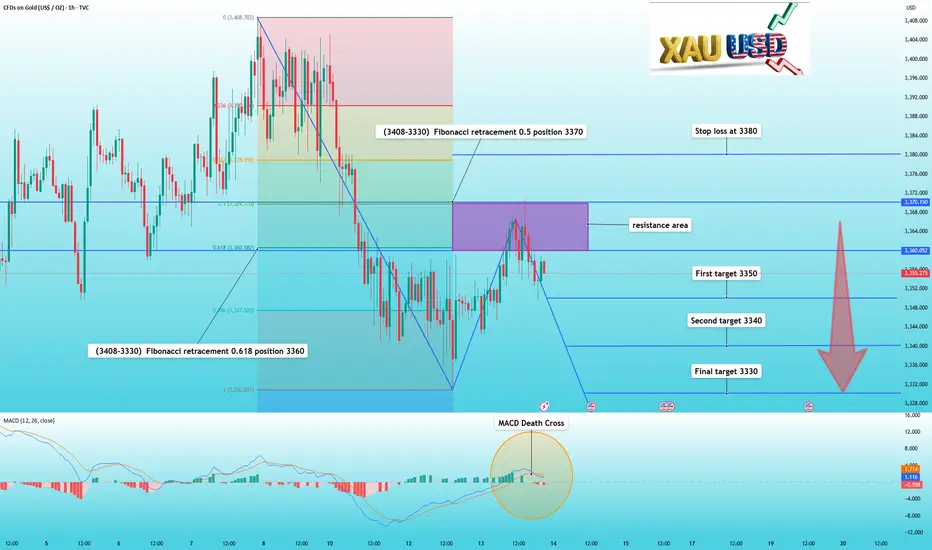
Technically, the current correction in gold prices hasn't concluded. The Fibonacci retracement indicator for the 3408-3330 trend shows that 3370 is at 0.5, and 3360 is at 0.618, representing resistance. Meanwhile, the MACD indicator has formed a death cross.
Therefore, we do not need to make any changes to our trading strategy. As long as 3370 is not effectively broken, we can continue to short based on the resistance range.
Trade setup is as follows:
Sell near the 3360-3370 area
First target 3350
Second target 3340
Final target 3330
Stop loss at 3380
📣If you have different opinions, please leave a message below to discuss
Gold Trading Strategy XAUUSD August 14, 2025Gold Trading Strategy XAUUSD August 14, 2025:
Gold prices continued to rise in the European session on August 13, 2025 as mild US inflation data raised expectations of a Federal Reserve rate cut in September, while a weaker US dollar also boosted demand for gold.
Fundamental news: The US labor market report earlier this month initially weighed on the greenback, but the latest US CPI data added pressure as it did not show a clear acceleration in inflation due to tariffs in July. The inflation data reinforced the possibility that the Fed will take a more dovish stance in September, which is what the market is expecting.
Technical analysis: After a deep correction to the 3330 area, gold prices showed signs of increasing again. On the H1 frame, an upward price channel has been formed, but the current MA lines are still moving sideways, not showing a clear trend. The 3350 - 3355 area will be the important area to decide whether this uptrend channel can hold or not. RSI on H1 and H4 timeframes has entered the buy zone, this is a very good condition for us to trade. We will trade at the support zones and large liquidity zones of gold prices.
Important price zones today: 3350 - 3355, 3335 - 3340.
Today's trading trend: BUY.
Recommended orders:
Plan 1: BUY XAUUSD zone 3350 - 3352
SL 3347
TP 3355 - 3365 - 3375 - 3390.
Plan 2: BUY XAUUSD zone 3335 - 3337
SL 3332
TP 3340 - 3350 - 3370 - 3390.
Plan 3: SELL XAUUSD zone 3388 - 3390
SL 3393
TP 3385 - 3375 - 3365 - 3355 (small volume).
Wish you a safe, successful and profitable trading day.🥰🥰🥰🥰🥰

Gold rebounds and is facing resistance, waiting for a declineIn the previous article, I said that if the gold price cannot hold above 3370 in the short term, then the gold price will continue to fall.
Today's rebound in the Asian and European sessions shows mixed gains and losses on the K-line chart, indicating a weak rebound. After rebounding to 3367, gold prices turned downward again.
Meanwhile, the 1-hour MACD indicator also shows signs of forming a death cross. The Fibonacci retracement indicator from 3408 to 3330 indicates that the 0.618 level is at 3360, and the 0.5 level is at 3370. Therefore, the 3360-3370 range is currently a resistance zone.
Therefore, I still maintain my previous view that as long as it cannot hold 3370, you can short in the resistance area.
WMTX — From Accumulation to Breakout? WMTX has been in a strong bearish trend 📉 since late 2024, moving within a clear descending channel.
After months of decline, price action shifted into an accumulation phase 📊, forming a range between support and resistance (highlighted in blue).
Recently, buyers 🐂 have stepped in, pushing price toward the upper boundary of this range. A confirmed breakout 🚀 and retest of this zone could signal the end of accumulation and the start of a bullish markup phase 📈, with a potential target near $0.50 💰.
As long as the range low holds, the bias remains bullish ✅, but confirmation from a clean breakout is key for momentum to build.
🔔 Disclaimer: This analysis is for educational purposes only and does not constitute financial advice. Always do your own research and manage risk accordingly.
📚 Always follow your trading plan regarding entry, risk management, and trade management.
Good luck!
All Strategies Are Good; If Managed Properly!
~Richard Nasr

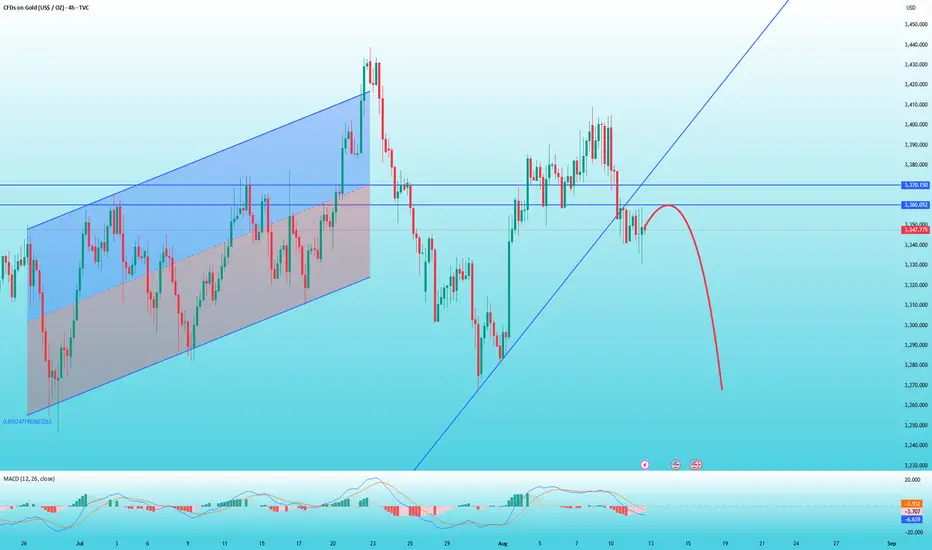
Gold rebound is weak, beware of further declineThe CPI data released this week was lower than market expectations, which is considered positive news. However, since it was the same as the previous reading, gold prices only rebounded briefly before entering another period of volatile consolidation.
From the 4-hour chart, gold prices have already broken through support levels. If they fail to break back above 3370 in the short term, they may continue to test the bottom.
Gold's rebound is weak in the short term, and it's trending downward. The K-line indicator is showing a bearish pattern, and the MACD indicator has formed a death cross.
Therefore, if you want to trade short, wait for a rebound around 3360. Set a stop-loss at 3370, with a target of 3340 and then 3330.
ARPA IS READY FOR NEW MOON FLYArpa seems to give us an important signal of volume, which can lead in the next 50% increase and more, will follow this coin for further building steps.

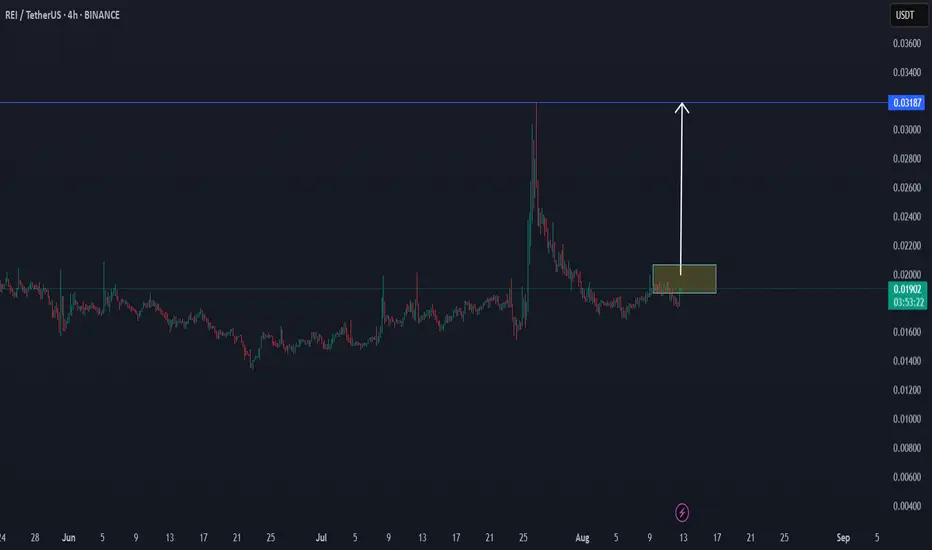
THE RETURN BREAK OF REI TO $0,032There is a good chance we are going to see a new break on REI as we saw before.
We will follow the coin for new volume.
XAUUSD Gold Trading Strategy August 12, 2025XAUUSD Gold Trading Strategy August 12, 2025:
Gold prices were under pressure on Monday (August 11) and recovered in the morning trading session today (August 12). US President Trump clearly stated that he would not impose import tariffs on gold, dispelling previous market concerns about disruptions to the global gold supply chain.
Fundamental news: Investors are paying attention to the Federal Reserve's interest rate outlook. Gold is entering a correction phase after tariff concerns are resolved, and price movements may be more influenced by Dollar and inflation data.
Technical analysis: Gold prices continue to correct downwards following the trend from last week, with MA lines still acting as resistance. Currently, the RSI H1 frame is approaching the oversold zone, and there is a high possibility that gold will recover this weekend. Resistance and high liquidity areas such as 3354 - 3359 and 3370 - 3375 will be very good trading areas.
Important price zones today: 3354 - 3359, 3370 - 3375 and 3318 - 3323.
Today's trading trend: SELL.
Recommended orders:
Plan 1: SELL XAUUSD zone 3357 - 3359
SL 3362
TP 3354 - 3344 - 3334 - 3324.
Plan 2: SELL XAUUSD zone 3373 - 3375
SL 3378
TP 3370 - 3360 - 3340 - 3320.
Plan 3: BUY XAUUSD zone 3318 - 3320
SL 3315
TP 3323 - 3333 - 3343 - 3363 (small vol).
Wish you a safe, successful and profitable trading day.🌟🌟🌟🌟🌟

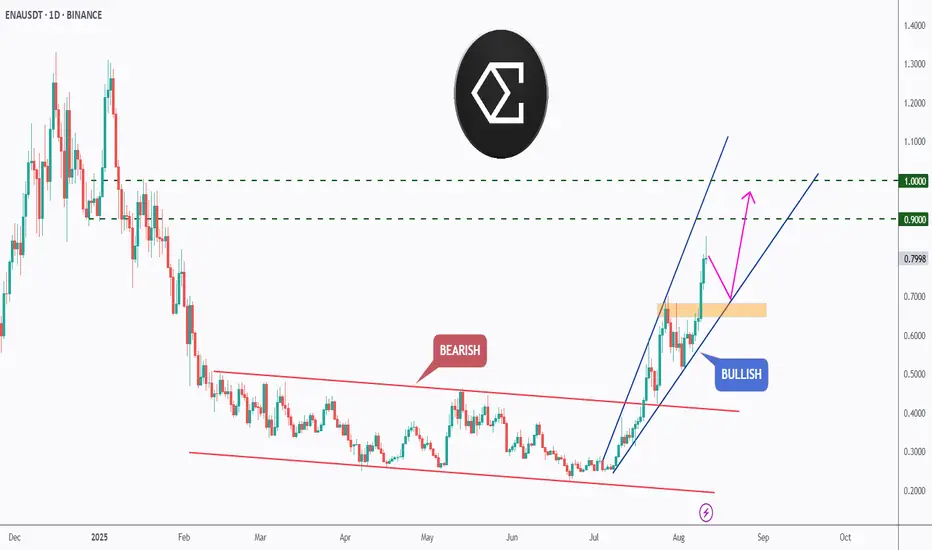
[Deep Dive] ENA – Edition 5: From Channel Break to $1?BINANCE:ENAUSDT ENA has just completed one of the cleanest bullish breakouts we’ve seen this month — transitioning from months of compression inside a bearish channel to an aggressive impulsive rally.
📉 Bearish Phase
For most of 2025, ENA traded within a descending parallel channel, stuck in a cycle of lower highs and lower lows. Momentum was firmly in the bears’ hands, and every rally attempt was quickly rejected at the channel’s upper bound.
📈 Bullish Breakout
In late July, the tide shifted. Price broke decisively above the channel, retested the breakout zone, and entered a steep ascending channel. This bullish structure is now guiding price toward the $0.90 and $1.00 resistance zones — key psychological and technical targets.
The current move has left an orange demand zone ($0.70–$0.72) in its wake, which could act as a magnet for a healthy retest before another push higher.
🔥 Fundamental Tailwinds
ENA (Ethena) has been making headlines in the DeFi yield space with its synthetic dollar protocol USDe, offering stable and high on-chain yields. Recent updates include:
Expansion of USDe collateral integrations across major DeFi protocols.
Strategic partnerships with lending and derivatives platforms, increasing USDe’s utility.
Continued growth in circulating USDe supply, signaling strong adoption.
As yields and DeFi activity heat up, ENA could continue to attract liquidity — especially with narratives around on-chain stable yields gaining momentum.
🧠 Key Levels to Watch
- Support: $0.70–$0.72 (demand zone)
- Immediate Resistance: $0.90
Major Breakout Target: $1.00 — a key round number and potential profit-taking zone.
A clean retest of the orange zone followed by bullish confirmation could offer one of the best risk-to-reward entries in weeks.
💬 What’s your take — will ENA clear $1 on this run, or does it need a deeper pullback first?
🔔 Disclaimer: This analysis is for educational purposes only and does not constitute financial advice. Always do your own research and manage risk accordingly.
📚 Always follow your trading plan regarding entry, risk management, and trade management.
Good luck!
All Strategies Are Good; If Managed Properly!
~Richard Nasr
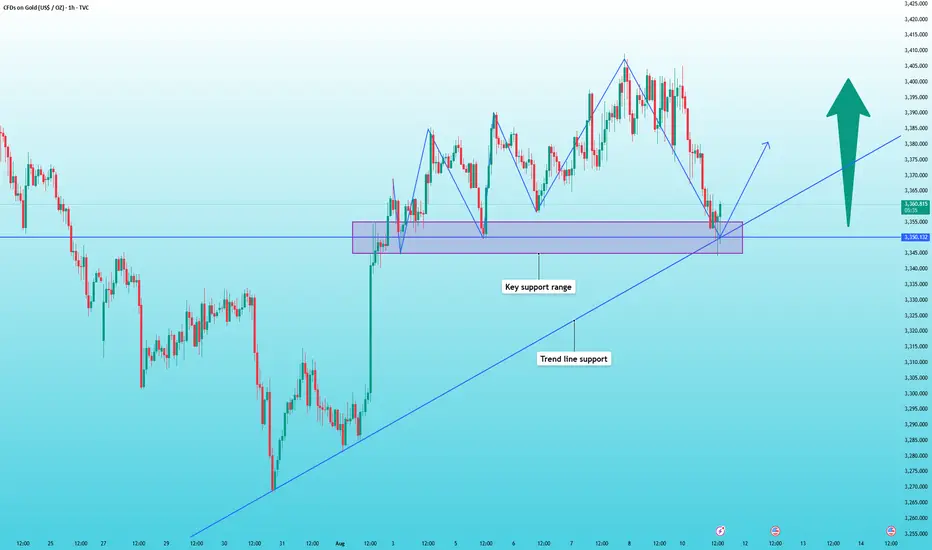
Gold support has been confirmed, buy with confidenceThe most anticipated outcome for the gold market this week is tomorrow's CPI data. After today's pullback during the Asian and European trading sessions, the current price has reached support levels. Before the CPI release, I believe volatility will be minimal, with a high probability of limited fluctuations.
The chart shows that 3350 is a key support level. After several hours of testing, 3350 has stabilized, so we can buy at this level, with the initial target being 3360, followed by 3380.
XAUUSD Gold Trading Strategy August 11, 2025
At the beginning of the new week's trading session, the gold price fell sharply from the 340x area to the current 335x area.
Basic news: The US Dollar Index (DXY) fell to around 98 last week, unable to stay above 100. Although the 10-year Treasury yield rose to 4.285%, the Dollar remained under pressure, reflecting market concerns about political risks in the United States.
Technical analysis: After the price met the 340x resistance area, it fell sharply. Currently, the H1 frame MA lines have turned into resistance, but the H4 frame is still support. The H1 frame RSI is showing signs of increasing again and moving towards the average line; the H4 frame RSI is adjusting towards the oversold area. We will wait at the resistance areas and liquidity areas to trade.
Important price zones today: 3375 - 3380, 3350 - 3355 and 3395 - 3400.
Today's trading trend: SELL.
Recommended orders:
Plan 1: SELL XAUUSD zone 3378 - 3380
SL 3383
TP 3375 - 3365 - 3355 - 3330.
Plan 2: SELL XAUUSD zone 3395 - 3397
SL 3400
TP 3392 - 3382 - 3362 - 3330.
Plan 3: BUY XAUUSD zone 3353 - 3355
SL 3350
TP 3358 - 3368 - 3378 - 3390 (small volume).
Wish you a safe, successful and profitable new trading week.🥰🥰🥰🥰🥰

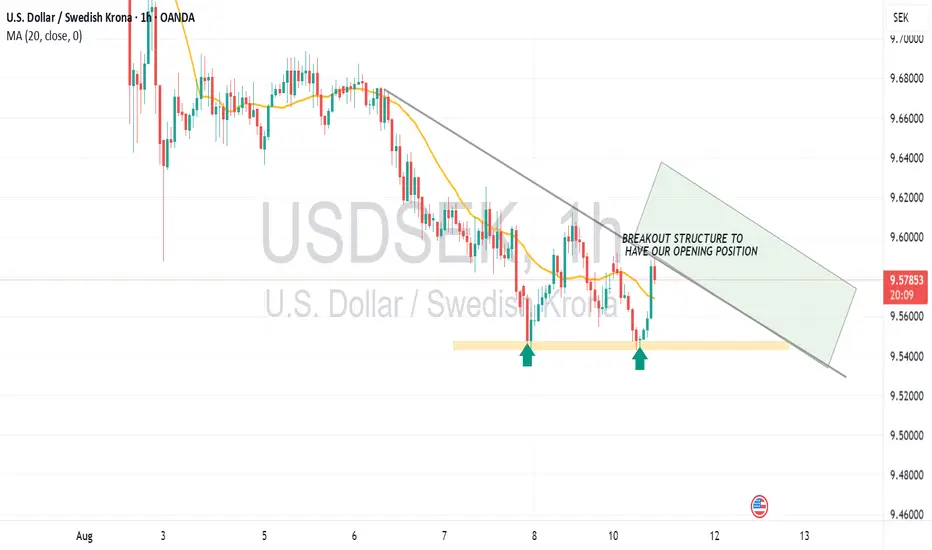
BREAKOUT OPENING FOR LONG POSITION WITH GREAT WIN RATEInformation to be provided regard this long trends. We wait for crossing and hit long range market with 200pip chances