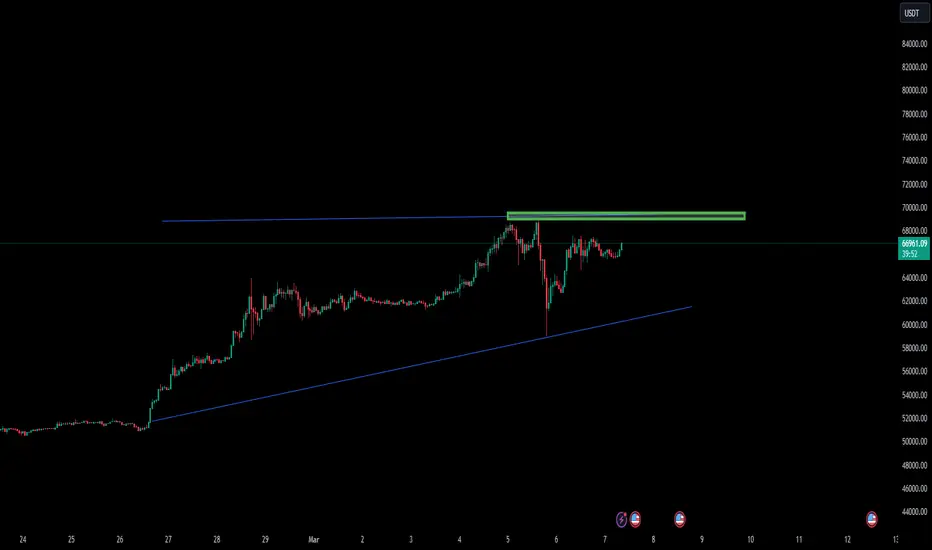
BTC HIGH POSSIBLITY TARGET 72K SOON!Thanks for reading this update.
We follow BTC with every time frame, and having predicted before more BTC targets, also the Start increases below 42K to the 48K target, the 56K target , and more.
We expect depending on our data for this update that BTC has a high chance to increase again up the ATH trend until now BTC has NOT closed a bull trend signal show effect from the last confirmed data.
This means also the high ETF and other volumes are still active in BTC.
Historically there is no ATH just target ATH with no building new volume price action.
The slowly increasing trend is an effective way to hold levels and increase up the ATH.
Manage all time your risk as there is no guarantee in the markets.
On the way to the target, there can be daily basic down and uptrends.
Trend

THIS PRICE ACTION TREND CAN BRING BTC TO NEW ATHBTC for the daily trend seems interesting.
Since we have not seen the close bull trend, there is still a possibility that BTC can return to the ATH level.
Daily is still positive, which means that btc has a high chance of returning.
The price at the moment is below 67K.
Daily technical view shows the possibility for BTC return.
And the level where BTC is now seems very important. In this area, there can be a new volume start, since data shows some trends.

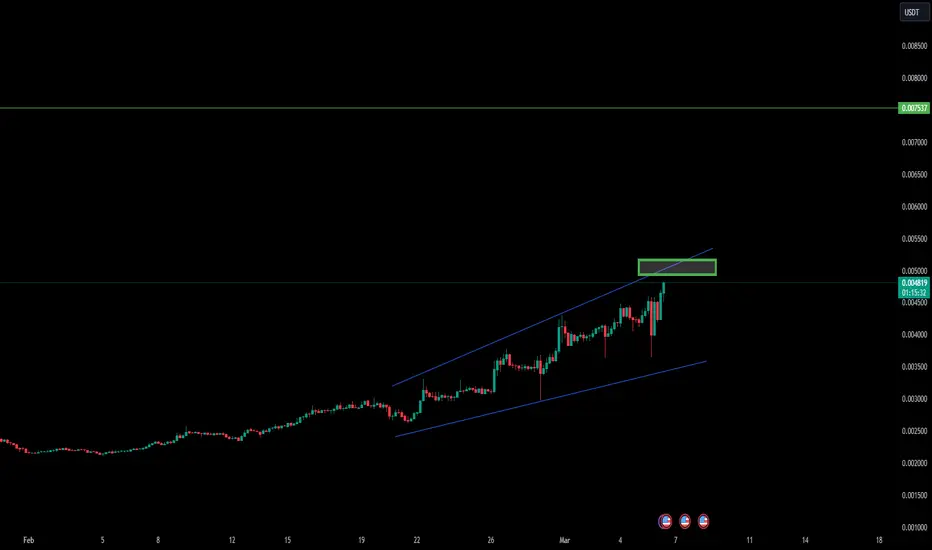
EOS READY FOR NEW INCREASE UP $1Thank you for reading this update.
The last volume data shows that EOS has a good chance to increase by $1 in the coming time frames.
EOS did stay for a long time below $1, and it seems that it can return soon up.
We will follow up on this update for trend confirmation.

AMB UNEXPECTED FLOW - VOLUME INTERESTAMB seems to have to unexpected trend flow that could get confirmation of an increased trend.
coming time frames can be very important.
There is high volume interest.

BTC INCRAESE VOLUMEBTC seems on a low time frame to show a new increase in volume for the daily trend.
We will follow to see if BTC is able to confirm.
BAT NEW VOLUME INCREASEBAT seems to have a new volume increase with the possibility of a break in the coming time frames, we will check if this coin can break with the next confirmations.
The trend seems until now in the positive range.

USDCAD - Top-Down Analysis 📹 UpdateHello TradingView Family / Fellow Traders. This is Richard, also known as theSignalyst.
📈 Here is a detailed update top-down analysis for #USDCAD.
USDCAD is hovering around the lower bound of the wedge pattern. So we will be looking for trend-following buy setups on lower timeframes.
📚 Always follow your trading plan regarding entry, risk management, and trade management.
Good Luck!.
All Strategies Are Good; If Managed Properly!
~Rich

RSR NEW VOLUME INCREASERSR seems on a low time frame to enter a new volume increase which could enter a new break in the coming time frames.
We will follow up to see if it can have new confirmations.
DASH/USD Main trend.Logarithm. Time frame 1 month. The main trend. Idea for guiding the work area in the main trend.
Secondary trend . Time frame 1 day.

XAUUSD NEXT MOVE POSSIBLE Gold Is Bullish We Have Best Buying Opportunity Around 2116 To 2110 After Break 2110 Level Minimum H1 Time Frame Closing Important For Sell Entry Otherwise Best Buying Opportunity 2116 To 2110 For More Updates Stay Tuned

BITCOIN PICTThe trajectory for Bitcoin in an imaginary visual field of reference basing the points on past experiential real world events and future proofing for speculative reference to determine the outcome of the current trend movement on a base of argument from which to measure how likely the price will be to continue up after a slight capitulation in price action.

HelenP. I Bitcoin will make small correction and then start riseHi folks today I'm prepared for you Bitcoin analytics. A few moments ago price declined to support 2, which coincided with the support zone, and started to trades near this level. Some time ago BTC broke this level and declined to lower even the support zone to the trend line, but then the price turned around and started to grow. In a short time, Bitcoin rose to the support zone, where later it broke the trend line and soon support 2, after which the price rose higher than the trend line too. Next, the price continued to move up between the trend line, and last time it fell below, but soon turned around and made a strong impulse up, breaking this line again and later reaching support 1. Soon, BTC broke this level too and rose a little higher, but a not long time ago it fell a little and now trades close to support 1. So, I expect that Bitcoin will decline a little lower than support 1, after which the price can turn around and start to move up. For this case, I set my goal at the 67000 level. If you like my analytics you may support me with your like/comment ❤️

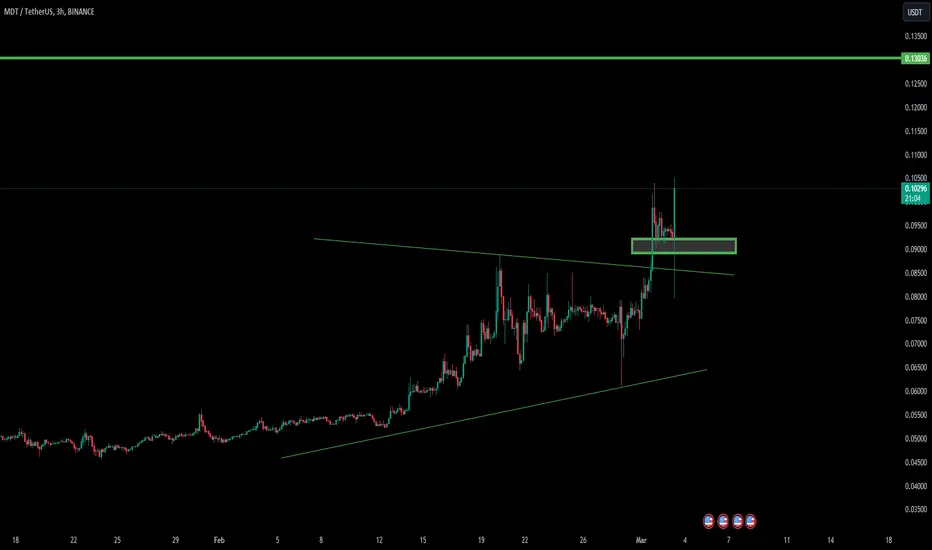
MDT INCREASE VOLUME TRENDMDT seems to have a new increase volume trend, we will follow to see if it can be confirmed in the next time frames.
MDT can show new gains after this volume confirmation.
CAN TURBO GO FOR THE NEXT 100%? CYCLE TRENDTURBO seems one of the volume coins of the moment but it needs a confirmation trend after the last 50% increase.
We will follow TURBO to see if there are possibilities in trend.
It's a high risk to enter coins when it's already pumped.
It seems that turbo has an unexpectedly strong cycle trend.

SHIBA INU NEW INCREASE VOLUMEThank you for reading this update.
SHIB seems to have a new increase in volume trend which could confirm with the coming time frame.
We will check if SHIB can have new confirmations soon.
We know SHIBA From Whale increases.
Shiba seems interesting at this moment.

Week Of 2/25/2024 Gold Performance Never have i ever though id trade Gold so here we are! After analyzing the previous week for Gold, Gold was still in a strong bullish market. With this information, heading into the first day of the week, would be the beginning of a good one!
Gold formed a new higher high indicating a continuation of a strong bullish market, then later retracing to form a higher low, prompting new supply and demand zones. With this retracement, gold formed a descending wedge pattern which is a bullish pattern that is used to catch the trend break of a retracement during a bullish trend. To continue, because the market is bullish, we are only looking to enter in a buy after the trendline break of the descending pattern, and this will be the first round of profits for the week for a profit of 1.5% at a total of 53.7 pips! After the trade, price failed to break past the previous high and retraced back to the higher low. As price failed to break the previous higher low, we can confidently predict, price is in a range market, and because the overall trend is bullish, we can throw another trendline and the starting point of the current retracement, and wait for price to break that trendline to ride it up to our target percentage. Furthermore, this would be our second round of profits for 1.5% at a total of 57.2 pips! Now with a net profit of 3%, coming into Thursday, price broke the supply zone and formed a higher high! After that, price started to retrace a bit and once it formed a second point of data, we are able to throw in another trendline which ended up breaking early morning for our third round of profits at 1.5% for a total of 109.8 pips!
All in all, we ended the week with 4.5% gain on the account and no losses! Consistency is the key to trading. even though the travel of price was different with each trade especially on friday, your target should always be 1.5-2% of your total account size. your lot size will vary depending on the setup and how far your target loss is. You do not have to take the full move of a break. You only need a piece of it!

VERX ATH on Earnings LONGVERX on the 15 minute chart demonstrates printing a high tight bull flag pattern in its
bullrun after the earnings report was a two line beat much like the one a quarter ago.
VERX has impressed traders including this one who got in on the ride early. I will trade
this like others recently with a similar pattern. I will hold during the consolidation and
watch for a break above the flag regression channel. I will add upon the break and
set a trailing stop loss of 5% upon a rise of another 5% keeping the profits safe while
underway. See my ideas on SOUN DUOL, VTYX and a few others. Review the link to
the pattern description here. See also my swing long trade ideas for this sector XBI and LABU.

EURCAD-Ready to Short!We got a bearish trend change for EC.
Now looking for trend continuation to take a short trade.
We got the 50% retracement and price coming into the fair value gap (this is a must for my system!)- then we look for a bearish trend change on 15min and ATTACK!
The 50% retracement and FVG are in line with previous support turned resistance- thus adding another confluence on this trade.
This is looking like a very yummy short!
Follow and Stay tuned my friends ;)

BTC NEW VOLUME INCREASEDaily trend shows the possibility for a new volume increase for BTCUSDT.
We will follow up in the coming time frames if BTC gets new confirmation.
This is a daily update and depend not on the long term.

BREAK POSSIBILITY CYBERUSDTCyber showing an interesting volume range, where its possible to get a break in the coming time frames, we will follow it to see if it's able to break.

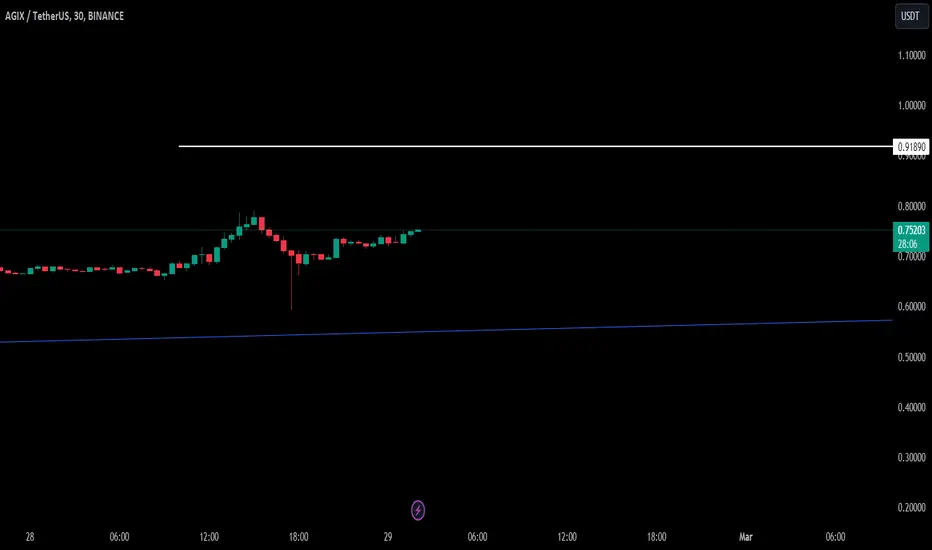
AGIX NEW VOLUME INCREASEAGIX showing a new trend25 level.
We will follow up to see if it's possible to confirm within the coming time frames.
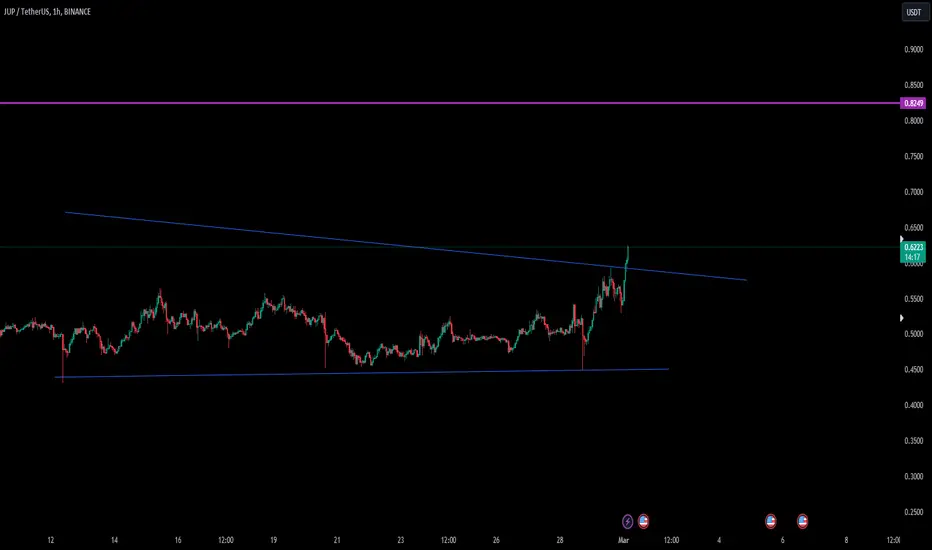
JUP NEW INCREASE VOLUMEJUPUSDT showing a new increase in volume that could enter a new increase in the coming time frames. exactly this trend point can become interesting.
We will follow up in the coming time frames to see if its able to confirm.
Will we repeat Jan 2020 - Apr 2021? I copied Jan 2020 - Apr 2021 and overlapped it starting Jan 2023.. minus the Covid drop, I could see us following similar path but more drawn out.
