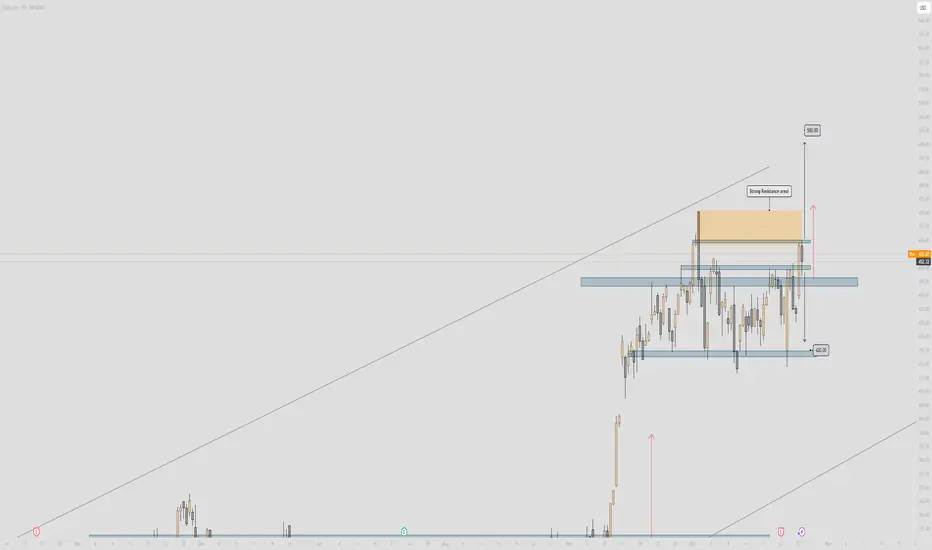
TSLA - Important!🔥 Tesla Analysis (Daily Structure) 🔥
Alright, let’s break this one down 👇
🧱 Structure Overview
Tesla’s price is currently hovering around $452, sitting right below a major resistance zone between $455 – $470 (highlighted in orange). This area has acted as a strong ceiling multiple times — every approach has been met with rejection pressure.
Below, the support floor sits clean around $420 – $425, which has been holding the range low for a while. We’re essentially trapped in a sideways consolidation box — a range between that $420 low and the $470 resistance cap.
🧭 Bias
Current structure = Neutral to Bearish
Price just wicked into resistance, showing signs of rejection. Unless we see strong follow-through above $470 with clean volume, this is likely a reaction zone for shorts.
💡 Key Zones
Resistance (Sell Zone): $455 – $470
Strong supply — expect sellers to defend this area.
Support (Buy Zone): $420 – $425
Range demand base — liquidity resting below.
🎯 Scenarios
Bearish Setup (Higher Probability for Now)
If Tesla fails to break and close above $470, look for a move back down to $420 — possibly a liquidity grab under the range. Confirmation would be bearish engulfing or a strong rejection candle from resistance.
Bullish Setup (Breakout Play)
If price cleanly closes above $470 and retests it as support, we could open the door toward $500 (measured move target). That’d be a breakout from the range and continuation of the larger bullish channel.
⚖️ Risk Management
Bears: Stop above $475 – $480
Bulls: Stop below $445 if entering after breakout retest
Keep R:R ≥ 1:2
🧠 Summary
Tesla’s in a tight range — smart money likely accumulating or distributing near these highs. Watch for rejection signs around $470 for short plays, or confirmation above it for the next leg to $500.
This is the make-or-break zone — the next move will define Tesla’s mid-term direction. ⚡️
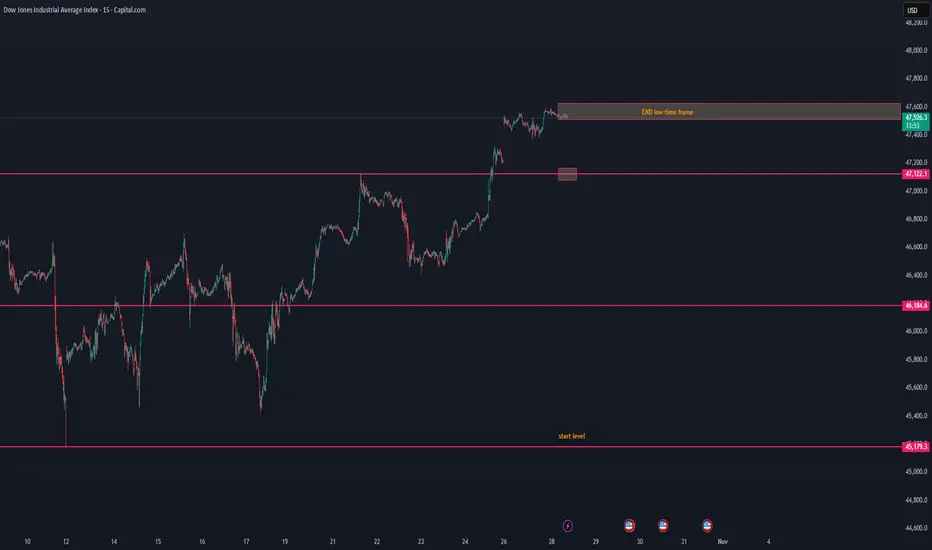
Trend
US30 lost its low time frame — possible breakdown aheadUS30 lost its low time frame — possible breakdown ahead ⚠️
US30 has lost its low time frame structure, showing early signs of weakness after the recent push to 47.5K.
The current price action suggests that momentum is fading, and sellers may start to take control.
📉 Short-term view:
Structure break below 47.5K zone confirms loss of bullish control.
The next visible support area sits around 47.1K, followed by 46.1K.
With time, price could continue to drift down toward the start level near 45.1K if buyers fail to defend.
📊 Observation:
Volume has started to cool off, and price is trading below the short-term EMA range — a typical setup before a gradual downward retrace.
💬 Summary:
US30 lost its low time frame momentum and looks to break down step by step toward the start level zone. We’ll monitor if buyers can react near 47.1K or if this becomes a broader correction phase.
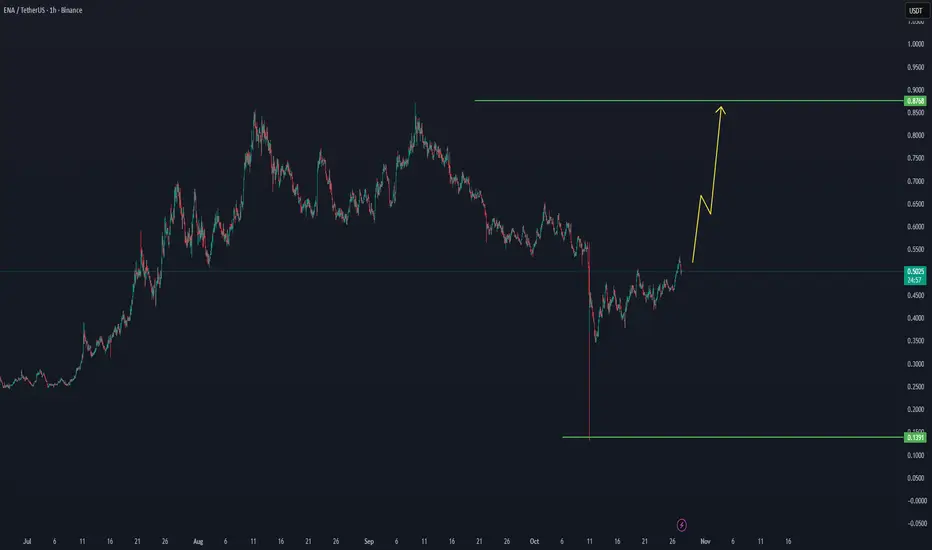
ENA/USDT — Recovery Setup Toward $0.87 in ProgressNA/USDT — Recovery Setup Toward $0.87 in Progress 🚀
ENA has shown a strong rebound from its major support zone, confirming a short-term bottom formation after the recent deep correction.
Price structure now indicates a shift from accumulation to expansion, with early signs of buyer momentum building up on the lower timeframes.
🔍 Technical Outlook:
Support Zone: $0.13 – $0.15 (strong base level)
Current Price: ~$0.50
Resistance / Target: $0.87
Pattern: Early stage of a potential impulse wave recovery
Volume: Gradually increasing, signaling renewed interest
📈 Scenario Expectation:
If ENA continues holding above the $0.45–$0.50 range, the next move could extend toward $0.65, followed by a possible breakout to $0.87, aligning with the previous major resistance zone.
A break above $0.87 would confirm a full trend reversal and open the path toward new cycle highs.
⚠️ Risk Zone:
Failure to hold above $0.45 may trigger a retest of the lower accumulation area around $0.30–$0.35 before another potential leg up.
BTC/USDT — New Volume Entry Zone Forming - 117KBTC/USDT — New Volume Entry Zone Forming 💥
Bitcoin is stabilizing above the pre-cycle range and building new volume around the $115K zone.
This could mark the next accumulation area before continuation if support holds here.
📊 Key Range: $115K–$116K
📈 Focus: Maintaining this new volume base for further upside to 117K

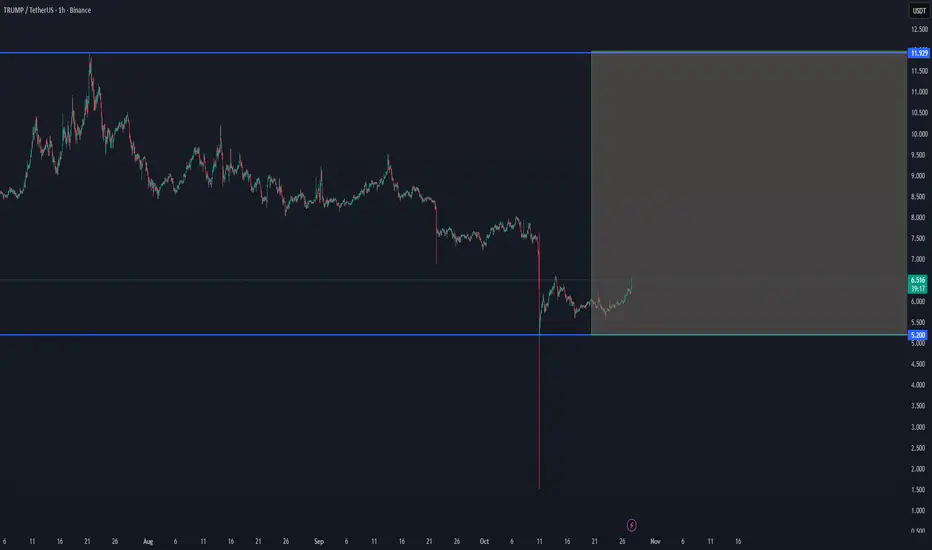
TRUMP/USDT — Reversal Signs After Deep CorrectionTRUMP/USDT — Reversal Signs After Deep Correction ⚡
After a heavy decline, TRUMP is showing early recovery signs from the $5.20 support zone.
If momentum continues, a push toward the $11.90 resistance range could form a short-term bounce setup.
📊 Support: $5.20
📈 Upside Target Zone: $11.90
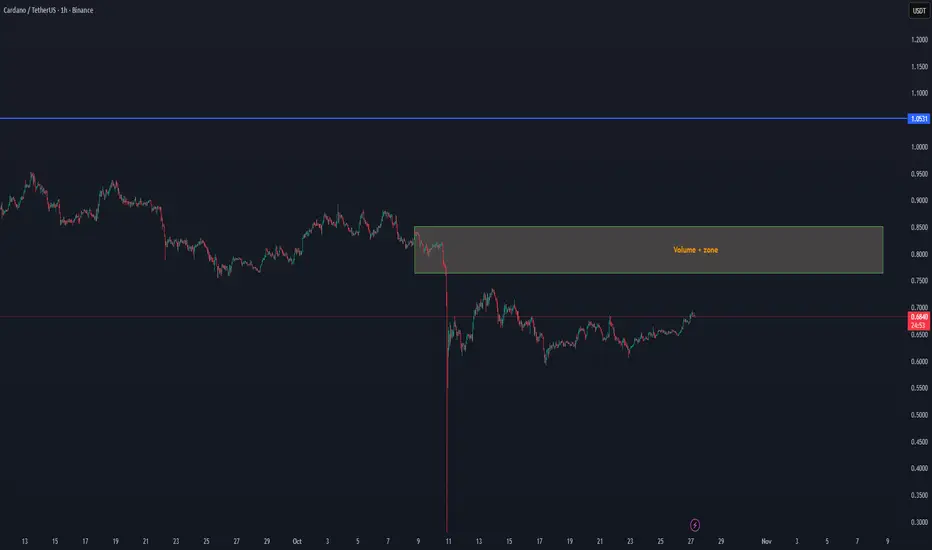
ADA/USDT – Volume Zone Retest Setup🔹 ADA/USDT – Volume Zone Retest Setup
ADA is showing early signs of strength after recovering from the last drop and is now building momentum below the Volume+ Zone between $0.75 – $0.85.
The current structure shows stable volume forming on lower time frames, which can indicate accumulation before a possible retest of the upper range.
If momentum continues, ADA can look to re-enter the volume zone, where the next confirmation area will define continuation potential toward $1.05 resistance.
For now, we follow volume development — a clean breakout and hold above the zone would confirm the next expansion phase.
USD/CHF - Long🔥 USD/CHF – 1H Forecast Breakdown 🔥
Alright traders, let’s cook this one up 👇
🧠 Bias
Currently leaning bullish on USD/CHF as price holds firm above a key 1H demand zone near 0.7945–0.7955.
After multiple liquidity grabs in this area, buyers are stepping back in — hinting that smart money may be reloading longs 👀.
🧩 Technical Breakdown
Price rejected a 1H demand zone with strong bullish candles.
The 200 EMA is hovering above price but flattening out — potential early signal of a reversal phase.
Structure-wise, we’ve created higher lows since the sweep, suggesting a buildup for continuation.
Entry is around 0.7969, targeting the next 4H supply near 0.8016.
Stop sits tight below the demand zone at 0.7944 — just under liquidity.
🎯 Trade Setup
Entry : 0.7969
SL : 0.7944
TP : 0.8016
R:R: ≈ 1.89
Risk: 25% (Aggressive test setup for small account challenge 💥)
⚙️ Game Plan
Wait for price to retest entry zone or show a bullish 15M confirmation candle before entering.
If we clear 0.7995, momentum could accelerate fast toward TP.
If we break below 0.7940, this idea’s invalid — we’ll reassess for a deeper discount.
🧠 Summary
USD/CHF looks ready to spring out of a compression range. Liquidity below has been taken — next logical move is to hunt highs. Keep it clean, manage your lot size, and trail stops once we clear 0.7990.

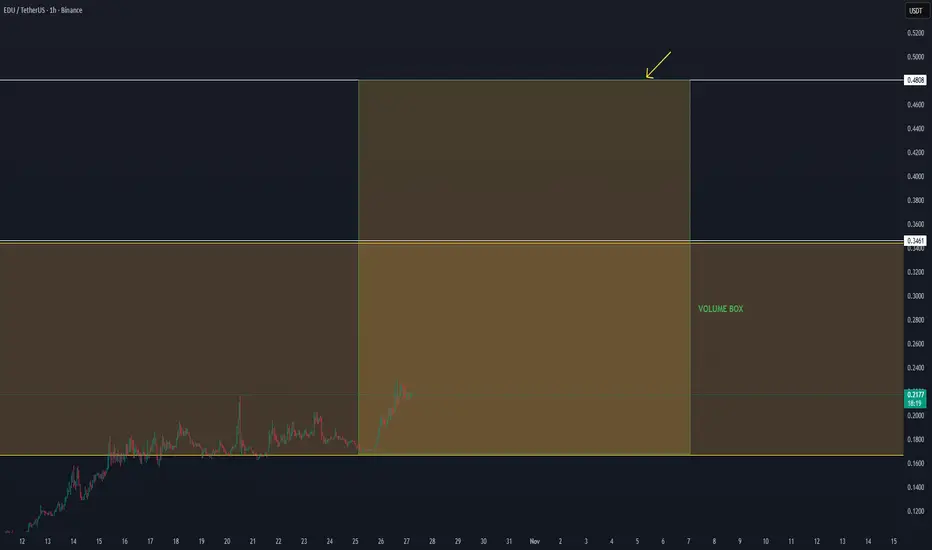
EDU/USDT – Volume Expansion Setup🔹 EDU/USDT – Volume Expansion Setup
EDU continues to show strong structure after the last move up, holding steady inside the volume box. The pair is building momentum with consistent volume increase on the lower time frames, showing clear accumulation signals.
If the current structure remains stable, EDU can continue this short-term uptrend and target the next resistance zone around $0.48, where the main reaction level is expected.
We follow the data and volume development closely — as long as the price stays supported inside the box, the momentum remains valid for a potential breakout continuation toward the upper range.
BTC/USDT — Pre-Cycle Range Breakout📊 Market Update
Bitcoin entering up on the low time frame with strong volume — we are now in an area where BTC is building a new uptrend cycle with the last trend view.
Remember, BTC can always change trend unexpected, and when that data comes, we will share it fast. For now BTC still holding positive around the support at 108K.
🔹 Market Structure
Last 4 days+ BTC been building uptrend, and as long this stays consistent we can speak about positive trend.
Important zone is 117K, we will see if BTC can reach there soon.
We continue daily updates as always — everything is possible in the market.

AUDNZD: Price Breaks H1 DTLDaily Timeframe
In early October, price failed to push a higher high so we do need to be cautious of a double-top risk
Price is crossing back above EMA20 so that is a good indication of upside momentum
EMA20 is quite far from EMA60, which means price is quite over-extended
H1 Timeframe
Price crosses above the descending trend line on Sunday's market open, which is a good sign that there's upside momentum
When pice crossed above the DTL and the EMA band, it did revert back and make a quick bounce, indicating that this is holding
Other Notes
Be cautious and reduce size because of the potential double-top formation on the daily timeframe
Sunday's market open might also mean unpredictable momentum during the Asian session and the rest of the week

BTC Market Update – New Volume Activation - $114K📈 BTC Market Update – New Volume Activation
BTC continues to show strong momentum within the current structure.
Price action remains bullish, with no clear signs of breakdown at this stage.
From the current zone (~111.4K–111.7K), there’s visible new volume activation, suggesting renewed interest and potential continuation toward the $114K target zone.
As long as BTC holds above the support range, the main trend remains intact.
If a structural change occurs, it will be highlighted in the next update.
Focus: Continuation toward $114K while maintaining volume support.

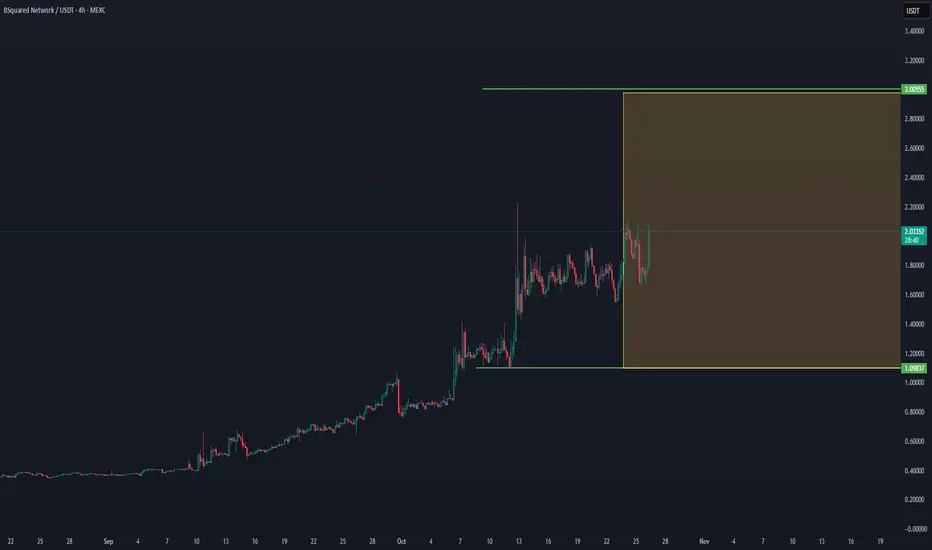
B2USDT Market Update – Range Formation & Volatility WatchB2USDT is currently consolidating after its previous strong impulse move.
The price has been trading in a defined range between 1.09 and 3.00 USDT, forming a mid-term sideways structure.
At the moment, no confirmed breakout is visible — price action remains neutral to slightly bullish as long as it holds above the 1.09 support zone.
Sustained closes above the 2.05 level could indicate the start of a range expansion toward the 3.00 zone, but confirmation requires clear volume increase and momentum continuation.
If BTC continues upward, B2 may benefit from secondary momentum; however, a lack of fresh volume could keep it ranging within this zone for longer.
📊 Summary:
Support: 1.09 USDT
Range resistance: 3.00 USDT
Mid-zone control: ~2.00 USDT
Structure: Sideways / accumulation
Bias: Neutral to bullish, awaiting confirmation
🔎 Focus: Watching for break and hold above 2.05 to confirm a potential continuation setup.
PIPPIN/USDT — Dip Buying Zone Formed After BreakdownPIPPIN/USDT — Dip Buying Zone Formed After Breakdown 💎
After the recent breakdown, PIPPIN has entered its volume zone, which often acts as a re-accumulation area before a potential rebound.
If the price can stabilize and build strength here, this level could represent a dip-buying opportunity with the possibility of a return toward previous highs.
📊 Key Range: $0.015 – $0.024
💡 Focus: Watching for a volume confirmation or strong reversal candle to signal a bounce

EDU/USDT Update - Cycle TokenEDU is now trading inside the volume box area. After the last move up, the price is holding stable with volume increase on the 4H.
As long as EDU stays inside this range, we follow for a possible move to the top of the box around $0.34, where we expect first resistance.
If BTC stays stable, EDU can continue this short-term trend move to test the upper box level.

PIPPIN/USDT — Early Signs of a New Hype Cycle?Looking at the data and historical structure, PIPPIN is showing similar early movement patterns that preceded its last explosive rally.
The current trend shows renewed volume inflow, a base breakout, and a potential start of a new accumulation-to-expansion phase.
If this pattern continues, the structure suggests that a new hype wave could be forming — just like the previous major move that sent it skyrocketing.
📊 Key Observations:
Historical accumulation followed by vertical expansion
Volume returning at local bottom
Early breakout momentum forming
Could this be the start of another hype run?
What do you think — is PIPPIN entering its next cycle? 🔥

CLANKER/USDT — Volume Zone Reclaim Could Ignite Major Reversal CLANKER/USDT — Volume Zone Reclaim Could Ignite Major Reversal Momentum 🔥
CLANKER has successfully rebounded from the $33.9 support zone, entering the key volume zone between $34–$70, which has historically acted as a strong liquidity region. The recent +59% move in volume indicates renewed market interest and early signs of accumulation.
If price continues to hold within this volume zone and confirms a breakout above $40, it could signal the start of a mid-term reversal, with potential upside targets toward $69.8.
📊 Technical Overview:
Support: $33.9
Volume Zone: $34 – $69.8
Breakout Confirmation: Above $40
Bias: Accumulation → Bullish once $40+ holds
The strong recovery candle shows buyers returning aggressively, suggesting that CLANKER could be gearing for a trend shift if momentum sustains above the zone midpoint.
📈 Outlook: Volume-driven reversal zone
🎯 Targets: $40 → $69.8

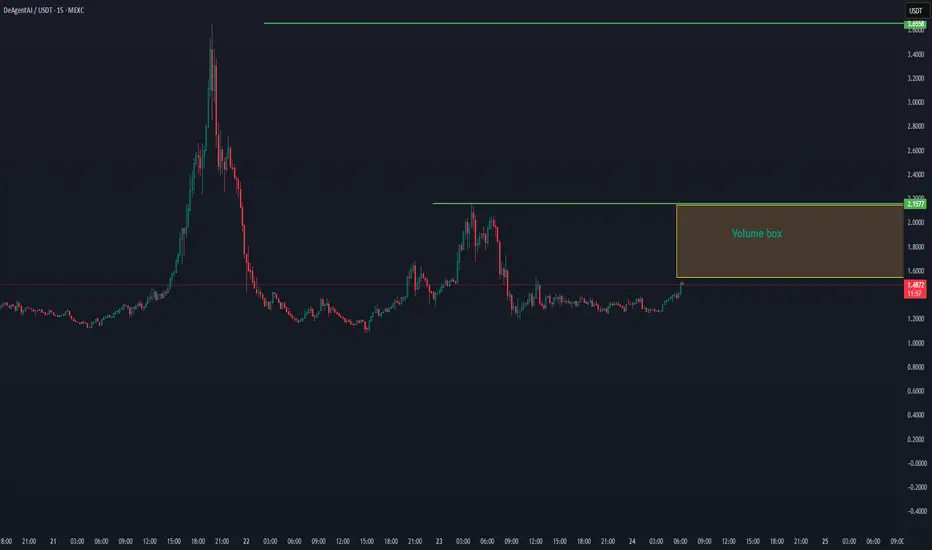
AIA/USDT — Volume Box Reaccumulation Could Lead to New 2025 ATHAIA/USDT — Volume Box Reaccumulation Could Lead to New 2025 ATH 🚀
DeAgentAI (AIA) is developing a solid volume reaccumulation zone between $1.40–$2.15, showing early structural strength after a prolonged consolidation phase.
The pattern suggests that AIA is preparing for a major expansion cycle, with the next key breakout area sitting around $3.65, followed by a potential move toward the $5.00 region — its previous all-time high.
As AI-focused narratives regain strength heading into 2025, AIA could become one of the top performers if this volume box breakout confirms with sustained momentum.
📊 Technical Overview:
Support (Volume Box): $1.40 – $2.15
First Target Zone: $3.65
Major Target / ATH Zone: $5.00+
Bias: Accumulation → Expansion
With strong fundamentals and renewed volume build-up, the structure points to a potential 2025 new ATH scenario, once the $2.15–$3.65 range is reclaimed with volume.
📈 Outlook: Bullish mid-term setup
🎯 Targets: $3.65 → $5.00+

AIA/USDT — Volume Box Forming, Potential Expansion TowardAIA/USDT — Volume Box Forming, Potential Expansion Toward $2.15 🚀
DeAgentAI (AIA) is showing renewed strength after a long consolidation phase, with price now building momentum toward the $1.50–$1.60 zone. The chart highlights a volume box area between $1.50–$2.15, which often acts as a liquidity build-up zone before a strong breakout move.
If AIA confirms continuation inside this range and breaks above $2.15, it could trigger a high-volume expansion, potentially opening a path toward higher time-frame targets.
📊 Technical Overview:
Support Zone: $1.40 – $1.50
Volume Box Range: $1.50 – $2.15
Breakout Level: $2.15
Bias: Accumulation → Bullish
AIA’s structure remains constructive as long as it maintains above the lower range. Watch for volume confirmation near $2.00+ for signs of strong trend continuation.
📈 Outlook: Range buildup with breakout potential
🎯 Targets: $2.15 → $2.80
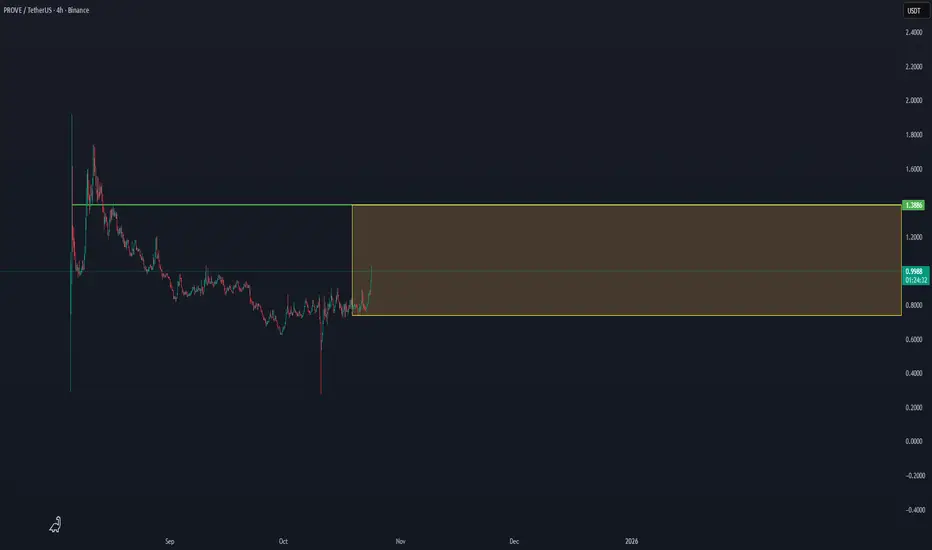
PROVE/USDT — Volume Range Expansion Forming, Eyeing $1.38 PROVE/USDT — Volume Range Expansion Forming, Eyeing $1.38 Breakout 🚀
Prove Network (PROVE) is gaining momentum after a long accumulation phase, now trading near the mid-point of its volume box between $0.74 – $1.38.
This structure indicates a potential accumulation-to-expansion pattern, where sustained buying pressure could push the price toward the upper boundary of the range.
If PROVE confirms a close above $1.38, it would likely initiate a strong breakout continuation, supported by previous high-volume reactions around that zone.
📊 Technical Overview:
Support Zone: $0.74
Range Mid-Level: $0.99
Breakout Level: $1.38
Bias: Accumulation → Bullish continuation
Volume is gradually building, suggesting that buyers are re-entering the market, and the breakout confirmation at $1.38 could trigger a rapid move toward the next major resistance area.
📈 Outlook: Range expansion setup
🎯 Targets: $1.38 → $1.80
BSV/USDT Volume Box Expansion Could Drive Bitcoin SV Toward $127BSV/USDT — Volume Box Expansion Could Drive Bitcoin SV Toward $127 🚀
Bitcoin SV (BSV) continues to consolidate near $21, forming a base at the lower edge of the volume box zone, which historically has triggered strong impulsive moves once momentum returns.
If BSV confirms strength above $40.9, it would mark a significant shift in structure, opening room for a larger breakout phase with potential targets toward $89.9 and ultimately $127.
📊 Technical Overview:
Support Zone: $21.0
Volume Breakout Level: $40.9
Primary Target: $89.9
Extended Target: $127
Bias: Accumulation → Bullish continuation
This structure suggests that once BSV reclaims $40+ with confirmed volume, it could enter the next high-volume expansion, aligning with the broader recovery cycles observed in major BTC-related assets.
📈 Outlook: Accumulating before potential expansion
🎯 Targets: $40.9 → $89.9 → $127

EURUSD: H1 Momentum PlayDaily Timeframe:
Price is now below the EMAs, which is a technical downtrend according to my definition. Although this is weak, the past two days have been inside bars. This tells me there's barely any movement or strength to the upside.
The bar for this latest session will likely engulf the previous bars. If the current session's bar closes below and engulfs the prior session's bar, there's a stronger indication of momentum to the downside.
H1 Timeframe:
The confluence with the daily timeframe is that the current session's bar is likely to engulf the inside bar that occurred over the past two days.
Right now, price is crossing below the EMA band, which we I anticipate momentum to the downside will pick up.
Price has not crossed the daily level, but I'm not too concerned there. On the H1 timeframe, price failed to make a higher high, which further makes me lean towards having a bearish sentiment.

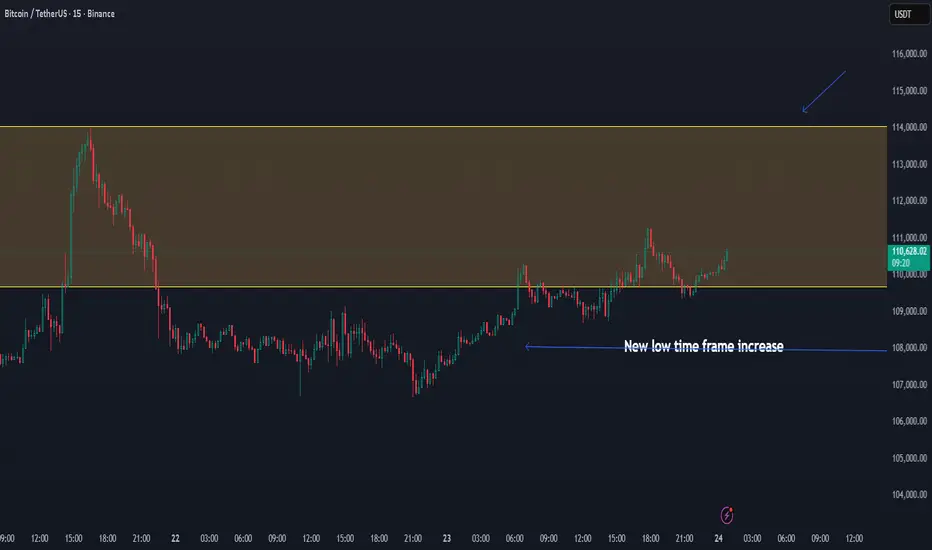
BTC/USDT — Positive Momentum Building, Eyeing Breakout To $114KBTC/USDT — Positive Momentum Building, Eyeing Breakout Toward $114K 🚀
Bitcoin continues to trade with strength after forming a new low-timeframe increase above the $108K level. This structural recovery confirms short-term bullish momentum, suggesting that BTC may now be ready to retest the upper range near $114K.
The consolidation inside this $108K–$114K range has created a stable base of support, while rising volume and sustained higher lows signal a potential expansion phase.
📊 Technical Overview:
Support: $108K
Range Resistance: $114K
Upside Target: $114K+
Bias: Positive / Bullish on short-term timeframe
If BTC maintains this momentum and confirms above $110K, the probability of a move toward $114K becomes increasingly strong — marking a continuation of the low-timeframe uptrend.
📈 Outlook: Positive momentum confirmed
🎯 Targets: $110K → $114K
EURCAD - Bounce Play at the Rail!EURCAD has been respecting its ascending channel beautifully , bouncing between the rails like clockwork. And right now, price is once again retesting the lower trendline, where buyers have consistently stepped in before launching new bullish waves.
🏹As long as this trendline and minor support around 1.62 hold firm, I’ll be watching closely for bullish rejections or reversal patterns to confirm a fresh leg upward. A clean bounce from here could send price back toward the orange structure zone around 1.6350, followed by a potential push toward 1.64+ if momentum builds up.
⚔️However, a break and close below 1.6180 would invalidate the setup and could shift control back to the bears — but until that happens, the path of least resistance remains to the upside.
In short, I’m expecting EURCAD to trap late sellers and fuel another rebound from the channel’s base, the kind of move that rewards patience and precision.
📊 All Strategies Are Good; If Managed Properly!
~Richard Nasr
