Understanding Liquidity: Where Big Players Hunt Stops
Understanding Liquidity: Where Big Players Hunt Stops
Ever wondered why price suddenly spikes through your stop-loss and reverses moments later? That’s not a coincidence—it’s liquidity at play. This article will teach you how liquidity zones work, why stop hunts happen, and how to avoid getting trapped like the crowd.
🔵 What Is Liquidity in Trading?
Liquidity refers to how easily an asset can be bought or sold without drastically affecting its price. But in practical trading, liquidity is more than just volume—it’s where traders *place* their money.
Large players—institutions, market makers, or big accounts—need liquidity to fill orders.
They target areas where many retail stop-losses or pending orders are stacked.
These areas are often just above resistance or below support—classic stop-loss zones.
To move large positions without slippage, smart money uses stop hunts to trigger retail orders and create the liquidity they need.
🔵 Where Do Liquidity Zones Form?
Liquidity often builds up in predictable areas:
Above resistance: Where shorts place stop-losses.
Below support: Where longs place stop-losses.
Swing highs/lows: Obvious turning points everyone sees.
Round numbers: e.g., 1000, 10,000, 50,000.
Breakout zones: Where breakout traders place entries or stops.
These zones act like magnets. When price approaches them, it accelerates—seeking the liquidity pool behind the level.
🔵 What Is a Stop Hunt?
A stop hunt happens when price moves just far enough to trigger stop-losses before reversing. This isn’t market noise—it’s an intentional move by big players to:
Trigger a flood of stop orders (buy or sell).
Fill their own large positions using that liquidity.
Reverse price back to fair value or the prior trend.
Example: Price breaks above resistance → stops get hit → institutions sell into that liquidity → price drops sharply.
🔵 Signs You’re in a Liquidity Grab
Look for these clues:
Fast spike beyond key levels followed by rejection.
Wick-heavy candles near highs/lows.
Price touches a level, then sharply reverses.
High volume on failed breakouts or fakeouts.
These are signs of a liquidity event—not a real breakout.
🔵 How to Trade Around Liquidity Zones
You can use liquidity traps to your advantage instead of becoming their victim.
Avoid obvious stops: Don’t place stops directly below support or above resistance. Instead, use ATR-based or structure-based stops.
Wait for confirmation: Don’t chase breakouts. Let price break, reject, then re-enter inside the range.
Watch for wick rejections: If price quickly returns after a level is breached, it's often a trap.
Use higher timeframe confluence: Liquidity grabs are more powerful when they align with HTF reversals or zones.
🔵 Real Example: Liquidity Sweep Before Reversal
In this chart, we see a textbook liquidity grab:
Price breaks below support.
Longs get stopped out.
Candle prints a long wick.
Market reverses into an uptrend.
This is where smart traders enter— after the trap is set, not during.
🔵 Final Thoughts
Liquidity is the invisible hand of the market. Stop hunts aren’t personal—they’re structural. Big players simply go where the orders are. As retail traders, the best thing we can do is:
Understand where traps are set.
Avoid being part of the crowd.
Trade the reaction, not the initial breakout.
By thinking like the smart money, you can stop getting hunted—and start hunting for better trades.
Trend Analysis

Mastering Order Blocks: How to Trade Like Smart MoneyIntroduction
Order Blocks (OBs) are one of the most critical concepts in Smart Money trading. They represent areas where institutional traders have entered the market with significant volume, typically leading to strong price movements. Identifying and trading Order Blocks gives traders an edge by aligning with the footprints of Smart Money.
What is an Order Block?
An Order Block is the last bearish candle before a bullish move for bullish OBs, or the last bullish candle before a bearish move for bearish OBs. These candles represent areas where institutions accumulated or distributed large positions, leading to a market shift.
Types of Order Blocks
A Bullish Order Block appears at the end of a downtrend or during a retracement just before the price moves sharply upward. It is typically represented by the last bearish candle prior to an impulsive bullish move. Price will often return to this level to mitigate institutional orders before continuing upward.
A Bearish Order Block, in contrast, forms at the end of an uptrend or retracement where price begins a downward reversal. It is characterized by the last bullish candle before a strong bearish move. Price tends to revisit this level to mitigate before continuing lower.
How to Identify a Valid Order Block
The key to identifying a valid Order Block is first observing a strong impulsive move, also known as displacement, that follows the OB candle. The move must also result in a break of market structure or a significant shift in direction. Order Blocks that produce Fair Value Gaps (FVGs) or Market Structure Shifts (MSS) tend to be more reliable. Another important sign is when price returns to the OB for mitigation, offering a potential entry.
Entry Model Using Order Blocks
After locating a valid OB, the next step is to wait for price to return to this area. The ideal entry happens within the OB body or near its 50% level. For extra confirmation, look for a Market Structure Shift or Break of Structure on a lower timeframe. Entries are more powerful when combined with additional elements like Fair Value Gaps, liquidity grabs, or SMT Divergences. The stop-loss should be placed just beyond the OB’s high or low, depending on the direction of the trade.
Refinement Techniques
To increase precision, higher timeframe OBs can be refined by zooming into lower timeframes like the 1M or 5M chart. Within a broad OB zone, identify internal market structure, displacement candles, or embedded FVGs to determine a more precise entry point. One effective refinement is the Optimal Trade Entry (OTE), which is often found at the 50% level of the Order Block.
Order Blocks vs. Supply and Demand Zones
While they may seem similar, Order Blocks are more narrowly defined and specifically related to institutional order flow. Supply and Demand zones are broader and typically drawn around areas of price reaction, but OBs are derived from the final institutional candle before a large move and are often confirmed by structure shifts or displacement. This makes OBs more precise and actionable in the context of Smart Money concepts.
Target Setting from Order Blocks
Targets after entering from an OB should align with liquidity objectives. Common targets include internal liquidity like equal highs or lows, or consolidation zones just beyond the OB. External liquidity targets such as previous major swing highs or lows are also ideal, especially when they align with imbalances or Fair Value Gaps. It's important to adjust targets based on the current market structure and trading session.
Common Mistakes to Avoid
A frequent mistake is treating any candle before a move as an OB without verifying key signals like displacement or a Break of Structure. Entering without other confirmations, such as an MSS or liquidity sweep, can lead to poor trades. Another common error is placing the stop-loss too tightly within the OB, instead of just beyond it, increasing the chance of premature stop-outs. Traders should also avoid executing OB trades during low-liquidity sessions where price action can be unpredictable and wicky.
Final Thoughts
Order Blocks are foundational to Smart Money trading. They allow you to enter where institutions have placed large positions and offer clear invalidation and entry logic. With practice, you can identify high-quality OBs and combine them with other concepts like FVGs, MSS, and SMT for powerful, precise trades.
Practice on different timeframes and assets, and always look for clean displacement and structure confirmation. Mastering OBs is a big step toward becoming a consistently profitable trader.
Trust the Blocks. Trade with Intention.

GOLD 1H CHART ROUTE MAP & TRADING PLAN FOR THE WEEKHey Everyone,
Please see our updated 1h chart levels and targets for the coming week.
We are seeing price play between two weighted levels with a gap above at 3260 and a gap below at 3217. We will need to see ema5 cross and lock on either weighted level to determine the next range. EMA5 is lagging below 3306 so will need a close above and then below to confirm.
We will see levels tested side by side until one of the weighted levels break and lock to confirm direction for the next range.
We will keep the above in mind when taking buys from dips. Our updated levels and weighted levels will allow us to track the movement down and then catch bounces up.
We will continue to buy dips using our support levels taking 30 to 40 pips. As stated before each of our level structures give 20 to 40 pip bounces, which is enough for a nice entry and exit. If you back test the levels we shared every week for the past 24 months, you can see how effectively they were used to trade with or against short/mid term swings and trends.
The swing range give bigger bounces then our weighted levels that's the difference between weighted levels and swing ranges.
BULLISH TARGET
3260
EMA5 CROSS AND LOCK ABOVE 3260 WILL OPEN THE FOLLOWING BULLISH TARGETS
3308
EMA5 CROSS AND LOCK ABOVE 3308 WILL OPEN THE FOLLOWING BULLISH TARGET
3340
EMA5 CROSS AND LOCK ABOVE 3340 WILL OPEN THE FOLLOWING BULLISH TARGET
3382
EMA5 CROSS AND LOCK ABOVE 3382 WILL OPEN THE FOLLOWING BULLISH TARGETS
3428
EMA5 CROSS AND LOCK ABOVE 3428 WILL OPEN THE FOLLOWING BULLISH TARGETS
3478
BEARISH TARGETS
3217
EMA5 CROSS AND LOCK BELOW 3217 WILL OPEN THE BEARISH TARGETS
3174
EMA5 CROSS AND LOCK BELOW 3174 WILL OPEN THE SWING RNGE
3126
3078
EMA5 CROSS AND LOCK BELOW 3078 WILL OPEN THE SECONDARY SWING RANGE
SECONDARY SWING RANGE
3034 - 2979
As always, we will keep you all updated with regular updates throughout the week and how we manage the active ideas and setups. Thank you all for your likes, comments and follows, we really appreciate it!
Mr Gold
GoldViewFX

Bitcoin: First Leg Of Wave 5 To 109K.Bitcoin has lingered around the 95K resistance area over the previous week. In my opinion this is a sub wave iii completion (5 mini waves can be counted within the bullish breakout leg). This implies there is a greater probability of a retrace or sub wave iv (see wave count on chart). The retrace can go as low as the 90K support without overlapping sub wave i which would keep the bullish impulse in play. Also there is enough evidence here to suggest this structure is likely the first wave of the broader Wave 5 which can see a test of the 109K high over the coming months.
The current high (see arrow) shows signs of potential reversal at a location where such a pattern can be expected. The question is, when will it retrace and how far? It is anyone's guess. This is where you have to have the ability to adjust as the market provides new information. Until then the best we can do is assess loose probabilities and wait to see how the market aligns or not.
The adjustment process is two fold: evaluating support/resistance levels and assessing the RISK associated with a given scenario. For example, the illustration on the chart shows a retrace back to 90K, this or some variation of this scenario may or may not unfold. The key is to have levels identified in advance and then WAITING to see how the market behaves at such levels. Does it confirm our idea or not? In the case of Bitcoin now, the 95K area resistance is sticking and a reversal pattern has appeared which adheres to the retrace scenario, but how far it retraces is up to Bitcoin. We have to wait and see what type of bullish reversals appear and where they appear before RISK can be assessed for a swing trade on this time frame.
Markets that linger around levels can be very hard to trade if you are the type that forces trades or assert opinions. Slow grinds are especially tough to sit through which is why I always suggest evaluating smaller time frames while keeping this bigger picture in mind. There are plenty of smaller opportunities to capitalize on if you can recognize the support/resistance levels and trend structure on the smaller time frames without losing site of the bigger picture.
On this time frame for swing trades, I am not interested in the short side. I prefer to wait for the retrace (wave iv) measure to see how far it goes, WAIT for the reversal confirmation, then quantify the RISK from that point. IF this scenario appears, I would be anticipating a retest of the 100K resistance and expecting a greater chance of a breakout to a higher high (low to mid 100ks)? This can take at least two weeks to play out in my opinion. And if this scenario does not play out, then adjust to the whatever new information the market is presenting.
Thank you for considering my analysis and perspective.

Bitcoin Price Action Analysis – Bearish Correction Toward DemandHello Guys!
Let's analyze btc!
Rising Trendline Break: The bullish structure has broken down as the price failed to hold above the key support region around $96,000–$96,200.
Targeted Demand Zone: The highlighted purple box between $94,200 and $94,700 represents a demand zone that has previously shown strong buyer interest. The current structure suggests Bitcoin may revisit this zone for a potential bounce.
Bearish Momentum: A large arrow indicates the directional bias toward the downside, aligning with the correction and market sentiment.
Fake RSI Divergence: The RSI panel indicates a “Fake Divergence” pattern, which may have misled early bulls. RSI has since dropped and currently hovers in the neutral zone, with no strong bullish signals yet.
_____________________________
Conclusion:
Unless a strong bounce occurs around current levels, Bitcoin looks poised to correct further toward the $94,200–$94,700 demand zone. Traders should watch for reactionary price action and bullish reversal patterns before considering long entries.

BITCOIN → Correction to the risk zone. Rise or fall?BINANCE:BTCUSDT has updated its local maximum to 97,900, the market structure is quite positive, but still depends on the fundamental background and the behavior of the S&P 500.
The fundamental reasons that influenced the growth are the improvement in the tariff situation in the US and relations with China. Bitcoin's growth strengthened as the SP500 index rose, with which it has a fairly high correlation. In the second half of this week, the price broke out of the two-week consolidation, breaking through the resistance level of 95,500 and updating the local maximum. A correction is forming within the local upward channel.
95,000 is the liquidity and risk zone. That is, if the bulls hold their defense above 95K during the retest, Bitcoin will continue to grow in the short and medium term. Otherwise, a break of 95K could trigger a drop to 92K-88K.
Resistance levels: 97,425, 99,475
Support levels: 95,500, 92,000
All eyes are on the 95.5K support level, below which a huge liquidity pool has formed. Growth may be influenced by a retest (false breakout of support) and an imbalance of forces in the market. But we need to be careful, as the market will react to economic data. BUT! A return of prices to the selling zone (below 95000 - 95500) and the inability to continue growth could trigger a correction and liquidation.
Best regards, R. Linda!

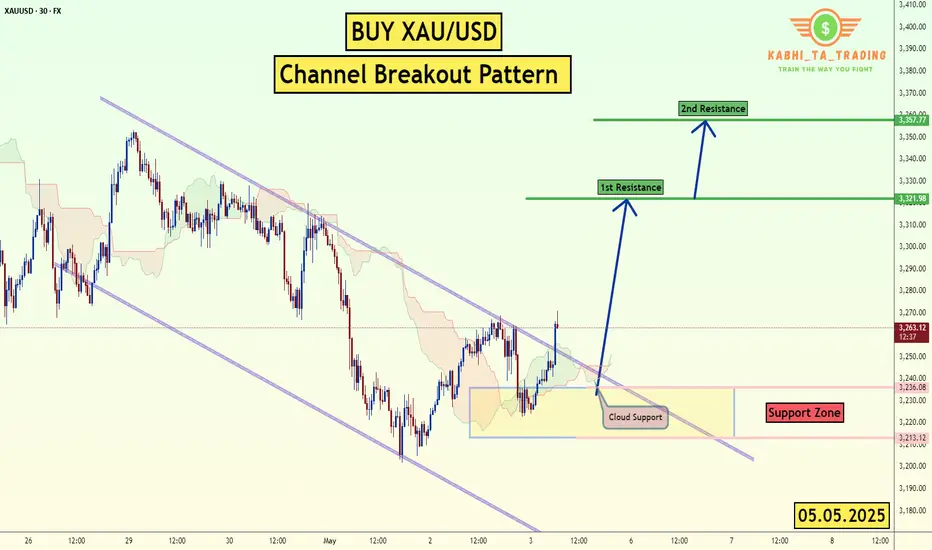
XAU/USD - Channel Breakout (05.05.2025)The XAU/USD pair on the M30 timeframe presents a Potential Buying Opportunity due to a recent Formation of a Channel Breakout Pattern. This suggests a shift in momentum towards the upside and a higher likelihood of further advances in the coming hours.
Possible Long Trade:
Entry: Consider Entering A Long Position around Trendline Of The Pattern.
Target Levels:
1st Resistance – 3321
2nd Resistance – 3357
🎁 Please hit the like button and
🎁 Leave a comment to support for My Post !
Your likes and comments are incredibly motivating and will encourage me to share more analysis with you.
Best Regards, KABHI_TA_TRADING
Thank you.
BTC - Golden Pocket test & what comes next?Bitcoin (BTC) has been steadily recovering from its January correction, entering a promising uptrend that has now brought it to a crucial technical juncture: the Golden Pocket Fibonacci zone, which lies between the 61.8% and 65% retracement levels. This area is widely watched by traders, as it often serves as a springboard for either significant reversals or continuation of the trend.
4H timeframe
On the 4H timeframe, BTC recently formed an ascending triangle, a classic bullish continuation pattern. The price managed to break above the triangle’s resistance, but it failed to hold above this level, closing back below the breakout zone. This lack of follow-through signals weakness and suggests that a short-term pullback could be imminent.
Daily timeframe
Turning to the daily chart, the situation becomes even clearer. After reaching the Golden Pocket, BTC printed a bearish engulfing candlestick, a strong reversal signal. The subsequent price action saw BTC break below both the 4H support and a daily FVG, further strengthening the case for a deeper correction or trend reversal. If this downward momentum continues, the next major support zone is likely between $89,000 and $91,000. This area marks an imbalance created during the previous rally and is a natural target for buyers to step in.
However, the bullish scenario is not entirely off the table. If BTC can reclaim and hold above the Golden Pocket, it would signal a resumption of the uptrend, with the next key target being the psychologically significant $100,000 level. For now, though, the technical structure suggests that a retracement toward the $89–91k zone is more likely before any attempt at new highs.
Conclusion
In summary, Bitcoin’s recent test of the Golden Pocket Fibonacci zone has resulted in a short-term rejection. The immediate outlook is cautious, with a likely retracement toward $89–91k. Traders should watch closely for confirmation signals in both price action and volume before making new commitments. A successful hold above the Golden Pocket would open the door for a rally toward $100,000, but for now, patience and careful observation are advised.
Thanks for your support.
- Make sure to follow me so you don't miss out on the next analysis!
- Drop a like and leave a comment!

Lingrid | GOLD Weekly OUTLOOK: Poised for BULLISH ReversalOANDA:XAUUSD market has retraced approximately 50% of the previous month's range and is approaching the critical golden zone at the 61.8% Fibonacci retracement level. After experiencing such strong bullish momentum, we've now witnessed two consecutive red weeks, suggesting a potential reversal point.
Price is currently testing the previous resistance zone, which has now established itself as support—a classic market structure confirmation. The formation of equal weekly lows beneath current price levels represents significant liquidity that could fuel an upward move.
Furthermore, the price action appears to be completing an ABC pullback pattern, which typically precedes trend continuation. This bullish outlook is further reinforced by the emergence of a falling wedge pattern, a technical formation that frequently resolves to the upside.
Overall, I expect prices to move higher in the coming week, potentially catalyzed by the upcoming Federal Funds Rate decision, which could provide the fundamental backdrop for the next leg up in gold's price trajectory.
Traders, if you liked this idea or if you have your own opinion about it, write in the comments. I will be glad 👩💻

BTCUSDT - Potential Long Setup Developing from FVG and Fib levelOverview:
Bitcoin (BTCUSDT) on the 1H timeframe is currently exhibiting a controlled retracement following a local top. This structure presents a potential opportunity for a long setup based on confluence between an FVG (Fair Value Gap) and key Fibonacci retracement levels. The chart highlights a likely scenario where price may continue to correct lower into a defined area of interest before resuming bullish momentum.
Market Context:
After a strong impulsive move upward, BTC appears to be in a corrective phase. The recent price action has formed a series of lower highs and lower lows, which is characteristic of a short-term downtrend within a broader uptrend context. This kind of pullback behavior is often necessary for healthy continuation to the upside and can offer high-probability entries for trend continuation traders.
Fair Value Gap (FVG):
A notable fair value gap has been identified in the 94,250–94,700 zone. This zone represents an inefficiency in the market where price rapidly moved without significant opposition, leaving behind a gap between wicks of adjacent candles. Price often returns to such areas to rebalance order flow before making its next decisive move.
Fibonacci Confluence:
The chart includes key Fibonacci retracement levels drawn from the recent swing low to swing high.
* The 0.618 Fibonacci retracement level lies just above the FVG, providing strong technical confluence.
* The 0.65 level is marked as the ideal entry zone and sits within the FVG, further validating it as a high-probability support region.
* The 0.786 level is also marked, and although deeper, it represents the final line of defense for this bullish scenario.
Anticipated Price Action:
A bullish projection is illustrated on the chart where price is expected to:
1. Continue declining toward the 0.65–0.618 Fibonacci confluence zone.
2. Wick into the FVG and reject from that level.
3. Form a short-term higher low structure and push back to reclaim prior structure highs.
4. Confirm bullish structure continuation with an impulsive breakout from the descending channel.
Market Structure and Liquidity Outlook:
The broader structure remains bullish on higher timeframes. The retracement into the FVG would serve the dual purpose of:
* Grabbing liquidity below recent lows.
* Mitigating unfilled buy-side inefficiency.
Such a development would suggest that institutional participants are filling long orders in the discounted price region, setting the stage for a potential continuation of the broader bullish trend.
Key Technical Zones:
* FVG Zone: 94,250 – 94,700
* Fibonacci Confluence: 0.618–0.65 retracement levels
* Liquidity Pool: Below current swing lows leading into the FVG
Conclusion:
BTCUSDT is approaching a critical decision zone. A move into the FVG combined with Fibonacci retracement confluence presents an attractive area for potential long entries. Confirmation of bullish reversal structure within this zone could offer a strong trade opportunity in alignment with the broader trend. Patience and precision will be key in waiting for the price to tap into this area and show intent to reverse.

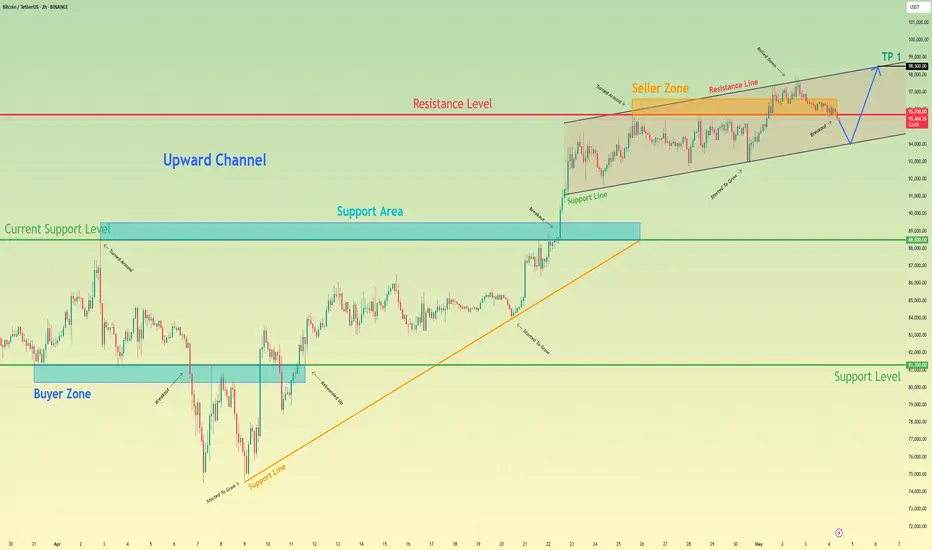
Bitcoin can bounce from support line of channel to 98500 pointsHello traders, I want share with you my opinion about Bitcoin. Looking at this chart, we can observe how the price of Bitcoin has been in recent price action. The asset had been confidently moving inside an upward channel, building structure through higher highs and higher lows. Each upward impulse was supported by pullbacks to the support line, showing continued buyer pressure. The latest breakout above the support area confirmed a bullish continuation, and the price entered the seller zone, where it faced resistance. Despite multiple attempts to break through, the price repeatedly turned around, forming a tight triangle pattern within the upper boundary of the channel. Currently, the price has broken down from the triangle, but it still holds above the channel's lower line. Given that the channel remains intact and there's no strong breakdown of the structure, I expect the price to rebound from the lower boundary and continue climbing toward my TP 1 at 98500, which aligns with the resistance line of the channel. Please share this idea with your friends and click Boost 🚀
(BTC/USD) 1H Trade Setup – Key Entry, Stop Loss & Dual TargetEntry Point: 95,431
Stop Loss: 95,264
Target Points:
Upside (Target 1): 100,674 (Potential gain: +5.36%)
Downside (Target 2): 86,614 (Potential loss: -7.57%)
Trade Setup:
Risk-Reward Ratio:
Approx. 1:0.7 (Not ideal; the reward is smaller than the potential loss)
Support Zones:
Highlighted in purple beneath the entry zone — this indicates a historically strong support area.
Resistance Zones:
The upper purple zone marks the next significant resistance around 100,000–100,795.
Technical Indicators:
50 EMA (Blue Line): Indicates mid-term trend support, currently holding price action.
Price Action: BTC appears to be retracing toward support after a bullish rally.
Interpretation:
The setup implies a long (buy) position with a very tight stop loss.
The price is nearing a support zone, and if it holds, there's potential for an upward move to the target at 100,674.
However, if price breaks below 95,264, a sharp drop to 86,614 is anticipated.

EURO - Price can rise to top part of flat from support areaHi guys, this is my overview for EURUSD, feel free to check it and write your feedback in comments👊
Some time ago, price entered to wedge, where it bounced from support line and rose to $1.0860 level, breaking $1.0470 level.
Then price broke $1.0860 level too, but then it made correction to support line of wedge and then made upward impulse.
Euro exited from wedge and continued to grow to $1.1260 level, after which broke this level and started to trades in flat.
Inside flat, price rose to top part of flat and then made correction to support area, where it some time traded close.
At the moment, Euro trades inside support area, near support level, so, I think that price can correct to $1.1260 level.
After this movement, in my mind, EUR can start to grow to $1.1570 top part of the flat.
If this post is useful to you, you can support me with like/boost and advice in comments❤️

GOLD ( XAUUSD ) : H4 / D1 : Big Long !!!Hello Traders! 👋
What are your thoughts on Gold?
After a strong upward move, gold entered a corrective phase upon reaching the $3500 resistance zone.
This correction could offer a buy-the-dip opportunity, with potential for a move back toward the recent highs.
XAUUSD
Market price : 3240
Buy limit : 3140 - 3120
Tp1 : 3240
Tp2 : 3340
Tp3 : 3500
Tp4 : 3750
Sl : 3030 ( 100 pip )
Don’t forget to like and share your thoughts in the comments! ❤️

Gold can correct to support level and then continue to move upHello traders, I want share with you my opinion about Gold. After studying this chart, we can track the progression of Gold's price action from strong bullish momentum to its current consolidation. Initially, the market trended confidently inside an upward channel, with steady growth supported by the lower boundary of the channel and occasional corrections after touching the resistance line. Each pullback respected previous support zones, a strong signal of buyer control at the time. The most impulsive move came after the price exited the buyer zone, followed by a clean breakout above the resistance line of the channel. However, once the price entered the seller zone, we saw the momentum start to fade. A strong rejection occurred near the resistance level at 3370, which eventually triggered a series of lower highs and shifted the market into a more neutral, range-bound phase. Currently, Gold is trading inside a defined range between 3205 and 3370. The bottom of this range aligns perfectly with the buyer zone, which already acted as a strong support during the last decline. We can also observe the market beginning to show signs of reversal after tapping the zone again. Given the reaction from the support area and the structure of the range, I expect the price can bounce back and make another attempt to reach the 3370 resistance level, which is my TP1 for this scenario. Please share this idea with your friends and click Boost 🚀

GOLD WEEKLY CHART MID/LONG TERM ROUTE MAPHey Everyone,
Quick update on our weekly chart idea, it's been playing out beautifully, helping us track the move down and catch the move back up.
The weekly chart structure is unfolding in line with prior analysis. Price action reached the upper boundary of the ascending Goldturn channel and temporarily broke above it; however, the EMA5 remained confined within the channel, validating the upper trendline as dynamic resistance.
A sustained EMA5 breakout above the channel would have confirmed a potential continuation of the breakout. Currently, price is consolidating within the Goldturn channel, with the 3189 level acting as immediate support. The channel half line of the channel may serve as a stronger swing support area, though price may not retest this level immediately. As the channel continues its upward trajectory, the midline will also rise, potentially aligning with price in future upward movements.
This is the beauty of our Goldturn channels, drawn using weighted averages instead of pure price action. This unique approach helps us clearly identify fake-outs and real breakouts, cutting out much of the noise that usually confuses traders.
Moving forward, we’ll focus on smaller timeframes (1H and 4H) to buy dips off the weighted Goldturns, aiming for clean 30–40 pip moves. Ranging markets are perfect for this style, allowing us to capitalize on quick moves without getting caught in the chop of larger swings.
Thanks again for all your likes, comments, and follows, we really appreciate the support!
Mr Gold
GoldViewFX

GOLD 4H CHART ROUTE MAP UPDATE & TRADING PLAN FOR THE WEEKHey Everyone,
Please see our updated 4h chart levels and targets for the coming week.
We are seeing price play between two weighted levels with a gap above at 3282 and a gap below at 3224. We will need to see ema5 cross and lock on either weighted level to determine the next range. We have a bigger range in play then usual.
We will see levels tested side by side until one of the weighted levels break and lock to confirm direction for the next range.
We will keep the above in mind when taking buys from dips. Our updated levels and weighted levels will allow us to track the movement down and then catch bounces up.
We will continue to buy dips using our support levels taking 30 to 40 pips. As stated before each of our level structures give 20 to 40 pip bounces, which is enough for a nice entry and exit. If you back test the levels we shared every week for the past 24 months, you can see how effectively they were used to trade with or against short/mid term swings and trends.
The swing range give bigger bounces then our weighted levels that's the difference between weighted levels and swing ranges.
BULLISH TARGET
3282
EMA5 CROSS AND LOCK ABOVE 3282 WILL OPEN THE FOLLOWING BULLISH TARGET
3343
EMA5 CROSS AND LOCK ABOVE 3343 WILL OPEN THE FOLLOWING BULLISH TARGET
3404
EMA5 CROSS AND LOCK ABOVE 3404 WILL OPEN THE FOLLOWING BULLISH TARGET
3439
EMA5 CROSS AND LOCK ABOVE 3439 WILL OPEN THE FOLLOWING BULLISH TARGET
3503
BEARISH TARGETS
3224
EMA5 CROSS AND LOCK BELOW 3224 WILL OPEN THE FOLLOWING RETRACEMENT RANGE
3190
3138
EMA5 CROSS AND LOCK BELOW 3138 WILL OPEN THE SWING RANGE
SWING RANGE
3088 - 3046
EMA5 CROSS AND LOCK BELOW 3046 WILL OPEN THE SECONDARY SWING RANGE
SECONDARY SWING RANGE
3015 - 2988
As always, we will keep you all updated with regular updates throughout the week and how we manage the active ideas and setups. Thank you all for your likes, comments and follows, we really appreciate it!
Mr Gold
GoldViewFX

GOLD DAILY CHART ROUTE MAP UPDATEHey Everyone,
Here’s the latest update on our daily chart idea, it’s been playing out perfectly!
The daily chart is unfolding as projected, with price action respecting the structure of the Goldturn ascending channel. A breakout above the channel was confirmed by the EMA5 crossing and closing above the upper boundary. This move extended to test the 3433 Goldturn axis level, where price met resistance. Notably, EMA5 failed to sustain a close above 3433 Goldturn level, confirming a lack of bullish momentum and validating a rejection. Price has since reversed, re-entering the channel.
Below, broader support is identified around 3104, which aligns with the channel’s half line. While this level may not be reached immediately, the current price range between 3297 and 3104 is significant. We may observe continued consolidation within this zone, with the half line gradually ascending. This dynamic could result in price interacting with the half line earlier than a direct move to 3104, providing potential bounce opportunities best monitored through lower timeframes for refined entries and validations.
This is the beauty of our Goldturn channels, drawn using weighted averages instead of pure price action. This unique approach helps us clearly identify fake-outs and real breakouts, cutting out much of the noise that usually confuses traders.
Moving forward, we’ll focus on smaller timeframes (1H and 4H) to buy dips off the weighted Goldturns, aiming for clean 30–40 pip moves. Ranging markets are perfect for this style, allowing us to capitalize on quick moves without getting caught in the chop of larger swings.
Thank you all again for your continued likes, comments, and follows, we truly appreciate your support!
Mr Gold
GoldViewFX

BTC Building Strength – Breakout Ahead?$BTC/USDT Weekly Analysis
Bitcoin continues to respect the 50 EMA on the weekly timeframe — a key dynamic support level that has consistently held throughout this bullish structure.
Each time BTC corrected, it found support near the 50 EMA before bouncing back with strength. The current structure mirrors past price action, with price again rebounding from the EMA after a consolidation phase.
We’re also seeing a pattern of lower highs forming a potential descending resistance line. A breakout above this trendline could trigger a fresh rally, possibly taking BTC to new highs.
As long as Bitcoin stays above the 50 EMA, the mid-to-long-term bias remains bullish. A confirmed breakout above the descending resistance could open the door for a strong upside continuation.
DYOR, NFA
Thanks for following along — stay tuned for more updates!

GOLD BUYGreetings traders this is my analysis on Gold and it is a Long shot for a Buy.
📊 Technical analysis of gold (XAU/USD) — 4h timeframe
🔺 Formation: Head & Shoulders
The pattern is now even more clearly presented with:
Left shoulder – a smaller consolidation move.
Head – a higher peak (higher high).
Right shoulder – a weaker attempt to recover, which confirms the loss of bullish strength.
Usually, such a pattern is followed by a corrective move downwards (which has already been partially seen).
🔄 Potential trend change zone
Highlighted support in the zone:
3,162 – 3,128 USD — very important for confirming the bullish scenario.
The shown "bounce zone" suggests a possible purchase if the price bounces from this area.
📈 Predicted path
Expected:
Fall to support (around 3,150–3,130).
Reversal and continuation of the uptrend.
Target zone: 3,503 – 3,505 USD.
✅ Conclusion and strategy:
Scenario 1 (main): Buy zone between 3,160–3,130 if price action signal is seen (pin bar, engulfing).
Target: 3,500+
Stop loss: below 3,120 (below support).
Scenario 2 (riskier): If price does not bounce from that zone — possible further deepening towards 3,080–3,000.
Dear Traders like,comment let me know what do you think

#USDCHF: Will USD Breakthrough The Strong Bearish Downtrend? The USDCHF currency pair has experienced significant volatility due to the ongoing trade dispute between the United States and China, which has led to a substantial decline in the DXY index. Consequently, CHF and JPY have emerged as the most stable currencies in the market.
Despite the USDCHF currency pair reversing its bullish trend, we anticipate a potential reversal back to a bearish position. We believe this reversal may be a temporary trap, and the currency pair is likely to regain its bullish position in the future.
There are two potential areas where the USDCHF currency pair could reverse from its current trend. The first area is relatively early, and if the USDCHF currency pair crosses a specific region, we may have a second safe option that could provide greater stability.
We extend our best wishes and best of luck in your trading endeavours. Your unwavering support is greatly appreciated.
If you wish to contribute, here are several ways you can assist us:
- Like our ideas
- Comment on our ideas
- Share our ideas
Team Setupsfx_🚀❤️

THE KOG REPORT THE KOG REPORT
In last week’s KOG Report we said we would stick with our plan and look to continue with the move downside. This worked well for us and also gave us the bounce we wanted pre-event for the long trade following the retracement. For NFP, we released the KOG Report again, suggesting a move downside into the key level, then a bounce for the long. We got the short, we then got the TAP AND BOUNCE for the long, although, after having protected and managing it we closed at break even with the minimal lot that was left on the table.
We ended the week with another stellar performance on the EA, the algo and the indicators, not only on Gold, but also the other pairs we trade.
So, what can we expect from the week ahead?
Simple one this week as it’s bank holiday. Expect thin volume during the London session with a potential burst of volume during the US session. We have pathed out the levels and what to look for, with the first resistance just above, which is ideally what we want to target and reject to give us a further move downside. There is a key level above, 3250-55, the bias will be bearish below for now, unless broken which will give us the extension of the move into 3270-75 which is where sellers may get another opportunity.
Red boxes:
Break above 3235 for 3243, 3245, 3247, 3252 and 3270 in extension of the move
Break below 3220 for 3210, 3206, 3196, 3188 and 3179 in extension of the move
Bank holiday in the UK so not sure if we’ll be around much but we’ll re-visit the charts on Tuesday.
Please do support us by hitting the like button, leaving a comment, and giving us a follow. We’ve been doing this for a long time now providing traders with in-depth free analysis on Gold, so your likes and comments are very much appreciated.
As always, trade safe.
KOG

BTC/USD) bullish trend analysis Read The ChaptianSMC Trading point update
Technical(BTC/USDT) analysis outlines a bullish outlook with key technical levels and scenarios. Here's a breakdown of the idea:
Key Observations:
1. Trend Break and CHoCH (Change of Character):
The chart shows a clear break of the downtrend, confirmed by the CHoCH label — a common Smart Money Concept (SMC) signal indicating a potential trend reversal from bearish to bullish.
2. Key Zones Highlighted:
EVC-Buying Zone: Around 86,000 – 88,000 (aligned with EMA 200), marked as a strong accumulation area.
New Support Level: Around 92,000 – 93,000, potentially forming a bullish support after the recent rally.
Resistance Levels: Two major resistance zones near:
99,600 (intermediate resistance and target)
106,400 (final target)
3. RSI Indicator:
RSI is near 64, indicating strong momentum but not yet overbought — a potential sign of further upside.
4. Two Bullish Scenarios:
Scenario 1 (Aggressive Bullish): BTC continues upward from the current level and breaks above resistance toward the 106,447 target.
Scenario 2 (Retracement Bullish): BTC dips to the new support or even into the buying zone (86–88k), then rebounds to reach the same targets.
Mr SMC Trading point
---
Idea Summary:
The chart suggests bullish continuation, with potential pullbacks into strong demand zones. It supports both breakout and retracement entries, with targets at 99,632 and 106,447. If price holds above EMA 200 and RSI remains supportive, the upside thesis remains valid.
Pales support boost 🚀 analysis follow)
