How to position the market after gold falls to around 3280Gold began to fall after rebounding to around 3313, and has now fallen below the important support of 3300. Looking at it now, gold is most likely to be a relay of the decline. The rebound of gold will continue to be bearish. The current 1-hour moving average of gold tends to stick together and diverge downward, and the decline is a bit sharp. If it continues to cross downwards to form a dead cross, then there is still room for gold shorts to fall. It is recommended to wait and see the support of the previous low of 3260. If the support is not broken, then consider going long. In the evening, we need to pay attention to the fluctuations that may be caused by ADP and PCE data.
Many friends who have read my posts have reported that my trading ideas and strategies are very helpful to them. I always firmly believe that profitability is the criterion for measuring strength, and seizing the opportunity is the key to victory. I will post every day to share my trading strategies and ideas for free. If you have just entered the market and don’t know how to make more profits, if you are already in it but the harvest is not ideal, then you might consider taking a look at my profile.
OANDA:XAUUSD FX:XAUUSD FOREXCOM:XAUUSD FXOPEN:XAUUSD TVC:GOLD
Trend Lines

MSFT Setup After EarningsEarnings season is heating up and Microsoft (MSFT) is once again in the spotlight. With its dominance in cloud and AI, the next move could be explosive.
Here’s how pro Im thinking my setting up:
🔹 $390 – A bold speculative entry for breakout hunters.
🔹 $365 – A defensive entry on post-earnings pullback to support.
🔹 $345 – The opportunity zone if a sharp drop offers value.
🎯 Profit Targets:
TP1: $410 – Psychological and technical resistance.
TP2: $426 – Momentum continuation level.
TP3: $445–$450 – Ambitious upside for long-term riders.
Whether you’re playing momentum or patiently buying dips, MSFT is offering clear levels. Stay sharp.
Disclaimer: This is not financial advice. All trading involves risk. Do your own research or consult a professional advisor before investing.

OIL buy setup H1Hello! Friends,
Greetings. Please leave a Like if you like the idea.
Before start talking about technical Let's share your LOVE by giving me LIKES to support this work. Thanks in advance.

Home of ABBA, IKEA, and Volvo (USD/SEK)USD/SEK has broken below major multi-year support.
While below there we are looking for shorts (i.e. bullish the Swedish krona)
The daily chart has corrected higher but the trend is down.
Another breakdown through the lows could setup another leg lower
Thoughts?

Gold: Bearish Shooting Star Reversal?The trend in gold is higher and no doubt it can go higher still.. BUT
There is a possible short setup
because:
A) It's very overbought relative to its weekly average
B) A Weekly shooting star reveral pattern took place on the weekly chart
C) The daily chart shows a possible breakdown
Thoughts?

EURCHFPrice looks to be reacting to a very minor weekly support zone. H4 respecting trendline support, H4 possible double bottom and current current candle most likely to close as an engulfing. If the bulls have power next stop is 0.95000.

AUDCHFWe've got ourselves a nice little bullish flag forming on the H1 at H4 resistance zone that was broken. Once we break out with a possible retest price should head up to next possible resistance of 0.55000

Gold Short: Walkthrough of Wave Counts and H&SThis is the video walkthrough of the Elliott Wave Analysis of Gold that I posted 8 hours earlier. I made an update to the head-and-shoulders in this video and discusses the change in neckline. I also discuss about why I chose to label the waves as they are and how they might have been labelled otherwise. In the end, this is still a short call but with the H&S tilt shifted down.
I realised that I missed out on how to do the profit target, but please refer to the linked static idea for the profit target and stop loss. Thank you!

Ethereum about to flyAs the falling channel for ethereum has broken few days ago, now the weekly MACD is about to make a bullish cross as well, and that makes ethereum to fly soon

ETH is showing a potential reversal !on the 15 minute chart,
Price is holding strong above the support zone
and is now testing resistance at $1815
if it breaks, the next target is $1830.
scalpers don't miss this breakout opportunity!

USDJPY 4h Long Setup | Low Risk High Reward Market broke the descending structure with strong bullish impulse followed by higher lows respecting new trendline
Price retested the previous resistance now turned support zone with a bullish reaction
Entry is taken after confirmation of the retest holding and bullish continuation signs
Entry : 142.494
SL : 140.676
TP : 148.270
RR 1 : 3.2
Price action aligned with short-term bullish reversal structure and clear demand zone defense
Let price do the work

EURGBP Short SetupEURGBP Short Setup
4H Chart Trendline Breakdown and Retest
Entry : 0.84944
Stop Loss : 0.86678
Take Profit : 0.83310
RR 1 to 1.9
Market broke below the ascending support and retested the underside of a broken trendline confluence. Bearish pressure is building as price fails to reclaim 0.85396 zone. Clean structure for continuation to the downside.
Price is now respecting lower highs with momentum shifting beneath structure. This setup targets the previous demand zone near 0.833 region where price consolidated before the last impulse up.
As long as price holds below 0.854 zone, bearish bias remains valid.

EURUSD Spring Setup: Ready to Launch?it's the calm before the storm
EURUSD formed a spring setup, rejecting below a key intraday level with strong volume and wick reentry. Price bounced off a rising trendline, reclaiming structure after a false breakout — classic Wyckoff-style spring. Anticipating a move toward the 4H resistance at 1.1424. Stop below the spring low for a clean R:R.

UBER Long Breakout Play | 4H ChartUber Technologies Inc. (UBER) just broke out of a long-standing descending trendline, confirming a bullish structural shift.
Entry: $79.43
SL: $70.45
TP: $86.93
R:R : 1:1.8
Technical Highlights
• Clean breakout above descending trendline and horizontal resistance at $77.35
• Retest and hold above previous resistance confirms bullish strength
• Strong bullish momentum and candle close above key levels
• Targeting the next major resistance zone near $87
Bias
Bullish continuation as long as $77.35 holds as support.
Plan
Trail stop if price sustains above $82. Look for volume confirmation on breakout retest.

AUDUSD InsightHello to all our subscribers!
Please feel free to share your personal opinions in the comments. Don’t forget to hit the Booster and subscribe!
Key Points
- Ukrainian President Volodymyr Zelensky stated, “We all want this war to end fairly. There should be no rewards for Putin—especially not territorial concessions.”
- As trade negotiations between the United States and China remain stalled, U.S. Treasury Secretary Scott Bessent warned that China bears responsibility for the tariffs and could lose up to 10 million jobs if the tariffs persist.
- U.S. Commerce Secretary Howard Lutnick said in an interview with CNBC, “We already have a finalized agreement, but we must wait for approval from their prime minister and parliament.”
- The Trump administration officially announced a temporary two-year suspension of tariffs on foreign auto parts used in vehicles manufactured within the United States.
This Week's Major Economic Calendar
+ April 30: Germany Q1 GDP, Germany April Consumer Price Index (CPI), U.S. April ADP Non-Farm Employment Change, U.S. March Core Personal Consumption Expenditures (PCE) Price Index
+ May 1: Bank of Japan Interest Rate Decision
+ May 2: Eurozone April CPI, U.S. April Non-Farm Payrolls (NFP), U.S. April Unemployment Rate
AUDUSD Chart Analysis
Although a downward reversal was initially anticipated, the pair continues to test upper resistance levels. For a clearer directional outlook, it must either break through the resistance above or fall below the 0.63000 level.
- If the upper resistance is broken, a rise toward the 0.68000 level is expected.
- Conversely, if the price breaks below 0.63000, a decline toward the 0.60000 level is likely.

Gold Short: H&S and Wave 3 downOver here, I've labelled all the waves breakdown as well as drawing a tilted head-and-shoulders. I believe that we are going into a wave 3 (minute degree) that is supported by the formation of the right shoulder.
I expect the neckline to be broken which will then goes down to the first resistance provided by the lower blue trendline.
The next resistance in green will be our first TP target. This is where we can choose to reduce the position, or to adjust the stop loss down in order to ride the position. As the lower target cannot be seen without squeezing the chart and causing the waves breakdowns to be unclear, I will update again when that happens.
The stop loss is above the right shoulder.
Good luck!

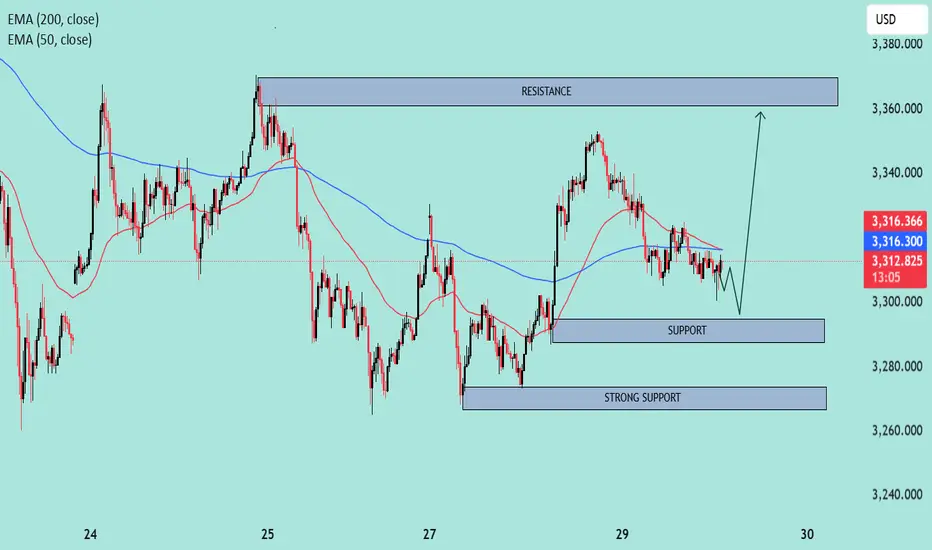
XAUUSD – Bullish Reversal Setup Near Support🟦 Chart Context:
Type: Intraday (likely 15m or 1h timeframe).
Indicators Used:
EMA 50 (Red): 3,316.497
EMA 200 (Blue): 3,316.332
Current Price: 3,312.650
🔍 Technical Analysis:
1. Trend & Moving Averages:
EMA Crossover (Bearish): The 50 EMA is slightly above the 200 EMA, but both are flat and converging, suggesting a neutral to slightly bearish short-term sentiment.
Price below both EMAs indicates bearish pressure in the immediate term.
2. Key Zones:
Resistance Zone: 3,355 – 3,370
Price was previously rejected from this zone, indicating strong supply and likely sell orders.
Support Zone: 3,295 – 3,305
Price has bounced here multiple times, suggesting active buyers.
Strong Support: 3,265 – 3,275
A broader and more historically respected area that could lead to a significant reversal if tested.
3. Price Action:
Currently forming lower highs and lower lows, which is a classic sign of short-term weakness.
A small descending triangle appears to be forming near the support level (bearish bias), but the drawn forecast suggests a potential fakeout breakdown followed by a bullish reversal.
4. Expected Scenario (as per chart projection):
Price might dip briefly into the 3,295–3,305 support, triggering liquidity grab (stop hunts).
A potential bullish rally towards the 3,355–3,370 resistance zone is expected.
This suggests a buy-the-dip strategy near support with tight risk management.
📈 Trade Outlook:
🟢 Bullish Bias:
If the support at 3,295–3,305 holds and price reclaims the 200 EMA convincingly.
Target: 3,355–3,370 resistance zone.
🔴 Bearish Bias:
If price breaks below the strong support (3,265), expect continuation lower.
Downside targets would then extend towards 3,240–3,250.
✅ Conclusion:
Current bias: Neutral to short-term bearish unless the lower support holds.
Key action zone: Watch price reaction around 3,295.
Strategy suggestion: Monitor for a bullish reversal signal at support; avoid chasing trades in the middle of the range.
OVERSOLD NKELooking for the closest gap fill and to retest the down slopping trend line. China or Vietnam tariff deal like most stocks this would easily move +10% instantly, current valuation is like buying in 1997! down 70% from the highs fair value $112.

Regis Resources Stock Quote | Chart & Forecast SummaryKey Indicators On Trade Set Up In General
1. Push Set Up
2. Range Set up
3. Break & Retest Set Up
Notes On Session
# Regis Resources Stock Quote
- Double Formation
* Start Of (Diagonal) At 1.600 AUD | Completed Survey
- Lower Band Consecutive (50 EMA)
* (Uptrend Argument)) On Continuation Area | Subdivision 1
- Triple Formation
* Wave Feature + Ongoing Entry At Wave (3)) | Subdivision 2
* (TP1) | Subdivision 3
* Daily Time Frame | Trend Settings Condition
- (Hypothesis On Entry Bias)) | Indexed To 100
- Position On A 1.5RR
* Stop Loss At 203.00 AUD
* Entry At 240.00 AUD
* Take Profit At 270.00 AUD
* (Uptrend Argument)) & No Pattern Confirmation
* Ongoing Entry & (Neutral Area))
Active Sessions On Relevant Range & Elemented Probabilities;
European-Session(Upwards) - East Coast-Session(Downwards) - Asian-Session(Ranging)
Conclusion | Trade Plan Execution & Risk Management On Demand;
Overall Consensus | Buy

Gold - Just Half Way To The Target!Gold ( TVC:GOLD ) still has a lot more upside potential:
Click chart above to see the detailed analysis👆🏻
Over the past couple of months, we saw an almost incredible breakout rally of about +75% on Gold. However, looking at technicals, there is a quite high chance that Gold will actually rally even more and retest the next upper resistance trendline, which would mean another pump of about +75%.
Levels to watch: $4.000
Keep your long term vision,
Philip (BasicTrading)

AUDJPY: H4, H1 Forecasts, Technical Analysis & Trading IdeaTechnical analysis is on the chart!
No description needed!
OANDA:AUDJPY
________________________________________________________________
❤️ If you find this helpful and want more FREE forecasts in TradingView,
. . . . . . . . Hit the 'BOOST' button 👍
. . . . . . . . . . . Drop some feedback in the comments below! (e.g., What did you find most useful? How can we improve?)
🙏 Your support is appreciated!
Now, it's your turn!
Be sure to leave a comment; let us know how you see this opportunity and forecast.
Have a successful week,
ForecastCity Support Team

$USO to $29-42 before a bottom is inAMEX:USO broke down from a long term that started in March 2020 and is now breaking down below support at $67.
The most likely outcome is a continuation down to the lower support levels at $29-33.
I won't rule out the possibility of one more retest of the trend line ($73-75) before continuing down further. An invalidation of the short would be a break over the $83 level.
Otherwise, downside is the most likely outcome from here.
Let's see how it plays out over the coming months.

Key intervals and trend judgmentKey range and trend judgment:
The current gold price is in a narrow range of 3300-3305 support zone and 3325-3330 pressure zone. Technical analysis:
1. Support logic:
- 3300 is an integer psychological barrier, which coincides with the MA60 moving average (dynamic support) of the 1-hour chart;
- After hitting the bottom of 3300 several times recently, it rebounded and formed a short-term bottom structure.
2. Pressure logic:
- 3330 is the upper rail resistance of the Bollinger band on the 4-hour chart, and it is the previous high-intensive trading area;
- The top divergence signal appears at the MACD daily level, suppressing the upward space.
3. Volume characteristics: Shrinking volume oscillation, need to wait for breakthrough and large volume to confirm the direction.
Trading strategy and operation plan
1. Buy low and sell high within the range (short-term)
Long position strategy:
Entry point: 3300-3305 range (price retracement does not break, and 1-hour chart RSI <30), try long with a light position. Take profit target: 3315 (first target), 3325 (second target) Stop loss 3292 (break through the previous low support).
Short position strategy:
Entry point: 3325-3330 range (price touches pressure and falls back, 15-minute chart MACD dead cross), try short with a light position, take profit target: 3310 (first target), 3300 (second target); Stop loss: 3338 (break through the previous high pressure).
2. Follow the trend after the breakthrough (trend following) Upward breakthrough (stabilizing 3330): Pursue long signal: the price breaks through 3330 with large volume and then falls back without breaking, the target is 3350-3360 (previous high of the daily line);
Stop loss: 3320 (below the breakthrough point).
Downward break (falling below 3300): Pursue short signal: the price falls below 3300 and the pullback confirmation is invalid, the target is 3280-3260 (weekly MA20 support); Stop loss: 3310 (above the break point).
Pattern interpretation:
- The 4-hour chart converges in a symmetrical triangle, and the theoretical target after the breakthrough is the height of the triangle ; If it breaks upward, the target is 3350; if it breaks downward, the target is 3270.
Volume coordination: When breaking through, the trading volume needs to be enlarged by more than 20%, otherwise be alert to false breakthroughs.
Gold is in the stage of oscillating and choosing direction in the short term, and the strategy is mainly to sell high and buy low within the range + follow the breakthrough.
