Gold double bottom 3262 formed, next week's ladder is bullish
Gold closed with an adjustment K-line on the weekly chart, and the downward rhythm slowed down at the end of Friday. Currently, gold stabilized at 3265, and formed an effective double bottom pattern with the decline and rebound on Wednesday. Can the market achieve an effective breakthrough based on the double bottom structure?
Trading at the beginning of the week continued the idea of oscillating bulls. Gold usually showed a strong upward trend during the Asian session, and the bullish momentum was mostly released before 10 o'clock. This week, gold continued to show a strong sideways or upward pattern before 10 o'clock. If there is no breakthrough during this period, it will turn into an oscillating downward rhythm before the European session. This rule is highly consistent with the recent gold decline cycle. The US market showed a regular trend of "opening weak, stabilizing and rising after 22 o'clock", and this fluctuation feature was verified from Wednesday to Friday.
Next week, focus on initial jobless claims, CPI and non-agricultural employment data. It is recommended to manage positions before the release of major data. The trading logic of the European and American markets continued at the beginning of the week. The reference support in the early trading session was 3300, and 3270/60 was used as the bottom of the range to arrange long orders. If it rises directly at the beginning of the week, the pressure level will focus on the 3380 line. The current long-term bullish pattern has not changed. The double bottom pattern formed on Friday provides support for the step-by-step rise. After an effective breakthrough, it can be expected to rise to the 3550 area.
Trend Lines

EURUSD InsightWelcome, dear subscribers!
Please feel free to share your personal opinions in the comments.
Also, don’t forget to like and subscribe!
Key Points
- According to CNN and Caixin, China has recently imposed an additional 125% tariff on eight types of U.S. semiconductors, excluding memory chips.
- President Trump, in an interview with Time magazine, stated that Chinese President Xi Jinping had called him, and he expects that all negotiation proposals will be announced within the next three to four weeks. He reaffirmed this expectation while leaving the White House to attend Pope Francis’ funeral.
- While skepticism remains in the market regarding whether actual U.S.-China trade negotiations are underway, there is a growing sentiment that the situation is unlikely to deteriorate further.
Key Economic Events This Week
+ April 29: U.S. March JOLTS Report (Department of Labor)
+ April 30: Germany Q1 GDP, Germany April CPI, U.S. April ADP Nonfarm Employment Change, U.S. March Core PCE Price Index
+ May 1: Bank of Japan Interest Rate Decision
+ May 2: Eurozone April CPI, U.S. April Nonfarm Payrolls, U.S. April Unemployment Rate
EURUSD Chart Analysis
After a sharp rally, EURUSD climbed close to the 1.16000 level but has since started to turn downward after encountering strong resistance. A short- to medium-term decline is expected, with a likely target near the 1.11000 level. However, once it reaches this bottom, a rebound and a return to an upward trend are anticipated.
If the market moves differently from the current outlook, I will promptly adjust the strategy accordingly.

Nasdaq vs SQQQSQQQ-solid
Nasdaq-hollow
Trend appears to be reversing, where SQQQ will begin trending positive, and Nasdaq negative.

Corn Futures This is my first time looking at Corn Futures. I am already loving what I see. This market trends well. Lots of opportunities to get in this market. We can see that we are in a bearish market. Respecting the 1 hour trend line that I place at the market high. It has been following it for some time now. Looking to see if we continue to push down some more this week.

Gold's second bottoming out shows a range, Layout direction!Gold fell back after reaching a high this week, and the highest reached 3500, which was under pressure. The weekly line finally closed with a Yin cross star. It is expected to be a wide sweep range next week, and the overall range will remain at 3370-3260. After breaking through, it will follow the trend. The daily line has bottomed out and rebounded, and the rebound strength is also strong. Finally, it closed with a long lower shadow Yin line. The repeated sweep of hundreds of points is still the main tone. There is no clear direction signal. The upper pressure is around 3348. If the rebound continues at the opening next week, pay attention to this position. If it breaks through, look at 3370-80. Pay attention to the support below 3288 and 3260. Treat it as a shock in operation, and try to participate in the band near the key position!
Operation suggestion: Gold is long near 3285-95, and look at 3325 and 3248! Shorting is possible if the upper 3248 pressure is not broken!

Ethereum Potential UpsidesHey Traders, in today's trading session we are monitoring ETHUSDT for a buying opportunity around 1780 zone, Ethereum is trading in an uptrend and currently is in a correction phase in which it is approaching the trend at 1780 support and resistance area.
Trade safe, Joe.

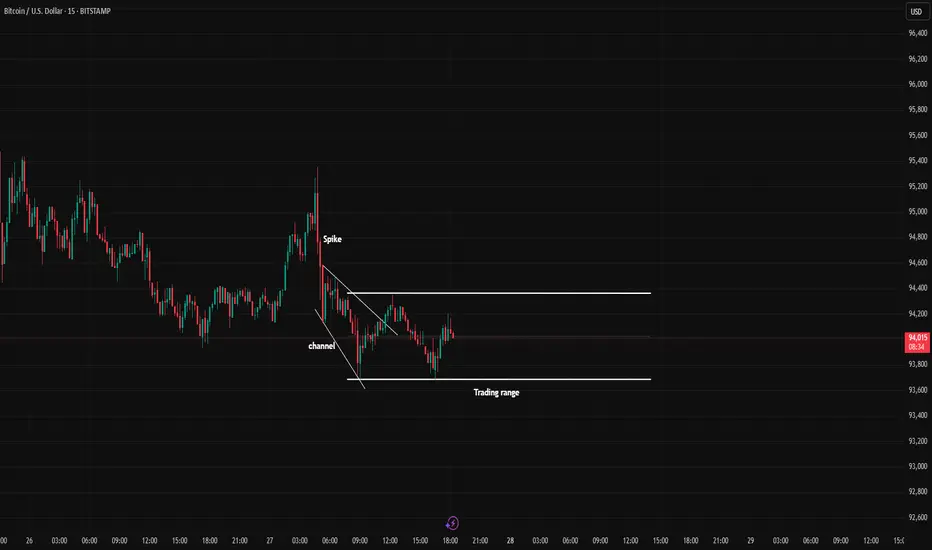
BTC cycleIn the 5-minute timeframe, you can sell at the top of the trading range and buy at the bottom of the trading range (by observing reversal candles and patterns).
Alternatively, you can wait for a breakout and enter in the direction of the breakout.
Be mindful of fake breakouts
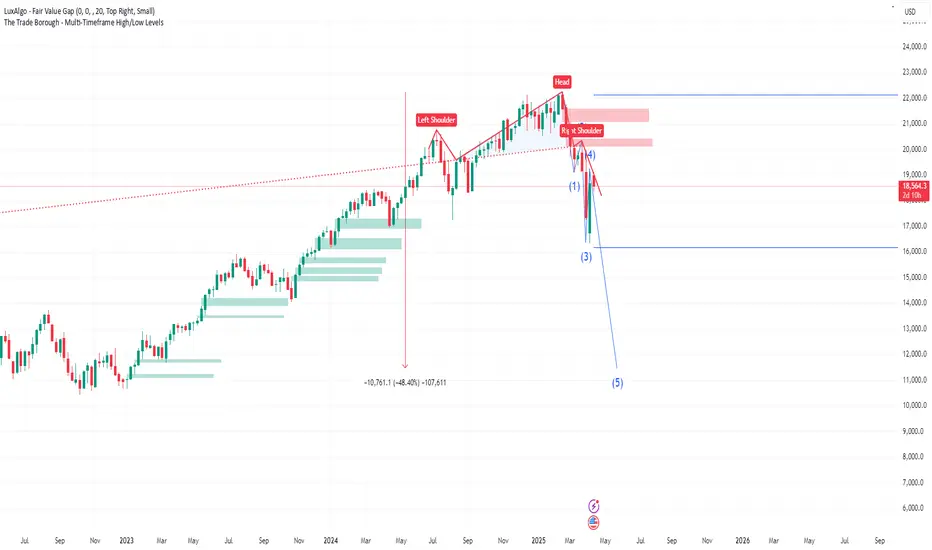
No shampoo in sight.....and an $11k Nasdaq?This posts presents an idea that has no precedence (that I can recall at least), so this is by definition a crazy idea BUT the chart is showing signs of extreme exhaustion and is possibly and quite frankly on the verge of a potentially destructive collapse.
If the recent severe volatility hasn't peaked your attention... this chart should.
It's quite simple...we have a MONSTER Head and Shoulders pattern on the Weekly TF...and we're finishing off the Right Shoulder! From a chart pattern perspective, this is ultra-ultra bearish.
The confluence we have is the Elliot Wave showing the we could be about to enter Wave 5. Elliot Waves are of course subjective BUT in this case its syncs with the Head and Shoulders.
If this was a 15min chart, most would probably agree hands down, but this is a Weekly Chart and represents Trillions on Trillions so its hard to believe that this could even be a possibility.....but I believe it could happen!
The horizontal blue lines provide 2024's High and Low Price. For this disaster scenario to be avoided, the Bulls and anyone who cares must defend 2024's low around 16100. This must not be breached, to keep the 12M bullish structure in place.
The green shaded areas highlight all of the Buy Side fair value gaps on the WEEKLY TF going back to early January 2023!
Could the market dive for these in devastating fashion? Only time will tell.
In the interim, we should trade safe and manage risk as best as we can.
PHDC Loading for a Massive Breakout – Hidden Bull Flag Inside!Palm Hills (PHDC) is gearing up for a powerful move! 📈
After months of respecting a clean ascending channel, price just bounced perfectly off lower support.
📊 Indicators flashing green:
StochRSI bullish cross ✅
MACD turning positive ✅
Squeeze Momentum showing early pressure build-up ✅
I’m buying between 6.70–6.85 EGP with a tight stop at 6.50 EGP.
🎯 Targets:
TP1: 7.50 EGP
TP2: 8.00–8.20 EGP
A clean breakout above 7.00 EGP could trigger explosive upside. Watch closely! 🚀
(DYOR – Not financial advice)

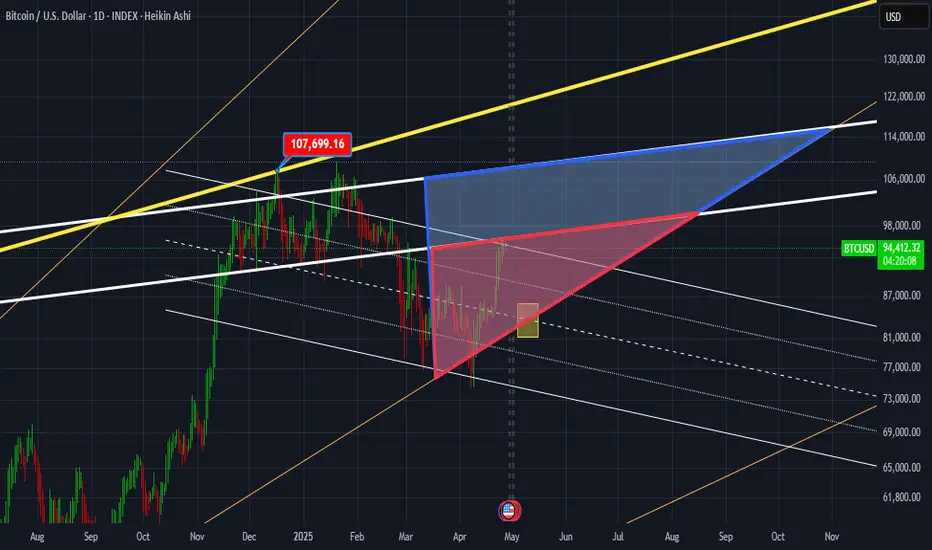
BTC in Bermuda triangle!I love shapes. Shapes have a rich and deep philosophy and give you an idea of what's going on in the mind of market's major players. BTC is no longer an infant, in fact, just like you, it's getting older and older everyday! "Now" the market movements are far beyond simple pump and dumps. No more slides in the park for baby bitcoin! Watch the small red triangle and the big blue one. The lovely yellow rectangle waves hands!
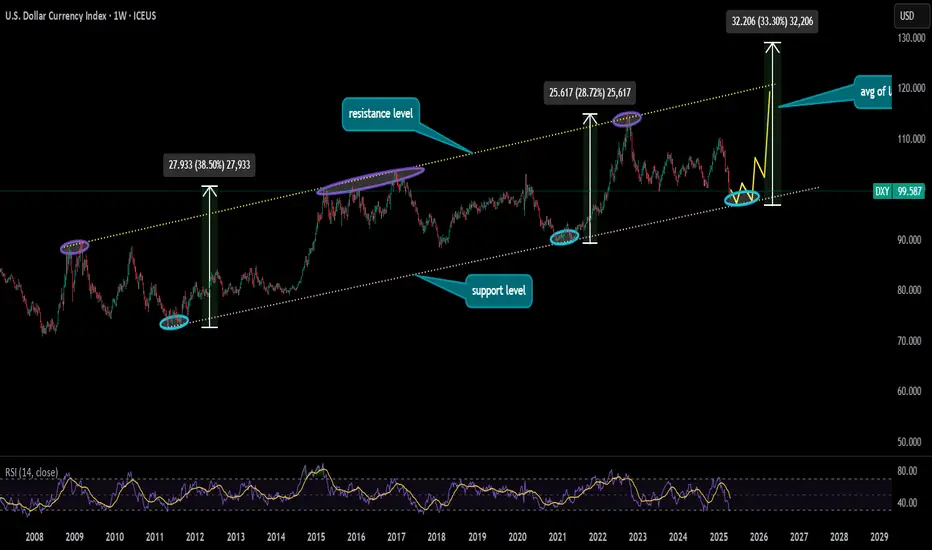
can DXY change its trend after marking 3rd HLCurrently, the price is a bit away from touching the lower trendline, which is acting as a support level as it will be its latest HL. After that, it would be interesting to know how the dollar moves because, as technical analysis on the chart suggests, DXY should move upwards to maintain that parallel channel. Tariff event, war situation and couple of other major events will also play significant role in determining the next possible movement of dollar
BTC Weekly Analysis – Potential Retracement & Next TargetsAnalysis & Thought Process:
Bitcoin is currently at a critical juncture on the weekly timeframe. Having observed recent bullish momentum, the price now faces resistance around the 95,900–96,700 range. If BTC manages to clearly reverse from this resistance area, it could propel upwards to test psychological resistance at the significant 100K level within the coming days.
However, careful analysis indicates the presence of a Fair Value Gap (FVG) between 89–90K. Such imbalances in price action typically attract price retracements to achieve market efficiency. Thus, I anticipate a correction back down to the 89–90K area, which would represent an ideal zone to consider a long swing position.
Trade Idea:
Short-term bearish scenario: Look to short from current resistance levels (around 95,900–96,700) targeting the 89–90K FVG area.
Long swing setup: If BTC retraces and holds the 89–90K region, it presents an attractive area for swing long entries aiming back towards and beyond current resistance areas.
PLAN NOT VALID IF
If the price fails to hold 89K, the next logical areas to watch for support are lower down at the 82–78K range, followed by a deeper pullback potentially extending towards 74K.
Profit Targets & Stop Losses:
Short trade: Entry around 95,900–96,700, profit target at 89–90K, stop loss set slightly above the resistance (e.g., 97.5K).
Long trade: Entry at 89–90K, profit targets initially back to 96–100K. Stop loss placed just below the 88K area.
This analysis is for informational purposes only and does not constitute financial advice. Please perform your own due analyse before entering any trades.

BITCOIN → Consolidation or reversal? Why is $ 95000 important?BINANCE:BTCUSD held up quite strongly during the tariff war and largely weathered the storm, while the stock market and indices were in free fall. The improvement in the fundamental situation has once again heightened interest in the asset among traders and investors.
Earlier, I pointed out that against the backdrop of falling markets (due to Trump's policies and tariff wars), Bitcoin is holding up fairly well. It cannot be compared to gold, which maintains its status as a safe haven, but overall it has stayed out of the 73K risk zone.
Countries are continuing negotiations in the US, which generally points to an improvement in the trade situation, but all attention remains on relations between China and the US, and a resolution may be close.
Technically, on the daily/weekly timeframe, the price has broken through the trend resistance and the asset has moved from the sell zone to the buy zone, which in general only increases interest in the flagship. Bitcoin is stuck in the 95K-92K range. A false breakout of resistance provokes a correction, and now we need to monitor the price and see where the correction will stop. This will show us important support that could become the basis for consolidation.
Resistance levels: 95K, 100K, 102.5K
Support levels: 93.5, 92.9, 92, 91K
To break through 95K and continue growing, Bitcoin must form consolidation. There is none at the moment, and a correction and halt may indicate the approximate boundaries of consolidation. However, the focus is on 95 - 93.5 - 92K. If the price manages to stay within the local boundaries and continues to storm the 95K resistance, we will have a chance for a breakthrough and continued growth to 100K. Otherwise, Bitcoin may form a deeper correction, for example to 91-88K
Best regards, R. Linda!


XRP / RIPPLE | 30M | IMPORTANT LEVELSFriends,
I valued your requests and prepared the following Ripple analysis: If Ripple drops below the level of 2.1807 for 30 minutes, the target will be the 2.1424 level. This level holds a very significant support zone.
The most critical support level is located at 2.1085.
If Ripple does not fall below this support zone, my target level for Ripple will be 2.2495.
Please don't forget to like.
Thank you to everyone who supports with likes.

EURUSD Bullish or Bearish Today?As you can see in my chart drawing, EURUSD is going through an uptrend channel. Now it's coming from the channel resistance, so it might be a pullback until the channel bottom.
On the other hand, the euro is gaining fundamental strength against the USD!
Therefore, the trend may persist until this week's NFP. This analysis is based on the current trend and fundamental situation of the market.
This information is not financial advice or any trade signal; it's just for educational purposes, so please do your own analysis before taking any entry on this asset.
Thank you

GOLD UPDATEHello friends✌
As you can see, after a sharp price drop, gold has entered a range that has formed a double top pattern that warns us of a continued price drop, so be careful🔊📈
*Trade safely with us*

FTSE MIB (IT40) Stock Quote | Chart & Forecast SummaryKey Indicators On Trade Set Up In General
1. Push Set Up
2. Range Set up
3. Break & Retest Set Up
Notes On Session
# FTSE MIB (IT40) Stock Quote
- Double Formation
* (A+ Set Up)) | Completed Survey
* Wave Feature + Long Entry Bias | Subdivision 1
- Triple Formation
* ((No Trade)) At 0.80% To Percentage Related Settings | Subdivision 2
* (TP1) | Subdivision 3
* Daily Time Frame | Trend Settings Condition
- (Hypothesis On Entry Bias)) | Indexed To 100
- Position On A 1.5RR
* Stop Loss At 129.00 EUR
* Entry At 135.00 EUR
* Take Profit At 145.00 EUR
* (Uptrend Argument)) & No Pattern Confirmation
* Ongoing Entry & (Neutral Area))
Active Sessions On Relevant Range & Elemented Probabilities;
European-Session(Upwards) - East Coast-Session(Downwards) - Asian-Session(Ranging)
Conclusion | Trade Plan Execution & Risk Management On Demand;
Overall Consensus | Buy

Bitcoin's next targets are 140K and 250K !This analysis is an update of the analysis you see in the "Related publications" section
Are Bitcoin's mid-term targets still valid?
First of all, please review the previous analysis
In our last analysis, we mentioned that if there was any drop, it would likely be towards the resistance line that had been broken, and we identified the pullback zone around the 77K channel.
Now, based on the available data, the pullback has been successful, and Bitcoin's target is to move toward the 130-140K range. A 3D pattern has formed, and the third drive could complete within this range, after which Bitcoin may enter a corrective phase.
But what about the second target | 250K?
Why are we considering this target? There are several reasons:
First, the bullish wave in gold was preventing capital from flowing into cryptocurrencies, especially Bitcoin. Now, gold is reaching the end of its bullish wave, which could lead to significant liquidity flowing into crypto and Bitcoin.
Second, Bitcoin's channel structure remains very bullish. If substantial liquidity enters the market, not only could the 250K target be achieved, but Bitcoin might even reach higher levels.

Bitcoin Soon again above 100K$(major supports are 90K & 87K)The market is now bullish as it was expected after breakout of red trendline and now we may have short-term correction to test new supports like 90K$ and 87K$ or without any correction:
more pump soon will pump price to extremely bullish zone above 100K$.
DISCLAIMER: ((trade based on your own decision))
<<press like👍 if you enjoy💚

DOGEUSDT is gonna pump hard this time wait for above 0.5$As we said before the red trendline is broke and market after 70% fall now is ready for another bull run here and we are looking for same targets like previous time for DOGEUSDT also if and only if 0.45$ break this time to the upside we can expect more rise to the targets like 0.75$ and more even.
DISCLAIMER: ((trade based on your own decision))
<<press like👍 if you enjoy💚

SHIBUSDT pump from major daily supports startedAs we mentioned a lot:
the gain started this time from our support and now it can easily continue to at least red trendline resistance which is first target.
DISCLAIMER: ((trade based on your own decision))
<<press like👍 if you enjoy💚

PEPEUSDT Another +100% cooking, soon above 0.000017$As we can see price now is near one of the major resistance zones and also red trendline is broken now we can expect some range here or not and soon after that heavy pump is ahead to the target mentioned on the chart with price label.
DISCLAIMER: ((trade based on your own decision))
<<press like👍 if you enjoy💚
