Oscillating downward! The bearish trend is beginning to emerge!【Gold Analysis】
Interpretation of news: The current market presents a "three-legged" pattern: First, the uncertainty of the trade war. If the US insists on imposing new tariffs, the gold price may hit the $3,500 mark again; second, the suspense of the Fed's policy. Whether the May meeting will release a signal of interest rate cuts will become a key turning point; finally, the trend of the US dollar. If subsequent economic data continues to deteriorate, the US dollar index may fall below the 99 integer mark. The current gold market is caught in a fierce game of long and short factors. In terms of the trade war, the situation is not as good as Trump's remarks. The Asian giant issued a solemn statement on Thursday, emphasizing that if the US is sincere about solving the problem, all unilateral tariffs should be immediately cancelled. This statement is in sharp contrast to the "negotiation signal" recently released by the White House, making the trade outlook more confusing.
The current market sentiment is cautiously optimistic. On the one hand, Finance Minister Bensont's statement that the trade confrontation may continue has triggered a rise in risk aversion; on the other hand, the expectation that the Fed may cut interest rates has provided fundamental support for gold. This complex psychology is the main reason why the price of gold fluctuates in the range of 3260-3500 US dollars. There is one last trading day this week. Let's see how this week ends.
From the daily chart of gold, after the exaggerated reversal in the middle of the week, the current price of gold has not only lost the important support of 3350, but also formed an obvious bearish evening star in terms of shape, which means that there may be further correction space in the future. In addition, at this stage, the short-term moving averages MA5 and MA10 have been broken one after another, so it is not ruled out that they will continue to move closer to MA20, but their position is still below 3200.
From the 4-hour chart of gold, although it once fell nearly 200 US dollars from the high, the price of gold gradually stood firm yesterday and began to fluctuate and rebound. It has now returned to above 3270. However, given that the moving average group is in a sticky state and the MACD indicator is adjusted to near the 0 axis, the short-term long and short competition may become more intense. Therefore, it is recommended to keep selling high and buying low as the main strategy, which is more stable. Pay attention to the resistance of 3370-3375 on the top and the support of 3285-3280 on the bottom;
Investment strategy: short gold at 3310-3320, target 3265.
Trend Lines

Gold's decline under pressure is in line with expectations! Gold market trend analysis:
Gold technical analysis: This week, gold prices fluctuated, opening at 3332. So far, the high is 3500 US dollars and the low is 3260 US dollars. On Monday, it soared by 100 US dollars. On Tuesday, it continued to rise to 3500 highs in the Asian session and then fell back. On Tuesday and Wednesday, it plummeted by nearly 240 US dollars. The volatility slowed down on Thursday. The overall intraday fluctuations remained within 3367-3288. Today, the weekly line closed. The weekly line will compete for the closing of the Yin-Yang cross K line. The short-term is more intense. From the consolidation on Thursday, there is no further decline, which also leaves room and suspense for today's weekly closing. If the weekly line closes lower, it is expected to adjust further next week. Pay attention to the closing strength and weakness of the weekly K line this week.
Today's opening trend of the gold market is like yesterday. The Asian session started the upward mode, rising all the way to around 3370 US dollars. However, it encountered strong resistance here, and then turned downward and started a decline. It is worth noting that today's gold price not only failed to break through this key resistance level, but also fell below the low hit in yesterday's European and American sessions, falling to a low of US$3,287 before rebounding.
In view of the important trend of gold price breaking the key point, the market will most likely continue the short-selling idea in the future. From the current market structure, the position of $3260 has become the focus of the market. Investors need to pay close attention to whether the gold price can reach or even fall below this point. Once it effectively falls below, the short-selling trend will be further strengthened, and the market may usher in a deeper adjustment.
From the hourly level, yesterday's low was at $3306, and the rebound just now showed an obvious stop signal at this position. Based on this, the current short-term suppression level can refer to $3315, and the upper level is $3328. For short-term investors, you can consider waiting for the gold price to rebound to around $3315 to arrange a short order and continue to be bearish on the gold price. The first thing to pay attention to below is the support of the low point just touched at $3287. If this support level is lost, the next key support level will be $3260, the first low point on the previous downward journey. If $3260 is also effectively broken, the short-selling force will be further released, and the gold price may face a larger decline. On the whole, today's short-term operation strategy for gold is to short on rebound and long on pullback. The upper short-term focus is on the 3315-3320 resistance line, and the lower short-term focus is on the 3285-3260 support line. Friends must keep up with the rhythm.
Gold operation strategy reference: short gold rebound near 3310-3320, target near 3290-3285, break to see 3260 line.
Gold pullback near 3270-3260 long, target near 3290-3310, break to see 3330 line.

Monday.com May Start MovingMonday.com has drifted for the last year, but some traders may think the business-software company is ready to start moving.
The first pattern on today’s chart is the bullish price gap on February 10 after earnings, revenue and guidance beat estimates. The shares touched their highest level since late 2021, only to decline with the broader market.
However, the slide wasn’t significant and MNDY stabilized at lows from January. The shallowness of the pullback may reflect a lack of selling pressure.
Second, the 50-, 100- and 200-day simple moving averages are virtually on top of each other. Does that long-term neutrality create potential for price expansion?
Next, MNDY has pushed above a falling trendline.
Finally, MACD is rising.
TradeStation has, for decades, advanced the trading industry, providing access to stocks, options and futures. If you're born to trade, we could be for you. See our Overview for more.
Past performance, whether actual or indicated by historical tests of strategies, is no guarantee of future performance or success. There is a possibility that you may sustain a loss equal to or greater than your entire investment regardless of which asset class you trade (equities, options or futures); therefore, you should not invest or risk money that you cannot afford to lose. Online trading is not suitable for all investors. View the document titled Characteristics and Risks of Standardized Options at www.TradeStation.com . Before trading any asset class, customers must read the relevant risk disclosure statements on www.TradeStation.com . System access and trade placement and execution may be delayed or fail due to market volatility and volume, quote delays, system and software errors, Internet traffic, outages and other factors.
Securities and futures trading is offered to self-directed customers by TradeStation Securities, Inc., a broker-dealer registered with the Securities and Exchange Commission and a futures commission merchant licensed with the Commodity Futures Trading Commission). TradeStation Securities is a member of the Financial Industry Regulatory Authority, the National Futures Association, and a number of exchanges.
TradeStation Securities, Inc. and TradeStation Technologies, Inc. are each wholly owned subsidiaries of TradeStation Group, Inc., both operating, and providing products and services, under the TradeStation brand and trademark. When applying for, or purchasing, accounts, subscriptions, products and services, it is important that you know which company you will be dealing with. Visit www.TradeStation.com for further important information explaining what this means.

Gold’s ATH Rally Slowing Down – Needs Correction!!!Gold ( OANDA:XAUUSD ) has been on a strong uptrend in recent weeks , creating a new All-Time High(ATH) almost every day. Will a new ATH be created after $3,500 in the coming days? What do you think?
Gold is moving between the Resistance zone($3,386-$3,357) and Support zone($3,282-$3,245) .
In terms of Elliott Wave theory , it seems that Gold has started to form Corrective Waves after recording the latest ATH . Gold is completing a Zigzag Correction wave (ABC/5-3-5) ( most likely ).
I expect Gold to start declining again after approaching the Resistance zone($3,386-$3,357) and attack the Support lines and Support zone($3,282-$3,245) . It seems like Gold needs a correction , do you agree with me!? In the worst-case scenario for my analysis, Gold starts falling from the resistance zone($3,431-$3,406) .
Note: If Gold can move above $3,440, we can expect more pumps and maybe make na ew All-Time High(ATH).
Gold Analyze ( XAUUSD ), 1-hour time frame.
Be sure to follow the updated ideas.
Do not forget to put a Stop loss for your positions (For every position you want to open).
Please follow your strategy; this is just my idea, and I will gladly see your ideas in this post.
Please do not forget the ✅' like '✅ button 🙏😊 & Share it with your friends; thanks, and Trade safe.

Golden times!Gold is not done yet, imo. 5k is in play. Hard assets like Gold and Bitcoin are becoming a safe haven.

TOTALThings are changing. TOTAL bounced off its monthly uptrend line. We could see a major shift from here.

Atcoin Season?Possible falling wedges on the OTHERS.D chart. Are we about to move back into the channel?

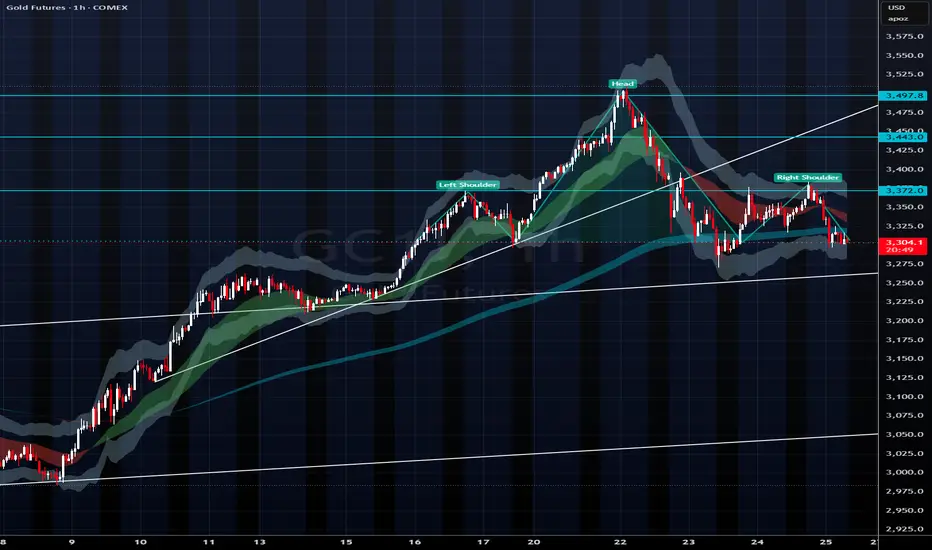
Watch to Watch - Gold Bearish Head and ShouldersWith the recent strength in US equities, the long gold trade may be over. Gold broke below a key trendline and formed a distinct bearish head and shoulder pattern signifying possible downside pressure coming up today and into the next week. Definitely worth watching for futures traders. First target with a break lower would be around $3240 with a lot of downside from there.
GBP/NZD Testing Channel Support Within UptrendIn the displayed daily chart of GBP/NZD, the price is forming a well-structured and clearly defined ascending channel. This channel is bounded by two thick lines, an upper resistance line and a lower support line, both of which have been tested multiple times by price movements. At the upper boundary, there have been three valid touches, each resulting in a significant downward reaction. Meanwhile, at the lower boundary, there have also been three strong touches, confirming the channel’s validity as the main path of the ongoing uptrend.
In addition to the major channel, there is also a minor internal channel, indicated by dashed lines, showing price movement within a phase of consolidation or minor retracement inside the larger trend. The minor support line is currently being tested, signaling a critical area to determine the next directional move.
At the moment, the price is hovering near the minor support and presents two possible scenarios moving forward.
In the first scenario, the price could bounce from this minor support, continue strengthening toward the minor resistance, and potentially extend further toward the major resistance area around 2.36–2.38.
In the second scenario, if selling pressure persists, the price may break below the minor support and continue falling toward the major support of the larger channel, located around 2.17–2.18, before eventually bouncing back upward.
Overall, this price structure indicates that the primary trend remains bullish as long as the major support within the channel holds. However, in the short term, the market is in a consolidation phase with the risk of a deeper retracement. A confirmed bounce from support or a breakdown through the minor support will be key in determining the next move. The suggested approach is to wait for clear confirmation from price action before making any trading decisions.


Falling into range oscillation, just get the rhythm pointAnalysis of gold market trend
On Thursday, the gold price remained in the 4H channel, and the middle and lower tracks were in the range of 3370-3260, with overall resistance to decline and correction; this trend is also normal;
1: In the early stage, the market fluctuated rapidly with a hundred points rise and fall, and the kinetic energy consumption was large, so the short-term trend returned to the consolidation trend later;
2: The fundamentals stopped, the technical demand was corrected, and the two resonated, and the gold price could only fluctuate and consolidate in the range; the analysis framework given yesterday was treated according to two intervals; they were 3370-3260 and 3370-3480; the strong and weak dividing point was 3370 above and below;
We can also see that at the position of 3370, the gold price has been under pressure for 2 consecutive times and fell for 2 consecutive times; it can be seen that the strong and weak dividing point of the position above and below 3370!
At present, the market:
1: Trend: There is no trend for the time being, and the range is high, the large range is 3480-3260; the bull trend is stagnant, and the bear trend stops falling. The trend cannot be judged for the time being;
2: Fundamentals, the future fundamentals will focus on the US debt crisis, trade war tariffs, and subsequent war issues, two core things; and uncertain fundamentals
Today's market:
1: 4 hours, the stochastic indicator golden cross, the main long signal; in terms of form, slow bull rise; the current pressure position of the central axis is near 3370, and the probability of breaking upward is relatively high; therefore, the 4-hour can be treated as a shock rise; but the overall situation remains in the large range of 3480-3260!
2: In the daily K-line, the stochastic indicator diverges periodically, and the death cross is downward, which is a bearish signal; however, the high-level sell-off forms a sideways resistance to the decline, and the sideways support is in the range of 3280-3260; the MACD double-line golden cross is glued, and there is no death cross; the indicators in the daily K-line are contradictory, so the long and short trends are difficult to continue, and more range oscillations and high-level consolidation signals are given;
To sum up: Today's short message is still processed according to the 4-hour range; 3370-3260 range and 3370-3480 range; if it stabilizes at 3370, the range processing will be changed; you can take a pullback to do more, and bet on the 4-hour range oscillation upward, and gradually break through the position of 3370;

EURUSD → Accumulation of liquidity before continued growthFX:EURUSD currency pair is forming a trading range within a global and local uptrend. Before continuing its growth, the market may form a false breakout.
Against the backdrop of the falling dollar, the euro is strengthening and has gained 13% over the past four months, which is a fairly significant growth indicator for the currency pair. Fundamentally, the US is trying to achieve a rapid reduction in interest rates, which may continue to support the euro...
Technically, the price is consolidating against the backdrop of a global and local uptrend. A correction is forming towards the support zone, where there is a fairly large pool of liquidity...
Resistance levels: 1.1392, 1.1439, 1.1481
Support levels: 1.130, 1.127
The price is heading towards support, namely, the market is interested in liquidity below 1.13 - 1.127, which must be tested in order to build up potential before the bullish trend possibly continues.
Best regards, R. Linda!

DXY TrendlinesUnless it brakes the downtrend with a weekly candle close it should bounce back up in long run. should be closely monitored since it will give us a lot of information about current market direction. i expect bouncing back up but we will see.

SUI Long in WIDEA for SUI in Weekly time frame:
-Analysis used: Elliot waves + Fibonacci + Ascending Channel
-Long in wave 2 retracement for a 2-3 month projection

$BLENDR - Heating UpVolume is ticking up and price action is pivoting. Classic signs of early accumulation.

$AGENT - Heating UpVolume is ticking up and price action is pivoting. Classic signs of early accumulation.

$UFO - Heating UpVolume is ticking up and price action is pivoting. Classic signs of early accumulation.

$BLUB - Heating UpVolume is ticking up and price action is pivoting. Classic signs of early accumulation.

$JUNO - Heating upVolume is ticking up and price action is pivoting. Classic signs of early accumulation.

$AIT - Heating Up Volume is ticking up and price action is pivoting. Classic signs of early accumulation.

$ENQAI - Heating Up Volume is ticking up and price action is pivoting. Classic signs of early accumulation.

$ZERO - Heating UpVolume is ticking up and price action is pivoting. Classic signs of early accumulation.

$VIA - Heating Up Volume is ticking up and price action is pivoting. Classic signs of early accumulation.
