GBPUSD InsightHello to all our subscribers.
Please share your personal opinions in the comments. Don’t forget to like and subscribe!
Key Points
- President Trump continues to state that negotiations with China are going well, but the Chinese side has expressed that “the U.S. and China have neither consulted nor negotiated on tariff issues, let alone reached any agreement.”
- Peace talks between Russia and Ukraine are facing difficulties, and President Trump told reporters that he is strongly pressuring Russia to enter into peace negotiations with Ukraine.
- Federal Reserve Governor Christopher Waller said, “If the labor market begins to deteriorate significantly, we expect more rate cuts to occur sooner.”
Key Economic Events This Week
+ April 25: Australian stock market closed
GBPUSD Chart Analysis
The pair had been in an uptrend and recently reached resistance at the previous high of 1.34000 but failed to break through and is now declining. This downtrend is expected to continue in the short term toward the 1.31500 level, where a new directional move is likely to be determined.
Trend Lines

$USDT.D Cycle Top ProjectionI could see CRYPTOCAP:USDT.D playing out like this.
This November data also coincides with my BTC Cycle Thesis in November.
Lotsa other macro factors and indicators at play for a cycle top, but this lines up nicely and where I'll be taking a heavy chunk of profits.

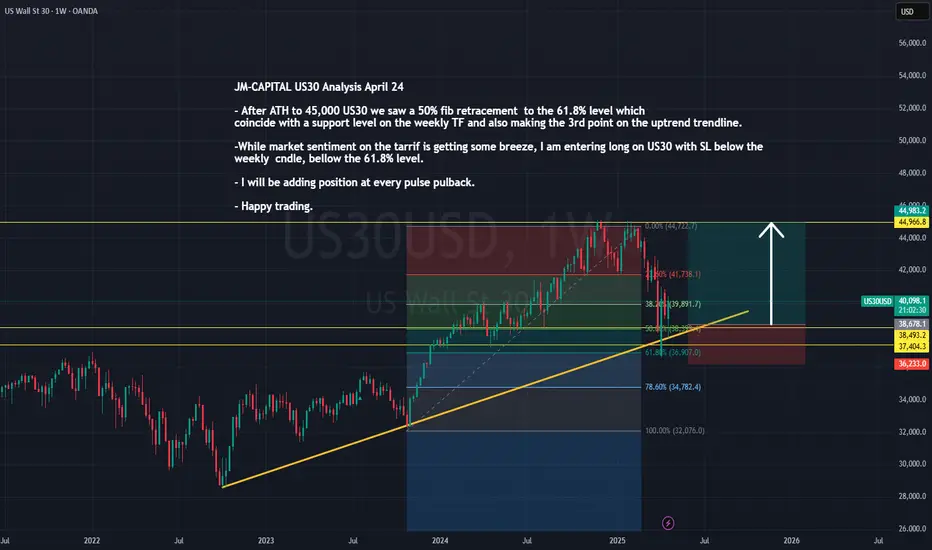
JM-CAPITAL US30 Analysis April 24After reaching an all-time high of 45,000, US30 experienced a pullback, retracing to the 61.8% Fibonacci level—aligning perfectly with a key support zone on the weekly timeframe and forming the third touchpoint on the ascending trendline.
With market sentiment beginning to ease around the tariff discussions, I’m taking a long position on US30. My stop loss is set just below the weekly candle and beneath the 61.8% Fibonacci level for added protection.
I plan to scale into the trade by adding positions on each corrective pullback in line with the bullish structure.
Wishing you all a profitable trading session. Stay sharp!
XAUUSD Price Outlook – Bearish Setup in Play ??Asset Overview
The chart represents a price action analysis with support and resistance zones, along with EMA indicators (50 and 200), likely on a 4H or 1H timeframe.
Key Technical Levels
Resistance Zone: ~3,400 to 3,450
First Support Zone: ~3,230 to 3,250
Second Support Zone: ~3,090 to 3,130
Indicators
EMA 50 (Red): Currently around 3,340, acting as dynamic resistance.
EMA 200 (Blue): Positioned near 3,232, reinforcing the first support zone.
Price Action Insight
Price had a strong uptrend, peaking above 3,440 before pulling back.
A lower high may be forming, suggesting possible trend exhaustion.
The current bounce appears to be a retracement back toward resistance or EMA 50.
Projected Move (As Illustrated on Chart)
Short-term bullish move into the resistance zone (~3,400–3,450).
Failure to break above resistance leads to sharp rejection.
Price retraces to first support zone (aligned with EMA 200).
If support fails, deeper drop expected toward the lower support zone (~3,100).
Strategic Notes
📉 Bearish Bias if price fails to break above resistance.
🔍 Watch for bearish candlestick patterns or divergences near resistance.
🛡️ First support aligns with EMA 200, making it a critical level for bulls to defend.
🔻 Breakdown below 3,230 opens room for larger correction to 3,100–3,090.
Conclusion
Currently, the chart suggests a potential short opportunity if price confirms rejection at resistance. The EMA cross structure remains bullish long-term, but momentum is weakening, and failure to reclaim highs could shift sentiment bearish in the short to mid-term.

"XAU/USD at Crucial Support Zone"📈 Chart Overview
Instrument: Likely XAU/USD (Gold vs USD)
Date: April 22, 2025
Timeframe: Appears to be a short-term chart (possibly 1H or 4H)
🧠 Key Technical Elements
1. Exponential Moving Averages (EMAs)
50 EMA (Red): Currently at 3,406.818 — acting as short-term dynamic support/resistance.
200 EMA (Blue): Currently at 3,277.286 — indicating long-term trend direction.
The price is well above the 200 EMA, indicating a bullish long-term trend. However, it’s now testing the 50 EMA, suggesting a potential short-term inflection point.
2. Support and Resistance Zones
Immediate Resistance Zone: Around 3,430 – 3,440, which price recently rejected.
Key Support Zone: Around 3,385 – 3,390 (labeled “FOCUS ON THIS POINT”), which aligns closely with the 50 EMA.
Lower Support Zones:
3,310 – 3,320
3,240 – 3,260
🔍 Technical Scenarios Outlined on Chart
✅ Bullish Scenario (Upper Arrow Path)
If the price holds above the 3,385 support zone, especially with support from the 50 EMA:
We may see a bounce back to test and potentially break above the 3,430 resistance.
This would confirm a continuation of the uptrend.
⚠️ Bearish Scenario (Lower Arrow Path)
If the price fails to hold above 3,385:
A breakdown may lead to a drop toward 3,320, with possible continuation toward 3,240.
This would indicate a short-term bearish correction within a longer bullish trend.
🔑 Critical Price Level
Focus on the 3,385 zone — This is a confluence area where:
Horizontal support meets
50 EMA is located
A potential decision point for bulls vs. bears
🧭 Trading Strategy Considerations
For Bulls:
Look for bullish candlestick formations or volume confirmation near the 3,385 level.
Target a retest of the 3,430+ area with stops below 3,375.
For Bears:
Watch for strong bearish breakdown below 3,385.
First target: 3,320, second: 3,240, with stop-loss above 3,400.
📌 Conclusion
The chart illustrates a key inflection point. Price is at a decision zone — hold and bounce = continuation of bullish momentum, break = short-term correction. All eyes on how price reacts at the 50 EMA and support zone near 3,385.

BTC Approaches Breakout Zone in Ascending Triangle – Key Resist,📈 Chart Overview
Instrument: BTC/USD
Timeframe: Likely 4H or Daily
Indicators Used:
EMA 50 (Red) – 84,924.30
EMA 200 (Blue) – 85,558.47
🔍 Key Technical Observations
1. Ascending Triangle Formation
The chart shows a clear ascending triangle, a bullish continuation pattern.
Flat resistance zone: Around $88,700–$89,000.
Higher lows forming a solid upward sloping trendline, suggesting increasing buying pressure.
2. Price Above Key EMAs
Current price: $88,779.43, which is above both the 50 EMA and 200 EMA.
This indicates bullish momentum as price breaks above dynamic resistance levels.
3. Volume Consideration (Missing)
While volume is not visible on the chart, an ideal breakout from an ascending triangle should be accompanied by increasing volume to confirm validity.
🔄 Possible Scenarios
✅ Bullish Breakout
A confirmed breakout above $89,000 with strong volume can lead to a measured move toward:
Target = Triangle height ≈ $13,000 → Potential target: $101,500 – $102,000
Next resistance levels to watch: $92,000, $95,000, and $100,000 psychological zone.
❌ Fakeout or Rejection
If BTC gets rejected at resistance, watch for:
Retest of support trendline (~$86,000).
EMA 50 and 200 as dynamic support around $84,900–$85,500.
Breakdown below the trendline may signal a short-term correction to $80,000–$82,500.
📊 Conclusion
BTC is at a crucial decision point. The ascending triangle suggests bullish potential, but a breakout confirmation is essential. Price is above both major EMAs, signaling strength, but a rejection from resistance could invite short-term bears.

Bearish Reversal in Play! | Key EMA Rejection & Support Targets🔍 Chart Analysis Summary
🕐 Timeframe: Likely a short-term (H1 or H4) chart.
📈 Asset: Most probably XAU/USD (Gold) or a similar asset.
🔴 Trend Breakdown
📍 Previous Trend:
✅ Strong bullish momentum 📈 pushing price into a resistance zone.
📍 Current Price Action:
🚨 Bearish rejection from resistance 🟥
Price got rejected exactly at the resistance zone (gray box) and the EMA 50 line 🔴 — a classic setup for a reversal ⚠️
📉 Key Technical Levels
🟦 Resistance Zone:
🔹 Between 3,385 – 3,400 USD
🧱 This zone rejected price strongly (see red candles)
📌 Also aligned with EMA 50 (3,400.837) — confluence adds strength 💪
🟩 Support Zones:
First Support Zone – ~3,285 📉
💙 In line with the EMA 200 (3,285.687)
🛡️ Might cause a temporary bounce 📈
Second Support Zone – ~3,240
📉 Marked as the deeper support in the bear case 🕳️
💥 If the first support breaks, this becomes the next target 🎯
📊 Indicator Insights
EMA 50 (🔴 Red): 3,400.837 – acting as dynamic resistance 😤
EMA 200 (🔵 Blue): 3,285.687 – acting as dynamic support 🛡️
📉 Price breaking below EMA 50 = first bearish sign
📉 Approaching EMA 200 = watch for either a bounce 🏀 or a breakdown 💥
🎯 Bearish Setup Forecast
📉 Here's what the arrows show (strategy logic):
📉 Breakdown below resistance → strong bearish move
🎯 Target 1: First support (EMA 200 / ~3,285)
🔄 Minor pullback possible (fake bounce 🪃)
💣 Continuation lower toward next support (~3,240)
📌 Critical Zone to Watch 🔍
⚫️ The circle marked “FOCUS ON THIS POINT” is key:
📌 Failed retest = confirmation of resistance
📌 Price rejected this level + closed below = strong bearish signal 🚨
🧠 Professional Insights
Element Observation Emoji
Trend Shift Bullish ➡️ Bearish reversal 🔄📉
Momentum Bearish pressure increasing 💨🟥
Risk Point Resistance near EMA 50 ⚠️🧱
Trade Idea Short toward supports 📉🎯
Confirmation Rejection candle after retest 🕯️🔁
Focus Level EMA confluence near resistance 🎯📌
🛠️ Possible Trade Plan (for educational purposes only)
Short Entry: Below 3,385 (after rejection 🔻)
Stop-Loss: Above 3,405 (above EMA 50 🛑)
Target 1: 3,285 🧲
Target 2: 3,240 📉

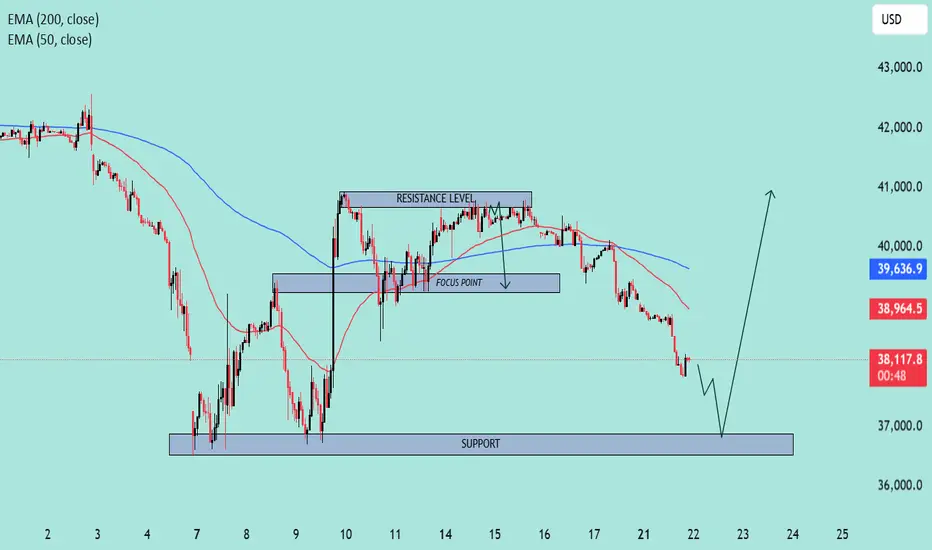
US30 Approaching Key Support Zone – Potential Reversal Ahead?📊 Chart Overview:
Timeframe: Looks like an intraday (maybe 1H or 2H).
Indicators:
EMA 50 (Red): 38,964.7
EMA 200 (Blue): 39,637.0
🔍 Key Levels & Structure:
🔵 Support Zone (Highlighted):
Around 36,800 – 37,200 range.
This is a well-tested support level where price previously bounced.
Current price action is approaching this zone again, which increases the chance of a potential bullish reaction.
🟣 Resistance Level:
Defined around 40,500 area.
Price has rejected multiple times from this zone.
Previously served as a consolidation/decision area.
📍 Focus Point (Previous Support Turned Resistance):
Near 38,700 – 39,000.
This level may act as a reaction point on the way back up.
📉 Current Price Action:
Strong downward momentum heading into the support zone.
Price is under both EMAs, suggesting short-term bearish trend.
However, the drawn arrow suggests a potential reversal bounce from the support.
🧠 Interpretation & Scenario Plan:
🅰️ Bullish Scenario:
Price touches or sweeps the support zone.
Bullish structure or reversal candle forms (e.g., hammer, bullish engulfing).
Break back above EMA 50 & Focus Point could confirm the shift.
Target: Revisit Resistance Zone (above 40,000).
🅱️ Bearish Scenario:
Support fails to hold.
Clean break below 36,800 with volume could lead to accelerated sell-off.
Watch for breakdown retests of support turned resistance.
🔔 Takeaway:
⚠️ Current move is bearish, but price is approaching a key demand zone. Bulls might step in if the zone holds. Confirmation is key before going long. Reclaiming EMAs would strengthen bullish bias.

AMD to Retest SupportAMD has been in a descending price channel since November of 2024 with clear support and resistance established. On Monday we saw an attempt to breakout however it was rejected at the establish resistance line. Given the rejection and the significant drop that followed I think we will likely see AMD drop to slightly below $80 in the short term and retest the established support line.

Analysis of Nasdaq 100 (US100) based on Price ActionThis analysis examines the recent price action of the Nasdaq 100 (US100) and identifies potential scenarios based on key technical levels.
Current Situation:
The price has recently moved above a short-term downtrend line, which could indicate a shift in momentum. This development suggests a possibility of upward movement.
Potential Bullish Scenario:
A decisive break and sustained close above the recent resistance level of 19,224 may open the door for further gains. In such a scenario, the index might target the 20,329 level. A successful move beyond that could potentially lead to a test of the historical peak at 22,245.
Potential Bearish Scenario:
Conversely, if the index fails to overcome the 19,224 resistance, there is a chance it could retest previous support levels. These levels are identified at 17,592 and, subsequently, at 16,322.
Conclusion:
The US100 is currently at a critical juncture. The ability of the price to sustain a move above 19,224 may determine its short-to-medium-term trajectory. Both bullish and bearish scenarios remain possible, and traders should monitor price action closely around these key levels.

GOLD → False breakdown and change of mood...FX:XAUUSD is strengthening after a false breakdown of support at 3288, with the change in fundamental sentiment due to US statements on the tariff war also providing support for the price.
On Thursday, gold rose from a weekly low of $3,260, supported by a weaker dollar and renewed concerns about US trade negotiations with China and Japan.
Optimism about tariff cuts quickly faded after denials from the White House. Weak US business activity data is fueling talk of a possible Fed policy easing, which is also supporting gold. The markets remain focused on trade news and Trump's statements.
Technically, gold could reach the liquidity cluster at 3314 and continue to rise towards strong resistance at 3370.
Resistance levels: 3342, 3370, 3387
Support levels: 3314, 3288, 3270
Below 3314 and below 3288, a liquidity pool has formed, which the market is likely to test before continuing its growth. It is too early to talk about a resumption of a strong rally, as the situation between the US and China is complicated, as are the negotiations on the situation in Eastern Europe, which seem to be moving towards talks, but every time something goes wrong...
Best regards, R. Linda!

ETH - New ATH Approaching?Bitcoin has been full of surprises over the past few days, and this will most definitely affect Ethereum as well - which has not made a previous ATH when BTC did , a point we should not be forgetting.
This would also bring about the beginning of a new ALTSEASON.
But before we get too excited about all of the above - let's first see if Bitcoin can continue to CLOSE daily candles above the key support zone, as pointed out in the video.
_______________
BINANCE:ETHUSDT
BINANCE:BTCUSDT

Acadia Healthcare Company | ACHC | Long at $21.98Acadia Healthcare's NASDAQ:ACHC stock has fallen nearly -76% in a year, primarily due to weak 2024 results, missed revenue and EPS expectations, and a soft 2025 revenue guidance. Ongoing federal investigations into billing practices and lawsuits have further eroded investor confidence. However, it is currently trading at a price-to-earnings ratio of 7.42x and earnings are forecast to grow 7.07% per year. The profitable company is trading at a good value compared to other healthcare companies. Debt-to-equity is relatively low (0.64x), but legal risks (DOJ probe, lawsuits) strain margins.
The stock has entered my "major crash" simple moving average territory and there is a lot of downward / selling pressure. But, more often than not, this area (which... I caution... still extends down near $16) can often signal a temporary or longer-term bottom. Personally, this is a buy area ($16-$21) even if it turns into a short-term bounce in 2025. But I believe the overall market moves in the S&P 500, etc. will guide this stock more than anything at this point (unless more bad news about the company emerges).
One thing to note is that there are open price gaps on the daily chart near $17, $10, and $8. These gaps, which often (but not always) get closed in the lifetime of a stock, are a potential signal for further declines - at least at some point. There could be a drop near $16, then a $10-$20 bullish price increase after that, followed by more declines (trapping investors). Time will tell, but NASDAQ:ACHC is currently attractively valued. From a technical analysis standpoint, it is in a personal "buy zone", even if purely for a swing trade.
Targets:
$27.00
$33.00
$39.00

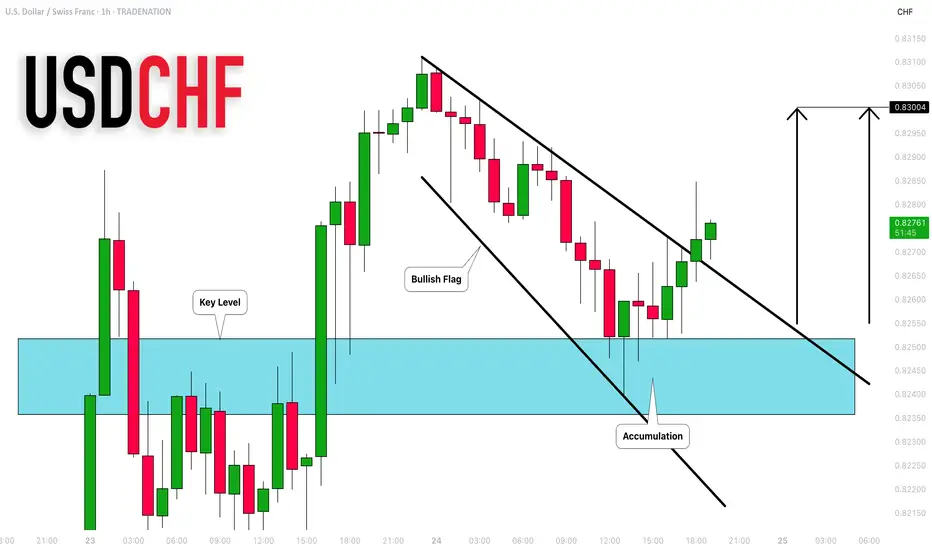
USDCHF: Very Bullish Price Action 🇺🇸🇨🇭
There is a high chance that USDCHF will go up from
the underlined blue support.
As a confirmation, I see a bullish breakout of a resistance line
of a bullish flag pattern on an hourly time frame.
Target - 0.83
❤️Please, support my work with like, thank you!❤️
I am part of Trade Nation's Influencer program and receive a monthly fee for using their TradingView charts in my analysis.

Livestock Price Volatility: Trading Cattle and Hog FuturesThe US livestock market is experiencing significant price volatility in 2025, as outlined in the USDA’s April 2025 World Agricultural Supply and Demand Estimates (WASDE) report. Cattle prices are projected to rise to $206 per cwt, driven by robust demand, while hog prices are lowered to $61 per cwt due to weaker export demand amid tariffs and global competition. These divergent price trends, coupled with production shifts—such as reduced pork output—create a dynamic trading environment for livestock futures. This article analyzes the market with updated price action for cattle futures.
Livestock Market Dynamics: Diverging Price Trends
Cattle prices are raised to an annual average of $206 per cwt, up from the prior estimate of $200, reflecting strong domestic demand and reported data through Q1 2025. This bullish outlook for cattle is supported by higher beef production forecasts, now at 26.767 billion pounds (up from 26.752 billion), driven by heavier dressed weights and increased cow and bull slaughter, though steer and heifer slaughter is lower. Beef exports, however, are reduced to 2.685 billion pounds (down from 2.820 billion) due to tariffs and non-tariff barriers in China, while imports are also down to 4.860 billion pounds, reflecting higher tariffs on foreign suppliers.
In contrast, hog prices are lowered to $61 per cwt, down from $63, as weaker export demand overshadows a slight increase in Q1 prices. Pork production is reduced to 28.090 billion pounds (down from 28.440 billion), reflecting lower slaughter and weights, with the March 27 Quarterly Hogs and Pigs report indicating smaller pig crops in 2024 and reduced farrowings through much of 2025. Pork exports are also down to 6.955 billion pounds (from 7.220 billion), impacted by increased tariffs on US shipments to China and price competition from other exporters, such as Brazil and the EU.
These divergent price movements—cattle prices up 3% to $206 per cwt and hog prices down 3% to $61 per cwt—create a unique opportunity for traders to exploit the volatility in livestock futures, particularly through mean-reversion or trend-following strategies.
Market Context: Supply and Demand Shifts
The broader livestock market context adds complexity to the trading landscape. Total red meat and poultry production is lowered to 108.154 billion pounds (down from 108.467 billion), reflecting declines in pork and turkey output, though broiler production is raised to 47.775 billion pounds (up from 47.700 billion) due to improved returns in the second half of 2025. Beef ending stocks are slightly down to 580 million pounds (from 585 million), while pork ending stocks remain steady at 425 million pounds, indicating a balanced but constrained supply picture.
Global trade dynamics, particularly the US-China trade war, are a key driver of export challenges. The WASDE report notes that pork exports to China face increased tariffs, reducing shipments, while beef exports are similarly impacted by non-tariff barriers. This export weakness, combined with domestic production adjustments, suggests that price volatility in livestock futures will persist, offering opportunities for traders to capitalize on short-term price swings.
Trading Signals and Strategies
The livestock market’s price divergence provides clear trading signals for futures traders. Cattle futures CME:LE1! are showing a shift in momentum with updated price action, while hog futures CME:HE1! face bearish pressure at $61 per cwt. As of April 24, LE futures are trading at $207.725 per cwt, slightly down from a recent high of $207.945, and HE futures are at $60.50 per cwt, setting the stage for distinct trading strategies.
The outlook for cattle remains bullish in the longer term, with prices projected at $206 per cwt and strong domestic demand, but short-term price action suggests caution. LE futures have encountered resistance near $207.945 and are now testing $207.725, with a bearish MACD crossover (MACD at 1.821, signal at 1.823) indicating downward momentum. A break below $207 could signal a move to the next support at $206, offering a 1% downside in the short term.
For a reversal play, if LE futures hold above $206 and reclaim $207.945 with strong volume and a MACD crossover above the signal line, prices could target the next resistance at $209, a 1% gain. This setup would require a shift in momentum, potentially driven by renewed domestic demand or easing export barriers.
For hog futures, the bearish outlook with prices at $61 per cwt and exports down to 6.955 billion pounds suggests a shorting opportunity. HE futures are testing support at $60, with the 50-day moving average at $62 acting as resistance. A break below $60, confirmed by a bearish MACD crossover and an RSI drop below 40, could signal a move to $58, a 3-4% downside. The WASDE’s reliability data shows a 2.1% root mean square error for pork production forecasts, indicating potential volatility if future reports adjust output estimates significantly.
Alternatively, traders can exploit the price divergence between cattle and hogs through a mean-reversion strategy. The spread between LE and HE futures—currently around $147.225 per cwt ($207.725 minus $60.50)—is near a 52-week high, suggesting potential for convergence if hog prices stabilize or cattle prices cool. Traders can short LE futures and go long on HE futures, targeting a spread contraction to $146, while monitoring export data and production updates for shifts in sentiment.
Risks to Watch
Trading livestock futures involves risks, particularly given the export-driven volatility. The US-China trade war, with tariffs reducing pork exports to 6.955 billion pounds and beef exports to 2.685 billion pounds, could further dampen demand if global economic growth slows. The WASDE’s historical data indicates a 90% confidence interval of ±3.5% for pork production forecasts, meaning estimates can vary by up to 983 million pounds, introducing uncertainty. Additionally, domestic demand strength for cattle (supporting the $206 per cwt price) could weaken if recession fears intensify, while unexpected production increases in pork could pressure hog prices further.
The livestock market, as detailed in the WASDE report, offers traders a volatile yet opportunity-rich environment, with cattle prices rising to $206 per cwt and hog prices falling to $61 per cwt. LE futures, now at $207.725 per cwt, present a short-term bearish setup targeting $206 for a 1% downside, though a reversal to $209 or a mean-reversion strategy on the LE-HE spread (currently $147.225, targeting $146) provides alternatives. HE futures offer a bearish shorting opportunity, aiming for $58 with a 3-4% profit potential.

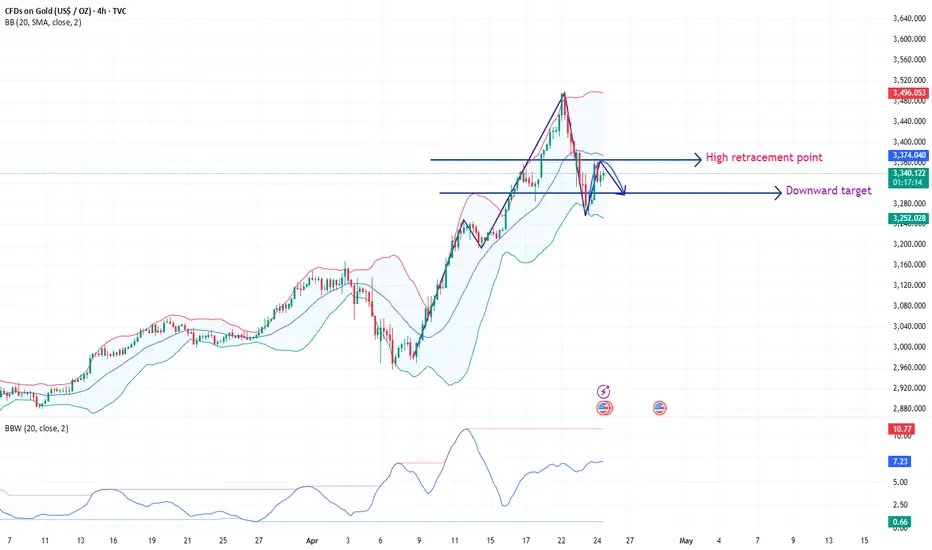
Gold short-term trading looks at retracements
Don't make things difficult for yourself, don't waste the time, don't expect any sudden surprises, just hope there will be no sudden troubles, and that will be good enough.
Today, we will focus on the suppression of 3361-67. If this level is not broken, it may weaken and fall. Of course, if it breaks and rises, the price may still be strong. Therefore, short-term operations around this range today can be carried out with a stop loss of 3175 and a take-profit of 3317/3300. Only when it falls below can we further look at 3280-3250
Gold short-term trading: short near 3365, stop loss 3375, take profit 3317/3300
Hello traders, if you have better ideas and suggestions, welcome to leave a message below, I will be very happy
Us30 Upward or downward?In the 5-minute timeframe, you can sell at the top of the trading range and buy at the bottom of the trading range (by observing reversal candles and patterns).
Alternatively, you can wait for a breakout and enter in the direction of the breakout.
Be mindful of fake breakouts

Gold still has the risk of adjustment in the short termAnalysis of gold market trend:
From the daily level, gold rose strongly during the trading session on Tuesday, touched the key price of 3500, then fell under pressure and finally closed with a negative line. This trend of rising and falling shows that the selling pressure from above is heavy, and the bulls are strongly blocked by the bears at high levels. Then, gold continued to fall on Wednesday and closed with a negative line again, forming a technical pattern of two consecutive negative lines. This continuous decline further confirms that the short-term bears are dominant.
From the 4-hour gold chart, the gold price has maintained a fluctuating decline since it was under pressure at the 3500 line. The current price has fallen back to the 3260 line at its lowest, and the short-term decline has reached 240 US dollars. Although there has been a rebound during the day, the upward trend has been destroyed. The MACD indicator double line has issued a dead cross change signal, suggesting that the callback trend may have started. Pay attention to the pressure effect of the 3368 line during the day. For the current market, the rebound is just a flash in the pan, and it rebounded sharply again, reaching the highest point near 3367 and then retreated. It is currently maintained near 3330. In fact, the market is actually at a loss for long and short positions, and is simply unable to withstand its huge shocks. For the Asian session's highs and falls, we support it according to the shock retracement. For example, if the European session rebounds again near 3358-60, we will continue to try to short, with the target at 3320-10, and a loss of 3370. The market amplitude is so drastic that I need to strictly implement good operating habits, try with a light position, strictly stop loss, and don't have a fluke mentality! On the whole, today's short-term operation strategy for gold is to rebound and short, supplemented by callbacks. The short-term focus on the upper side is 3368-3370, and the short-term focus on the lower side is 3260-3285. Friends must keep up with the rhythm.

US policy news triggers huge shock in gold Analytical StrategyThe short-term 4-hour middle track 3380 line has been lost, becoming a key counter-pressure point. As long as the price cannot stand on this position again, it will maintain a downward correction trend. If it falls below 3292, the gains and losses of the 66-day moving average 3260 will be concerned. The 1-hour level K line is under pressure from ma10 and ma5 and continues to fall. After last night's consolidation and pull-up, the current K line has re-run above ma10, and at the same time, macd forms a golden cross below the zero axis. This wave of 200 US dollars of rapid exploration has almost corrected most of the overbought situation. If the price continues to fall, or with the help of bottom divergence, it will slowly brew a short-term bottom. Today's gold rebound reminds that attention should be paid to the resistance below 3340, and the limit is below 3356. If it is not under pressure, it will still be bearish adjustment. Strong support is at 3260 or 3245. After the position stabilizes, it will begin to consider bottom-fishing. For today's short-term operation of gold, it is recommended to focus on rebound shorting and supplemented by callback longing. The short-term focus on the upper side is 3350-3370 first-line resistance, and the short-term focus on the lower side is 3300-3280 first-line support.

Let's talk about Trump, gold continues to rise
After Trump came to power again, a series of measures have deeply affected the global political and economic landscape. His policy is like a carefully planned chess game, and every move is hidden. At present, various signs indicate that Europe has become his target, and Trump is trying to achieve the strategic plot of "bleeding Europe and kicking it out of the negotiation table" by a series of means.
1. Promoting Russia-Ukraine peace talks: interest calculations under the appearance of peace
After Trump came to power, he actively devoted himself to promoting Russia-Ukraine peace talks. At first glance, it seems to contribute to world peace, but in fact it contains multiple interests of the United States. From a geopolitical perspective, the Russia-Ukraine conflict has been protracted, Russia's national strength has been continuously depleted in this war of attrition, and Europe is also deeply trapped in it. Due to sanctions on Russia, Europe's own energy supply channels have been blocked and the economy has suffered a heavy blow. If Trump succeeds in promoting peace talks, Russia will be able to get a breathing space and regain its position in the geopolitical map of Europe. In this way, Europe will lose the foundation for its tough stance against Russia. In the future strategic game with the United States, due to the internal contradictions and the change of geopolitical pattern, it will inevitably fall into a more passive and weak position.
From an economic perspective, during the Russia-Ukraine conflict, a large amount of funds flowed out of Europe due to the need for risk aversion. In theory, once Russia and Ukraine achieve peace talks, there is a possibility that these funds will flow back to Europe and stabilize the European economy. However, when promoting peace talks, the Trump administration cleverly set additional conditions, such as requiring Europe to move closer to the United States in key areas such as trade and energy cooperation. Otherwise, it will not go all out to promote the peace talks in the direction that Europe expects. This makes Europe have to listen to the United States on the road to economic recovery and gradually become a vassal of the United States' economic interests.
2. Energy pricing power game: directly hit the lifeline of the European economy
The Trump administration has listed the Alaska liquefied natural gas development project as a national priority. This move has dual strategic intentions: on the one hand, it is expected that the project will help increase the production and export of US oil and natural gas, thereby achieving the US's "energy dominance"; on the other hand, it is a "secret killer move" against the European energy market.
For a long time, the United States has been committed to breaking Europe's dependence on Russian energy and making Europe rely on US energy supply. Trump puts pressure on European allies to force them to buy expensive US energy. Take Japan and South Korea as examples. In order to avoid the US "tariff stick", they are considering investing in large natural gas projects in Alaska, and some European countries are also facing similar huge pressure. As the share of US energy in the European market gradually increases, the United States will gradually gain the right to speak on European energy pricing. Once it controls this key power, the United States can adjust energy prices at will, and with high-priced energy, it can extract the "blood" of European economic development, causing the production costs of European companies to rise sharply, and weakening Europe's overall economic competitiveness in all aspects.
3. Trade war continues: Europe becomes a "victim"
Trump vigorously promotes the trade war, and his tariff policy is like a double-edged sword. While causing harm to trading partners, it also brings certain impacts to the US economy itself. However, the Trump administration obviously has a longer-term strategic layout. In this trade war, Europe is gradually becoming a "victim".
The United States imposes high tariffs on European goods, causing European export companies to be in trouble. The share of European automobiles, high-end manufacturing products, etc. in the US market has dropped sharply. At the same time, the Trump administration cleverly used the chaos in the global trade pattern caused by the trade war to force European companies to move their production bases to the United States to enjoy various preferential policies provided by the United States. This move not only further weakened the foundation of Europe's manufacturing industry, but also caused Europe's position in the global industrial chain to continue to decline. Affected by the trade war, Europe's economic growth momentum is insufficient, a large amount of capital has flowed out, and the unemployment rate has continued to rise.
4. Release the inflation haze: shift the economic crisis to Europe
For a long time, the United States has been plagued by inflationary pressure. In order to alleviate its own economic crisis, the Trump administration intends to release the inflationary pressure in the United States. By continuously printing money and expanding fiscal deficits, the United States attempted to pass on inflationary pressure to the world, and Europe was the first to bear the brunt.
Europe and the United States are closely linked economically. As the US dollar is the world's main reserve currency, the US release of inflation has caused the dollar to depreciate. As a result, the large amount of US dollar assets held by Europe has shrunk. At the same time, the cost of importing US goods from Europe has become more expensive, which has further pushed up domestic prices in Europe. The European Central Bank is therefore in a dilemma: if it follows the United States in adopting loose monetary policies, it will further aggravate inflation; if it tightens monetary policy, it will inhibit economic growth. In this case, the European economy is stuck in a quagmire, and the United States has successfully passed on part of the cost of the economic crisis to Europe.
Trump's series of measures after taking office, whether it is promoting peace talks between Russia and Ukraine, competing for energy pricing power, continuing the trade war, or releasing US inflationary pressure, each step is precisely moving in the direction of "bleeding Europe and kicking it out of the negotiation table". Europe is facing unprecedented severe challenges in this economic war without gunpowder. Where the European economy will go in the future and how the global economic landscape will evolve will largely depend on the subsequent actions of the Trump administration and Europe's own response strategy.
Through trade wars, energy exports and other means, when the euro gradually weakens with the overall economic strength of Europe, Trump will obtain more powerful negotiation resources, thereby transferring the investment costs of the entire Russian-Ukrainian battlefield to the European economy, and he can harvest more resources.
Of course, Europe cannot be slaughtered, so returning to the current issue, the media has been reporting that Trump wants to replace Federal Reserve Chairman Powell. On the one hand, Trump hopes that the Federal Reserve will quickly cut interest rates to boost the prosperity of the US stock market. But on the other hand, Trump hopes to test whether Europe will follow the Federal Reserve in cutting interest rates by cutting interest rates. If Europe does not cut interest rates, it will inevitably lead to a greater advantage for manufacturing to return to the United States. Europe will accelerate the loss of the economic foundation of manufacturing. But if Europe follows the interest rate cut, combined with the results of the trade tariff war, it will be more open to consume the excess capacity of the United States. This will allow Trump to accelerate the transfer and digestion of US inflation.
This is a very important reason why Trump wants to replace Powell, but every time he speaks to the media, Powell is very tough and emphasizes the need to maintain the independence of the Federal Reserve. One implements its own external economic policy from the perspective of commercial asset competition. The other maintains the stability of the dollar from the perspective of currency stability. The contradiction arises in that one wants to expand without considering the risks and only cares about making money. Powell, on the other hand, considers economic stability and risks. After all, the US government is more like working for the Federal Reserve, one is like a board of directors and the other is like a CEO. The money bag is still in the Federal Reserve, and Trump needs the money bag to support his economic policy to achieve his desired goals and his own political achievements.
In a recent media speech, Trump mentioned: Gold holders make the rules. This sentence led to a crazy rise in gold prices, but then we saw that the gold price rushed to $3,500 per ounce, and then there would be a large amount of selling as long as it reached the US market stage. In my opinion, this is a selling performance led by the US government, selling at a high price to other central banks willing to take over. The gold sold by the United States at a high price must not allow other central banks to transport gold from the United States. In this way, the high-level selling seems to be exchanged for more US dollars. But the performance of gold prices rising and falling, anyway, the physical gold is still in the United States. That is, gold holders make the rules. When the United States sells gold to a certain extent and the price of gold is low enough, it will buy back gold at a low price. This is done. The gold is still in the United States, but the debt of the United States can disappear out of thin air.
Of course, this is just a way for the US government to pay off its debts. No matter how much the tariffs are added, it is actually to distinguish between enemies and friends. This crazy trade war will not last long. Not only the United States knows that it is coming, but we also know it. The reason why he still wants to do this is nothing more than to get more bargaining chips at the negotiating table. At the same time, he shows his allies how hard he is trying to suppress China's economy. But the fact is that in the future, his allies will provide blood, and he will just move his lips. After all, taking the lead in the route of suppressing China, whether or not he has achieved results, his attitude is strong enough, so he can ask his allies for more supplies later.
So we only need to pay attention to Trump in the future, how to bleed the global economy. How to dissolve the US debt. Suppress the euro, and thus announce the dominance of the US dollar again. For Asian countries, it seems that they are just watching him act. Who will win this economic war? As for who will be the final winner? There is no winner, it is just a development in confrontation. In essence, if Europe wants to escape from the clutches of the United States, it seems that it can only seek other trade models and increase Europe's infrastructure to Asia, thereby linking the economy of the entire Eurasian continent and forming the rise of the inland economy. However, Europe is currently facing a problem, that is, China's infrastructure has a global credibility and market share. It is almost impossible to be challenged. It depends on whether Europe is willing to withdraw from the stage of history, develop in a downturn, and find new ways of cooperation.
Finally, gold is bullish at 3331, with a target of around 3360

solona SOL/USDT: Key Levels to Watch
SOL/USDT trades at 146.66 (+2.94%), showing bullish momentum but facing key tests ahead.
Critical Levels
- Support: 142.12 (immediate), 138.21 (strong), 130.00 (major)
- Resistance: 151.10 (breakout zone), 155.00 (next target), 160.00 (major hurdle)
Outlook
- Bullish: Holding 142.12 and breaking 151.10 could push SOL to 155-160.
- Bearish: Losing 142.12 may trigger a drop toward 138 or 130.
Watch RSI (60.57) and MACD (4.88) for momentum clues.
Trade wisely—always confirm with volume and price action.
