Gold’s ATH Rally Slowing Down – Needs Correction!!!Gold ( OANDA:XAUUSD ) has been on a strong uptrend in recent weeks , creating a new All-Time High(ATH) almost every day. Will a new ATH be created after $3,500 in the coming days? What do you think?
Gold is moving between the Resistance zone($3,386-$3,357) and Support zone($3,282-$3,245) .
In terms of Elliott Wave theory , it seems that Gold has started to form Corrective Waves after recording the latest ATH . Gold is completing a Zigzag Correction wave (ABC/5-3-5) ( most likely ).
I expect Gold to start declining again after approaching the Resistance zone($3,386-$3,357) and attack the Support lines and Support zone($3,282-$3,245) . It seems like Gold needs a correction , do you agree with me!? In the worst-case scenario for my analysis, Gold starts falling from the resistance zone($3,431-$3,406) .
Note: If Gold can move above $3,440, we can expect more pumps and maybe make na ew All-Time High(ATH).
Gold Analyze ( XAUUSD ), 1-hour time frame.
Be sure to follow the updated ideas.
Do not forget to put a Stop loss for your positions (For every position you want to open).
Please follow your strategy; this is just my idea, and I will gladly see your ideas in this post.
Please do not forget the ✅' like '✅ button 🙏😊 & Share it with your friends; thanks, and Trade safe.
Trend Lines

Golden times!Gold is not done yet, imo. 5k is in play. Hard assets like Gold and Bitcoin are becoming a safe haven.

TOTALThings are changing. TOTAL bounced off its monthly uptrend line. We could see a major shift from here.

Atcoin Season?Possible falling wedges on the OTHERS.D chart. Are we about to move back into the channel?

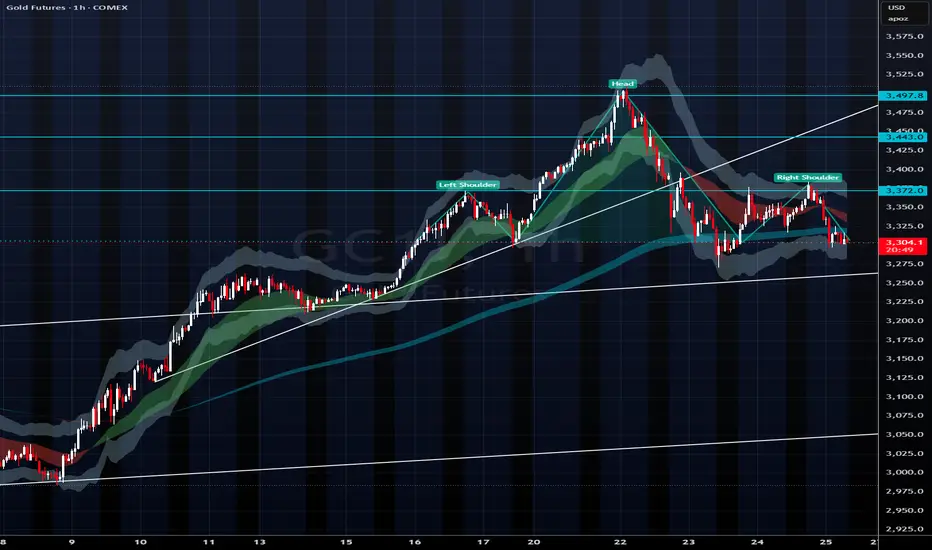
Watch to Watch - Gold Bearish Head and ShouldersWith the recent strength in US equities, the long gold trade may be over. Gold broke below a key trendline and formed a distinct bearish head and shoulder pattern signifying possible downside pressure coming up today and into the next week. Definitely worth watching for futures traders. First target with a break lower would be around $3240 with a lot of downside from there.
GBP/NZD Testing Channel Support Within UptrendIn the displayed daily chart of GBP/NZD, the price is forming a well-structured and clearly defined ascending channel. This channel is bounded by two thick lines, an upper resistance line and a lower support line, both of which have been tested multiple times by price movements. At the upper boundary, there have been three valid touches, each resulting in a significant downward reaction. Meanwhile, at the lower boundary, there have also been three strong touches, confirming the channel’s validity as the main path of the ongoing uptrend.
In addition to the major channel, there is also a minor internal channel, indicated by dashed lines, showing price movement within a phase of consolidation or minor retracement inside the larger trend. The minor support line is currently being tested, signaling a critical area to determine the next directional move.
At the moment, the price is hovering near the minor support and presents two possible scenarios moving forward.
In the first scenario, the price could bounce from this minor support, continue strengthening toward the minor resistance, and potentially extend further toward the major resistance area around 2.36–2.38.
In the second scenario, if selling pressure persists, the price may break below the minor support and continue falling toward the major support of the larger channel, located around 2.17–2.18, before eventually bouncing back upward.
Overall, this price structure indicates that the primary trend remains bullish as long as the major support within the channel holds. However, in the short term, the market is in a consolidation phase with the risk of a deeper retracement. A confirmed bounce from support or a breakdown through the minor support will be key in determining the next move. The suggested approach is to wait for clear confirmation from price action before making any trading decisions.


Falling into range oscillation, just get the rhythm pointAnalysis of gold market trend
On Thursday, the gold price remained in the 4H channel, and the middle and lower tracks were in the range of 3370-3260, with overall resistance to decline and correction; this trend is also normal;
1: In the early stage, the market fluctuated rapidly with a hundred points rise and fall, and the kinetic energy consumption was large, so the short-term trend returned to the consolidation trend later;
2: The fundamentals stopped, the technical demand was corrected, and the two resonated, and the gold price could only fluctuate and consolidate in the range; the analysis framework given yesterday was treated according to two intervals; they were 3370-3260 and 3370-3480; the strong and weak dividing point was 3370 above and below;
We can also see that at the position of 3370, the gold price has been under pressure for 2 consecutive times and fell for 2 consecutive times; it can be seen that the strong and weak dividing point of the position above and below 3370!
At present, the market:
1: Trend: There is no trend for the time being, and the range is high, the large range is 3480-3260; the bull trend is stagnant, and the bear trend stops falling. The trend cannot be judged for the time being;
2: Fundamentals, the future fundamentals will focus on the US debt crisis, trade war tariffs, and subsequent war issues, two core things; and uncertain fundamentals
Today's market:
1: 4 hours, the stochastic indicator golden cross, the main long signal; in terms of form, slow bull rise; the current pressure position of the central axis is near 3370, and the probability of breaking upward is relatively high; therefore, the 4-hour can be treated as a shock rise; but the overall situation remains in the large range of 3480-3260!
2: In the daily K-line, the stochastic indicator diverges periodically, and the death cross is downward, which is a bearish signal; however, the high-level sell-off forms a sideways resistance to the decline, and the sideways support is in the range of 3280-3260; the MACD double-line golden cross is glued, and there is no death cross; the indicators in the daily K-line are contradictory, so the long and short trends are difficult to continue, and more range oscillations and high-level consolidation signals are given;
To sum up: Today's short message is still processed according to the 4-hour range; 3370-3260 range and 3370-3480 range; if it stabilizes at 3370, the range processing will be changed; you can take a pullback to do more, and bet on the 4-hour range oscillation upward, and gradually break through the position of 3370;

EURUSD → Accumulation of liquidity before continued growthFX:EURUSD currency pair is forming a trading range within a global and local uptrend. Before continuing its growth, the market may form a false breakout.
Against the backdrop of the falling dollar, the euro is strengthening and has gained 13% over the past four months, which is a fairly significant growth indicator for the currency pair. Fundamentally, the US is trying to achieve a rapid reduction in interest rates, which may continue to support the euro...
Technically, the price is consolidating against the backdrop of a global and local uptrend. A correction is forming towards the support zone, where there is a fairly large pool of liquidity...
Resistance levels: 1.1392, 1.1439, 1.1481
Support levels: 1.130, 1.127
The price is heading towards support, namely, the market is interested in liquidity below 1.13 - 1.127, which must be tested in order to build up potential before the bullish trend possibly continues.
Best regards, R. Linda!

DXY TrendlinesUnless it brakes the downtrend with a weekly candle close it should bounce back up in long run. should be closely monitored since it will give us a lot of information about current market direction. i expect bouncing back up but we will see.

SUI Long in WIDEA for SUI in Weekly time frame:
-Analysis used: Elliot waves + Fibonacci + Ascending Channel
-Long in wave 2 retracement for a 2-3 month projection

$BLENDR - Heating UpVolume is ticking up and price action is pivoting. Classic signs of early accumulation.

$AGENT - Heating UpVolume is ticking up and price action is pivoting. Classic signs of early accumulation.

$UFO - Heating UpVolume is ticking up and price action is pivoting. Classic signs of early accumulation.

$BLUB - Heating UpVolume is ticking up and price action is pivoting. Classic signs of early accumulation.

$JUNO - Heating upVolume is ticking up and price action is pivoting. Classic signs of early accumulation.

$AIT - Heating Up Volume is ticking up and price action is pivoting. Classic signs of early accumulation.

$ENQAI - Heating Up Volume is ticking up and price action is pivoting. Classic signs of early accumulation.

$ZERO - Heating UpVolume is ticking up and price action is pivoting. Classic signs of early accumulation.

$VIA - Heating Up Volume is ticking up and price action is pivoting. Classic signs of early accumulation.

$KLS - Heating UpVolume is ticking up and price action is pivoting. Classic signs of early accumulation.

How to break through the gold shock patternOperation suggestionsTechnical analysis of gold: The current gold price is in a stalemate stage of long-short game. On the one hand, the path of the Fed's easing policy has been basically clear, and the US dollar is facing correction pressure; on the other hand, the stable global risk sentiment and the strong performance of the stock market have weakened the attractiveness of gold as a safe-haven tool. The repeated signals of global trade negotiations have also made the market direction unclear. From a technical point of view, gold has received support after the correction to the 26.3% Fibonacci retracement level near 3317 this week, and has returned to above $3,300 in the short term. The upper resistance focuses on the position of 3380. Once it breaks through, it will open up the space leading to the 3400 mark.
From the daily chart of gold, yesterday's gold price fell sharply and recorded a large real body Yin line K-line pattern. The peak pattern of the previous price high is more obvious, suggesting that the upper pressure effect is strong. The MACD indicator double line began to turn downward, increasing the risk of further correction in the short term. However, the MA5 and MA10 moving averages have not turned downward yet. You can pay attention to the support and defense of the moving average. From the 4-hour gold chart, the gold price has been fluctuating and falling since it came under pressure at the 3500 level. The current price has fallen back to the 3260 level, with a short-term decline of 240 US dollars. Although there has been a rebound during the day, the upward trend has been destroyed. The MACD indicator has issued a dead cross signal, suggesting that the correction trend may have started.
Gold fell after rising in the Asian session, and fell below the support levels of 3351 and 3330. Now the market rebounded near 3314, which is also in line with our analysis of the long and short trends. In the big trend, the gold rally did not exceed 3380, so there is still a downward demand, that is to say, it can only be regarded as a rebound during the decline. In the short term, this wave of gains stopped at 3367. Now it broke through 3351 and pierced 3316 to rebound. The main focus on the upper side is the support-to-resistance level of 51, followed by 3342. Specifically, you can wait for the area near 3345 to go short and see the gold price break the previous rebound low of 3314 to 3300. If it breaks down effectively, you can move the protection loss down to see the position of the rebound turning point of 3283 and 3260. On the whole, the short-term operation strategy of gold today is to short on rebound and long on callback. The short-term focus on the upper side is 3350-3370 resistance, and the short-term focus on the lower side is 3300-3280 support.

Gold fluctuates and is under pressure, the trend is bearish!Gold market trend analysis:
Gold technical analysis: Gold fell by $240 in two trading days, but the rebound was also very strong, from yesterday's low of 3260 to 3367 in the early trading. The current volatility is still large, and the high and low points of $100 often appear. It is normal to fluctuate by dozens of dollars at random. So pay attention to the market. There is no shortage of opportunities. Just grab what you can grasp.
From a technical perspective, yesterday's closing was negative, slightly piercing the MA10 moving average, and losing the trend support line mentioned yesterday. Originally, today's technical theory should continue to be under pressure from the MA5-day, and the rebound confirmed that trend line, which can continue to be bearish, that is, 3338-40; but today's Asian session saw a strong wave of upward rush, reaching 3367 directly, which was quite unexpected. It was basically stimulated by short-term risk aversion news, and then it began to rise and fall, and then returned to below 3340; as long as the closing cannot break through and stand above the MA5-day resistance, it is still in a downward adjustment; today, it is still bearish, and the gold layout long orders were successfully harvested at 3316. Gold rebounded to 3343 and continued to be short. Gold fell again and harvested, and won two consecutive victories again. At present, the gold rebound is limited, and the US market rebound is still short.
Gold's 1-hour moving average has formed a dead cross, so the moving average has not turned upward, so there is still downward momentum, and the rebound can continue to be shorted. After the Asian session hit a high and fell, gold rebounded several times and fell back under pressure near 3345. The US session rebounded below 3345 and continued to be shorted. It can still be shorted near the rebound of 3340. At present, gold is just a rebound. If there is no special risk-averse news, it is still difficult to go up directly. At least it must fluctuate first, and it is still bearish and volatile now. On the whole, the short-term operation strategy for gold today is to short on rebounds and to go long on pullbacks. The short-term focus on the upper side is 3368-3370 resistance, and the short-term focus on the lower side is 3260-3285 support. Friends must keep up with the rhythm.
