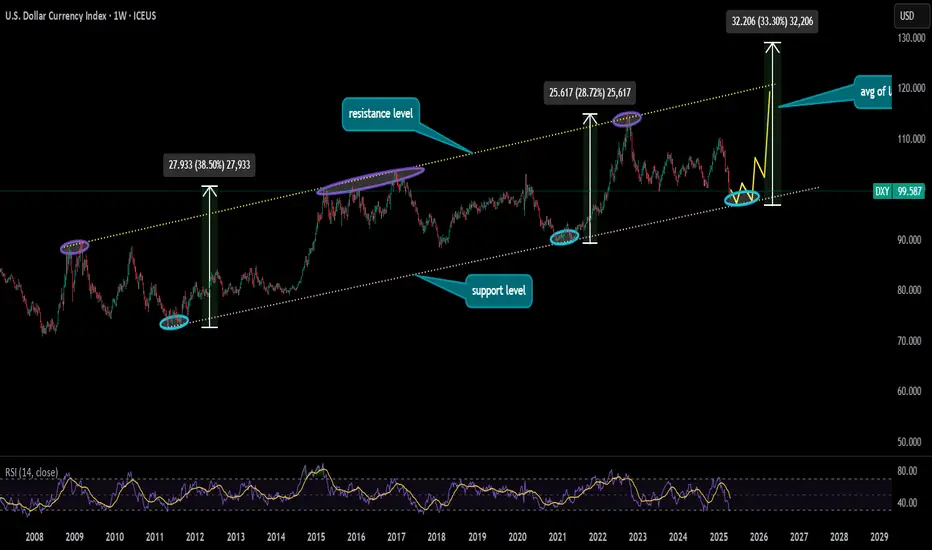
can DXY change its trend after marking 3rd HLCurrently, the price is a bit away from touching the lower trendline, which is acting as a support level as it will be its latest HL. After that, it would be interesting to know how the dollar moves because, as technical analysis on the chart suggests, DXY should move upwards to maintain that parallel channel. Tariff event, war situation and couple of other major events will also play significant role in determining the next possible movement of dollar
Trend Lines
BTC Weekly Analysis – Potential Retracement & Next TargetsAnalysis & Thought Process:
Bitcoin is currently at a critical juncture on the weekly timeframe. Having observed recent bullish momentum, the price now faces resistance around the 95,900–96,700 range. If BTC manages to clearly reverse from this resistance area, it could propel upwards to test psychological resistance at the significant 100K level within the coming days.
However, careful analysis indicates the presence of a Fair Value Gap (FVG) between 89–90K. Such imbalances in price action typically attract price retracements to achieve market efficiency. Thus, I anticipate a correction back down to the 89–90K area, which would represent an ideal zone to consider a long swing position.
Trade Idea:
Short-term bearish scenario: Look to short from current resistance levels (around 95,900–96,700) targeting the 89–90K FVG area.
Long swing setup: If BTC retraces and holds the 89–90K region, it presents an attractive area for swing long entries aiming back towards and beyond current resistance areas.
PLAN NOT VALID IF
If the price fails to hold 89K, the next logical areas to watch for support are lower down at the 82–78K range, followed by a deeper pullback potentially extending towards 74K.
Profit Targets & Stop Losses:
Short trade: Entry around 95,900–96,700, profit target at 89–90K, stop loss set slightly above the resistance (e.g., 97.5K).
Long trade: Entry at 89–90K, profit targets initially back to 96–100K. Stop loss placed just below the 88K area.
This analysis is for informational purposes only and does not constitute financial advice. Please perform your own due analyse before entering any trades.

BITCOIN → Consolidation or reversal? Why is $ 95000 important?BINANCE:BTCUSD held up quite strongly during the tariff war and largely weathered the storm, while the stock market and indices were in free fall. The improvement in the fundamental situation has once again heightened interest in the asset among traders and investors.
Earlier, I pointed out that against the backdrop of falling markets (due to Trump's policies and tariff wars), Bitcoin is holding up fairly well. It cannot be compared to gold, which maintains its status as a safe haven, but overall it has stayed out of the 73K risk zone.
Countries are continuing negotiations in the US, which generally points to an improvement in the trade situation, but all attention remains on relations between China and the US, and a resolution may be close.
Technically, on the daily/weekly timeframe, the price has broken through the trend resistance and the asset has moved from the sell zone to the buy zone, which in general only increases interest in the flagship. Bitcoin is stuck in the 95K-92K range. A false breakout of resistance provokes a correction, and now we need to monitor the price and see where the correction will stop. This will show us important support that could become the basis for consolidation.
Resistance levels: 95K, 100K, 102.5K
Support levels: 93.5, 92.9, 92, 91K
To break through 95K and continue growing, Bitcoin must form consolidation. There is none at the moment, and a correction and halt may indicate the approximate boundaries of consolidation. However, the focus is on 95 - 93.5 - 92K. If the price manages to stay within the local boundaries and continues to storm the 95K resistance, we will have a chance for a breakthrough and continued growth to 100K. Otherwise, Bitcoin may form a deeper correction, for example to 91-88K
Best regards, R. Linda!


XRP / RIPPLE | 30M | IMPORTANT LEVELSFriends,
I valued your requests and prepared the following Ripple analysis: If Ripple drops below the level of 2.1807 for 30 minutes, the target will be the 2.1424 level. This level holds a very significant support zone.
The most critical support level is located at 2.1085.
If Ripple does not fall below this support zone, my target level for Ripple will be 2.2495.
Please don't forget to like.
Thank you to everyone who supports with likes.

EURUSD Bullish or Bearish Today?As you can see in my chart drawing, EURUSD is going through an uptrend channel. Now it's coming from the channel resistance, so it might be a pullback until the channel bottom.
On the other hand, the euro is gaining fundamental strength against the USD!
Therefore, the trend may persist until this week's NFP. This analysis is based on the current trend and fundamental situation of the market.
This information is not financial advice or any trade signal; it's just for educational purposes, so please do your own analysis before taking any entry on this asset.
Thank you

GOLD UPDATEHello friends✌
As you can see, after a sharp price drop, gold has entered a range that has formed a double top pattern that warns us of a continued price drop, so be careful🔊📈
*Trade safely with us*

FTSE MIB (IT40) Stock Quote | Chart & Forecast SummaryKey Indicators On Trade Set Up In General
1. Push Set Up
2. Range Set up
3. Break & Retest Set Up
Notes On Session
# FTSE MIB (IT40) Stock Quote
- Double Formation
* (A+ Set Up)) | Completed Survey
* Wave Feature + Long Entry Bias | Subdivision 1
- Triple Formation
* ((No Trade)) At 0.80% To Percentage Related Settings | Subdivision 2
* (TP1) | Subdivision 3
* Daily Time Frame | Trend Settings Condition
- (Hypothesis On Entry Bias)) | Indexed To 100
- Position On A 1.5RR
* Stop Loss At 129.00 EUR
* Entry At 135.00 EUR
* Take Profit At 145.00 EUR
* (Uptrend Argument)) & No Pattern Confirmation
* Ongoing Entry & (Neutral Area))
Active Sessions On Relevant Range & Elemented Probabilities;
European-Session(Upwards) - East Coast-Session(Downwards) - Asian-Session(Ranging)
Conclusion | Trade Plan Execution & Risk Management On Demand;
Overall Consensus | Buy

Bitcoin's next targets are 140K and 250K !This analysis is an update of the analysis you see in the "Related publications" section
Are Bitcoin's mid-term targets still valid?
First of all, please review the previous analysis
In our last analysis, we mentioned that if there was any drop, it would likely be towards the resistance line that had been broken, and we identified the pullback zone around the 77K channel.
Now, based on the available data, the pullback has been successful, and Bitcoin's target is to move toward the 130-140K range. A 3D pattern has formed, and the third drive could complete within this range, after which Bitcoin may enter a corrective phase.
But what about the second target | 250K?
Why are we considering this target? There are several reasons:
First, the bullish wave in gold was preventing capital from flowing into cryptocurrencies, especially Bitcoin. Now, gold is reaching the end of its bullish wave, which could lead to significant liquidity flowing into crypto and Bitcoin.
Second, Bitcoin's channel structure remains very bullish. If substantial liquidity enters the market, not only could the 250K target be achieved, but Bitcoin might even reach higher levels.

DOGEUSDT is gonna pump hard this time wait for above 0.5$As we said before the red trendline is broke and market after 70% fall now is ready for another bull run here and we are looking for same targets like previous time for DOGEUSDT also if and only if 0.45$ break this time to the upside we can expect more rise to the targets like 0.75$ and more even.
DISCLAIMER: ((trade based on your own decision))
<<press like👍 if you enjoy💚

SHIBUSDT pump from major daily supports startedAs we mentioned a lot:
the gain started this time from our support and now it can easily continue to at least red trendline resistance which is first target.
DISCLAIMER: ((trade based on your own decision))
<<press like👍 if you enjoy💚

PEPEUSDT Another +100% cooking, soon above 0.000017$As we can see price now is near one of the major resistance zones and also red trendline is broken now we can expect some range here or not and soon after that heavy pump is ahead to the target mentioned on the chart with price label.
DISCLAIMER: ((trade based on your own decision))
<<press like👍 if you enjoy💚

$PRCL - Heating UpVolume is ticking up and price action is pivoting. Classic signs of early accumulation.

$MYRIA - Heating UpVolume is ticking up and price action is pivoting. Classic signs of early accumulation.

$SYNT - Heating UpVolume is ticking up and price action is pivoting. Classic signs of early accumulation.

$DEAI - Heating UpVolume is ticking up and price action is pivoting. Classic signs of early accumulation.

$HGPT - Heating UpVolume is ticking up and price action is pivoting. Classic signs of early accumulation.

DaVita Inc. Stock Quote | Chart & Forecast SummaryKey Indicators On Trade Set Up In General
1. Push Set Up
2. Range Set up
3. Break & Retest Set Up
Notes On Session
# DaVita Inc. Stock Quote
- Double Formation
* (Consolidation Argument)) | Completed Survey
* Wave Feature(Flat Structure) | Subdivision 1
- Triple Formation
* ((No Trade)) At 200.00 USD | Subdivision 2
* (TP1) | Subdivision 3
* Daily Time Frame | Trend Settings Condition
- (Hypothesis On Entry Bias)) | Logarithmic Settings
- Position On A 1.5RR
* Stop Loss At 150.00 USD
* Entry At 140.00 USD
* Take Profit At 125.00 USD
* (Continuation Argument)) & No Pattern Confirmation
* Ongoing Entry & (Neutral Area))
Active Sessions On Relevant Range & Elemented Probabilities;
European-Session(Upwards) - East Coast-Session(Downwards) - Asian-Session(Ranging)
Conclusion | Trade Plan Execution & Risk Management On Demand;
Overall Consensus | Neutral

Gold Trend Weekly Review Operation strategy layout for next weekWhat news has recently affected the trend of gold and crude oil? How to judge the future market of gold bulls and bears?
Spot gold fell nearly 1% on Friday, closing at 3316.26. Although the price of gold finally closed above 3300 this week, the trend of gold prices this week can be described as ups and downs. The intraday transactions fluctuated by nearly $100 many times. Under the situation of trade tensions, the market was risk-averse, pushing the price of gold above 3500. After Trump's unilateral statement on tariffs eased, coupled with the 3500 mark, investors closed their long positions, and the lowest price of gold fell to around 3260 during the week. At the moment when tariffs were deadlocked, any remarks made by Trump on tariffs did not reduce the risk of the market, but increased the uncertainty of the market and the volatility of gold prices. So far this year, gold has risen by more than 25%. Trump's repeated changes in his criticism of Powell this week are also a major factor driving the sharp fluctuations in gold prices. U.S. President Trump said on Monday that the U.S. economy may slow down unless interest rates are lowered immediately, and criticized Federal Reserve Chairman Powell again. Powell said that interest rates should not be cut until it is clearer that Trump's tariff plan will not lead to a sustained surge in inflation.
The ADP employment report, known as the "small non-farm", will also be released next Wednesday, along with the latest PCE inflation and consumption data. The crucial core PCE price index is expected to rise 0.1% month-on-month in March, and the year-on-year growth rate will slow from the previous value of 2.8% to 2.5%; personal consumption is expected to maintain a month-on-month increase of 0.4%, indicating that US household consumption remains strong. However, the real focus will be the non-farm payrolls report scheduled for release next Friday, and speculation is currently very intense about when the Fed will cut interest rates. Non-farm payrolls growth is expected to slow from 228,000 in March to 130,000 in April, and the unemployment rate remains unchanged at 4.2%. Average wages may increase by 0.3% month-on-month in April. The disappointing non-farm payrolls, coupled with weak core PCE data, may reinforce expectations that the Fed will cut interest rates by 25 basis points in June rather than July, but for May, the market generally expects the Fed to remain on hold. From a macro-trend perspective, gold is still in an upward trend, as real yields may continue to fall against the backdrop of the Fed's accommodative policy. But in the short term, if positive news about tariffs continues to come, gold prices may fall further as the market is re-adjusting expectations. In the long run, structural positive factors still exist, and emerging markets have further room for adjustment in the composition of foreign exchange reserves, and may gradually move closer to the reserve structure of developed countries in the future. Fed officials said they are not in a hurry to adjust monetary policy, and further observation is still needed to determine how the Trump administration's tariff policy affects the US economy.
Analysis of gold market trends next Monday:
Gold technical analysis: From the performance of the daily chart, the recent trend of gold prices has shown a high consolidation trend, with a significant correction from the high point near $3,500. After hitting the low point of the week, the gold price rebounded to a certain extent, but the rebound strength was blocked near the 23.6% Fibonacci retracement level (about 3368-3370 US dollars), which has now become an important short-term resistance. The opening trend of the gold market on Friday was like yesterday. The upward mode started in the Asian session, rising all the way to around 3370 US dollars. However, it encountered strong resistance here and then turned downward and started to fall. It is worth noting that on Friday, the gold price not only failed to break through this key resistance level, but also fell below the low point hit by the European and American sessions yesterday, and rebounded after reaching the lowest point of 3265 US dollars.
From the current market structure, the position of 3260 US dollars has become the focus of the market. Investors need to pay close attention to whether the gold price can reach or even fall below this point. Once it effectively falls below, the short trend will be further strengthened, and the market may usher in a deeper adjustment. From the current situation, there are two Yins enclosing Yangs, so the adjustment will continue at the beginning of next week; of course, this adjustment can be replaced by sideways trading, which means that it is not ruled out that it will run back and forth in the 3260-3370 range. On the whole, the short-term operation strategy for gold next Monday is to focus on long positions on pullbacks and short positions on rebounds. The short-term focus on the upper side is 3368-3370 resistance, and the short-term focus on the lower side is 3265-3260 support. Friends must keep up with the rhythm. It is necessary to control the position and stop loss, set stop loss strictly, and do not resist single operations. The specific points are mainly based on real-time intraday trading. Welcome to experience and exchange real-time market conditions.

GOLD (XAUUSD): Very Bullish Setup
Gold closed on Friday in a strong bullish mood.
The price started to rise after a test of the underlined blue
support cluster.
A breakout of a resistance line of a falling channel on an hourly
provides a strong intraday confirmation.
I expect a rise at least to 3439
❤️Please, support my work with like, thank you!❤️
I am part of Trade Nation's Influencer program and receive a monthly fee for using their TradingView charts in my analysis.

GBPNZD, Bullish Trend, Trendline, Consolidation, Seasonalityfundamental Analysis
1. Overall fundamentals shows bullishness in GBP while NZD is somewhat on weaker side
2. Seasonality shows Bullish trend in GBPNZD from start of May till Mid
Technical Analysis
1. Bullish Trend with trendline retest
2. Bullish divergence on 4h
3. consolidation at bottom
4. Buy on breakout above consolidation rectangle
5. SL below rectangle

Progressive Corp. Stock Quote | Chart & Forecast SummaryKey Indicators On Trade Set Up In General
1. Push Set Up
2. Range Set up
3. Break & Retest Set Up
Notes On Session
# Progressive Corp. Stock Quote
- Double Formation
* (Diagonal) Starting At 212.00 USD | Completed Survey
* Wave Feature(Flat Structure) | Subdivision 1
- Triple Formation
* (EMA Settings)) & Uptrend Bias | Subdivision 2
* (TP1) | Subdivision 3
* Daily Time Frame | Trend Settings Condition
- (Hypothesis On Entry Bias)) | Indexed to 100
- Position On A 1.5RR
* Stop Loss At 122.00 USD
* Entry At 127.00 USD
* Take Profit At 135.00 USD
* (Continuation Argument)) & No Pattern Confirmation
* Ongoing Entry & (Neutral Area))
Active Sessions On Relevant Range & Elemented Probabilities;
European-Session(Upwards) - East Coast-Session(Downwards) - Asian-Session(Ranging)
Conclusion | Trade Plan Execution & Risk Management On Demand;
Overall Consensus | Buy

EURUSD DETAILED ANALYSISEURUSD has been gaining bullish momentum so far this year. We’ve seen how price has been moving on a rising channel from the daily perspective. Price is just 1.6% away from the higher timeframe downtrend resistance trendline . If we get a break above the higher resistance trendline , we’re likely to see more of the bullish growth for the rest of the second quarter of the year. If we see price fall below the local daily rising channel and also below the pullback support, a downward trend continues!
