AARTIIND | Buy @LTP | SL below 340 | 1st Target 566, 2nd 765Disclaimer:
This is not financial advice. Please do your own research or consult with a financial advisor before making any investment decisions. Investments in stocks can be risky and may result in loss of capital.
Trend Lines

S/USDT 4H1. Price Trend and Key Levels
The current price is around 0.5250, attempting to hold above that zone.
Key resistance levels:
0.5300 (first major resistance)
0.5900 – 0.5999 (strong resistance zone)
0.6450 (long-term resistance)
Key support levels:
0.4585
0.4010 (stronger support at channel bottom)
---
2. Indicators Overview
BB %B (Bollinger Band Midline)
Currently below the midline, indicating past selling pressure. However, the indicator is curving upward, suggesting a possible shift toward buying.
WaveTrend (WT_LB)
Both WT lines have bounced from the oversold area (below the -60 green line), signaling a potential start of a bullish wave.
---
3. Trendlines & Channels
Multiple descending trendlines from the previous top (in blue) act as dynamic resistance.
Price is fluctuating between the blue channels marked 50000 and 30000.
---
Conclusion – Long or Short?
Long Scenario:
If the price breaks and holds above 0.5300 with strong volume:
Target: 0.5900 to 0.5999
Stop-loss: Below 0.5150
Short Scenario:
If the price fails to break 0.5300 and forms a strong bearish candle:
Target: 0.4585
Stop-loss: Above 0.5350
---
Final Thought:
Momentum is shifting toward the bulls, but there’s no strong confirmation yet. It’s better to wait for a clear breakout above 0.5300 before entering a strong long.
If you prefer an early entry, a light long position with tight risk management could be considered.
Would you like a precise entry strategy with targets and risk/reward?

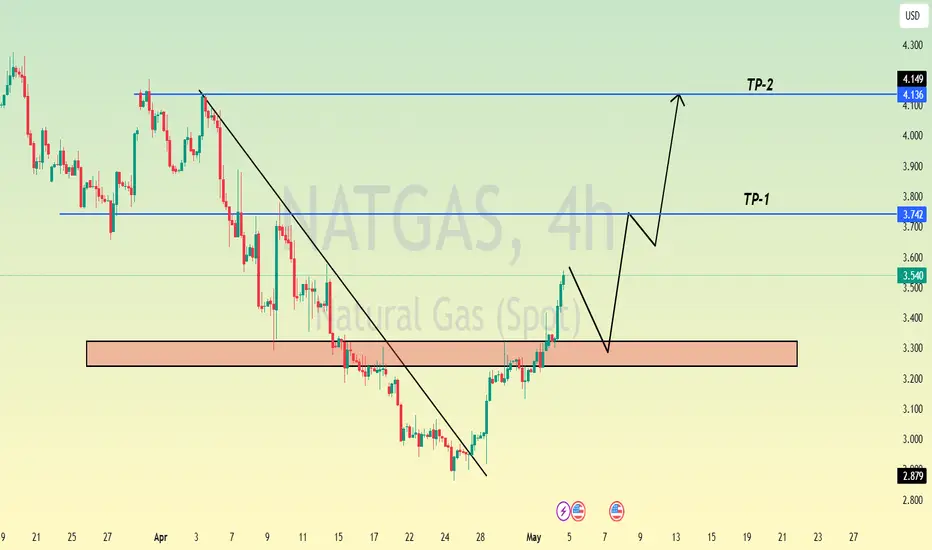
Natural Gas is in the Buying DirectionHello Traders
In This Chart NATGAS HOURLY Forex Forecast By FOREX PLANET
today NATGAS analysis 👆
🟢This Chart includes_ (NATGAS market update)
🟢What is The Next Opportunity on NATGAS Market
🟢how to Enter to the Valid Entry With Assurance Profit
This CHART is For Trader's that Want to Improve Their Technical Analysis Skills and Their Trading By Understanding How To Analyze The Market Using Multiple Timeframes and Understanding The Bigger Picture on the Charts
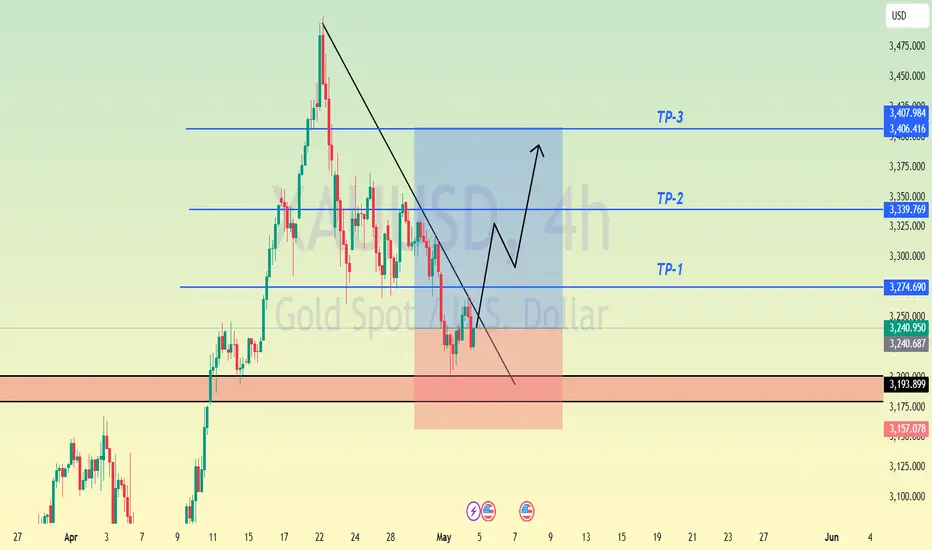
It’s the right time to short📌Fundamentals:
This week, the Federal Reserve will hold a rate decision, which is expected to dominate the market this week. In addition, we need to continue to pay attention to news related to the international trade situation.
📊Technical aspects:
The 1-hour moving average begins to turn, so the unilateral decline of gold has temporarily come to an end. However, the rise of gold has reached the key resistance area in the early stage, which is the starting point of the early stage of 3330. It is obviously not appropriate to chase more at this position, so the short-term may begin to adjust, and gold will go short at 3325 first. The market is changing rapidly. If gold breaks upward without stepping back, there will be no opportunity to go long. Then there is no need to chase more gold. Go short first and look at the decline and adjustment. On the whole, the short-term operation strategy of gold today is to go short on rebounds and go long on pullbacks. The short-term focus on the upper resistance of 3328-3330, and the support on the lower side is 3280-3293.
🎯Practical strategy:
Short gold when it rebounds to around 3325-3328, target around 3300-3280.
Buy gold when it falls back to 3280-3295, target around 3325-30.

Bitcoin Potential UpsidesHey Traders, in today's trading session we are monitoring Bitcoin for a buying opportunity around 95,000 zone, Bitcoin is trading in an uptrend and currently is in a correction phase in which it is approaching the trend at 95,000 support and resistance area.
Trade safe, Joe.

Gold - All eyes on Wednesday 08 May - FED🟡 Gold Traders: Nothing Matters Until Wednesday! ⏳💤
Hey traders! 👋
This week, all eyes are on Wednesday... and everything before that? Mostly noise.
Let me break it down for you. 👇
📊 Technical Outlook
Gold is chilling above a key resistance level right now.
Trendlines suggest we won’t see any major moves before Wednesday unless big news drops. 📰
🕐 Asian session is kicking things off above resistance.
If bulls show up there, we could break Trendline 1 (Image below) and head towards the $3300 🎯 target.
📉 RSI across multiple timeframes? Pretty neutral.
If Asia trades flat or slightly bearish, gold might range between $3210–$3250.
Break below $3201, and things could get shaky... but the European session might push us back above that support.
U.S. session on Monday? Likely a sideways snoozefest 😴 (unless surprise news hits).
🎯 Trade Setup (Mon–Wed)
I’m looking to play the range between:
$3261 (Trendline 2) 🔼 and $3169 (Trendline 4) 🔽
That’s a comfy $90 window I’m aiming to trade before Wednesday's fireworks. 🚀
🔮 After Wednesday – The FED Factor 💣
Here’s the real catalyst:
Wednesday, May 7 at 2:00 PM EST – FOMC Rate Decision
If the FED cuts rates (not likely, but possible under pressure), gold could tank hard. 💥
I’m talking a potential drop to $3150 or lower 🕳️📉
That’d be a -$90+ move easy.
FED has been holding the line 💪, resisting pressure (especially from Trump back in the day), but if the economy flashes red, that rate cut might come sooner than expected.
🧠 Final Thoughts
FED paused hikes, but left the door open for 3 rate cuts this year.
Until we get more clarity, no strong bullish signals on gold.
My bias stays: Bearish unless proven otherwise. 🐻💬
Stay sharp out there, and watch those sessions. Wednesday’s the real deal! 💼📉
And last but not least, look at this and let us know what you think about please:
Some would say its impossible but as we know, gold can do everything!
-------------------------------------------------------------------------
This is just my personal market idea and not financial advice! 📢 Trading gold and other financial instruments carries risks – only invest what you can afford to lose. Always do your own analysis, use solid risk management, and trade responsibly.
Good luck and safe trading! 🚀📊

Swing Trading/XAUUSDband trading strategy points out. XAUUSD can be bought on the left side, TP3330-3350.
Aggressive traders can buy at the current price. Conservative traders can wait until the price retreats to around 3300 or below before buying.
The Swing Trading Strategy Center continues to announce trading opportunities. Stay tuned.

PEPE | BULLSH | ALT can +150%PEPE seems to have bottomed out after flashing bullish signs on the chart.
Once we close ABOVE the 50 day moving averages (green line) in the weekly timeframe, that's when we'll know the bullish action is full steam:
Make sure you don't miss the update on BTC here:
______________________
BINANCE:PEPEUSDT

Let's wait for gold to break new highs
Today, the price of gold bottomed out and rebounded, breaking through the expected dividing point of 3260.
At this time, many traders need to learn to adjust their thinking.
If it is a retracement, on the one hand, the price will not break through and open a decline, and on the other hand, after the force is too strong, it must be a position adjustment and a reverse long.
Even if you don’t go long, you can’t go short easily. In many cases, the rules of trading must be followed.
The second rise from the low point to the high point just corrected the 382 support 3252 and continued to rise and break the high. It depends on whether you have the courage to enter the market.
The intraday increase of 80 US dollars +, today there is only one idea, continue to go long;
The support level refers to 3210 and 3215, you can go long in batches, with 3290 as defense, and continue to watch the gold price break high!
After the strength, there will be a second high point!
Thank you dear traders for reading, if you like it, please tell me

XAUUSD - Gold Trend Before FOMC!Gold is trading above its EMA200 and EMA50 on the 4-hour timeframe and is trading on its uptrend line. A continued upward move in gold will put it in the supply zone, where it is possible to look for short positions. A downward correction in gold will also open up long positions.
Gold traders endured another turbulent week, marked by the second consecutive decline in prices—once again underscoring the market’s acute sensitivity to economic news and developments.
Adrian Day, CEO of Adrian Day Asset Management, offered a cautiously humorous take on the situation by likening it to the Peggy Lee song that asks, “Is that all there is?” He pointed out that gold has pulled back by over 7% from its recent high in less than two weeks.Although this correction is notable, it hasn’t been deep enough to flush out all short-term traders or weak-handed investors from the market.
Day added that rising fears of a U.S. recession—which typically exert early downward pressure on gold—alongside the possibility of easing U.S.-China trade tensions, may limit investment demand for gold in the short term. Concluding his comments, he maintained a cautious stance, saying that further downside remains likely and that his outlook for the coming week is bearish.
Meanwhile, U.S. President Donald Trump, in a new interview with NBC, addressed several key economic and political issues. He stated that if necessary, the deadline for selling TikTok would be extended, and some tariffs on Chinese goods might become permanent. Nevertheless, he indicated that he is also considering reducing certain tariffs in the future.
Trump emphasized that small businesses do not require additional assistance and that the Federal Reserve should cut interest rates. He confirmed that Jerome Powell will remain Fed Chair through the end of his term in 2026. He also mentioned potential successors for his own position, naming Vance and Rubio as possibilities.
After a week dominated by employment data, the upcoming week will be entirely focused on monetary policy. The centerpiece will be the May FOMC meeting, the Fed’s rate decision, and Jerome Powell’s press conference on Wednesday. While markets broadly expect the Fed to hold rates steady, Powell’s official remarks and answers to press questions—especially following his sharp tone earlier in April—will be under close scrutiny.
It is widely expected that the Federal Reserve will leave its key interest rate unchanged on Wednesday, as policymakers assess how President Trump’s tariffs gradually impact various sectors of the economy. Markets are currently pricing in a potential rate cut starting in July. The Fed’s dual mandate is to maintain low inflation and high employment, and it may face a dilemma if tariffs negatively affect both indicators, as many economists now warn.
Immediately following the Fed meeting, senior policymakers including Barr, Kugler, Waller, and Cook will travel to Iceland to attend the Reykjavik Economic Conference. On Friday, they will participate in panels discussing artificial intelligence, labor market trends, and monetary research—topics that could offer insights into the Fed’s long-term policy direction.
Simultaneously, traders are also awaiting two key reports: the ISM Services Index for May, due today, and weekly jobless claims figures set for release on Thursday. Together, these reports will help complete the picture of the U.S. economy as critical monetary policy decisions approach.

BTCUSD short-term view.It is a good opportunity to sell BTCUSD in real time. Short-term is based on the right side of the swing trading, with a target of 93000-92500. In addition, the uncertainty of the news on BTCUSD. It is a good time to sell now.

$PEPEUSDT about to make a huge bullish moveAfter a long bearish move, BINANCE:PEPEUSDT has finally broken out of its bearish trendline and also a resistance zone. It is about to retest the resistance zone which will turn to a support zone, and then kick-off a huge bullish rally to the previous ATH (All Time High), and possibly way above it.
Be on the look out and expect minor retracements while at it as there are some support and resistance zones it can bounce off from. These zones are already marked out in the setup.
Do comment your thoughts regarding the analysis, and boost it so it gets to others.

How to plan when gold’s rise encounters resistance🗞News side:
1. Pay attention to the recent trade situation and news about the Fed's interest rate cuts
2. Be wary of DXY trends
3. The situation of the Russian-Ukrainian war and the follow-up events of the India-Pakistan conflict
4.Trump imposes 100% tariff on non-US films
📈Technical aspects:
Compared with today's market, the morning rise happened to be a sideways price, breaking through the previous high point. In a volatile rise, it doesn't matter. It is very likely that in the later trend, the price will return to the starting point or even lower, but it can continue to rise. This is a feature of the shock. At the same time, the current market is not extremely strong, and it is still in a volatile rise. Therefore, do not chase long, but retrace as much support as possible.
🎁SELL 3315-3325
🎁TP 3280-3270
🎁BUY 3270-3280
🎁TP 3300-3310
If you agree with this point of view, or you have a better idea, please leave a message in the comment area. I look forward to hearing different voices.
OANDA:XAUUSD FX:XAUUSD FXOPEN:XAUUSD FOREXCOM:XAUUSD TVC:GOLD

Bitcoin - Bitcoin on the Road to $100,000?!Bitcoin is in its descending channel on the four-hour timeframe, between EMA50 and EMA200. If Bitcoin moves downward towards the specified demand zone, we can look for its next buying opportunities.
It should be noted that there is a possibility of heavy fluctuations and shadows due to the movement of whales in the market and compliance with capital management in the cryptocurrency market will be more important. If the downward trend continues, we can buy in the demand range.
In April, Bitcoin recorded a growth of 14.7%, successfully rebounding from a sharp early-month decline that had dragged its price down to $74,901. This level marks Bitcoin’s lowest price point in 2025 so far.
U.S. President Donald Trump, in an interview with NBC News, responded to growing concerns about a possible economic recession by saying that everything would be “fine.” He referred to the current phase as a “transitional period” and expressed confidence that the U.S. economy would perform “extraordinarily well.” When asked directly if he feared a recession, Trump replied, “No,” though he added, “Anything is possible, but I believe we are headed toward having the greatest economy in our nation’s history.”
On the other hand, Ethereum ended April with a 1.58% decline—marking its fifth consecutive month of losses. Over the past year, Ethereum has only seen gains in three months, and it is currently down 36.7% compared to the same period last year.
Strategy, formerly known as MicroStrategy, announced its intention to invest up to $84 billion in Bitcoin. The funds will be raised evenly through stock issuance ($42 billion) and debt securities ($42 billion).
In the first quarter of 2025, Strategy reported a profit of $5.8 billion from its Bitcoin investments, achieving a return of 13.7%. The company has also raised its annual targets, increasing its projected Bitcoin return from 15% to 25% and its dollar profit goal from $10 billion to $15 billion.Meanwhile, the short-term holder profit/loss ratio for Bitcoin has returned to a neutral level of 1.0, indicating balance between coins held at a profit and those at a loss. Historically, this level has often served as resistance during bearish phases. If prices remain above this point, it could signal strengthening momentum and a potential market recovery.
Elsewhere, reports indicate that Apple has violated a previous antitrust ruling by continuing to restrict users from accessing alternative payment methods outside of the App Store. The decision, issued by Judge Yvonne Gonzalez Rogers, now requires Apple to allow apps—including those related to crypto and NFTs—to operate without paying fees or seeking special approval. This ruling immediately strips Apple of its ability to collect commissions on out-of-app purchases and prohibits the company from monitoring or tracking such transactions.

GBPAUD Selling Trading IdeaHello Traders
In This Chart GBP/AUD 4 HOURLY Forex Forecast By FOREX PLANET
today GBP/AUD analysis 👆
🟢This Chart includes_ (GBP/AUD market update)
🟢What is The Next Opportunity on GBP/AUD Market
🟢how to Enter to the Valid Entry With Assurance Profit
This CHART is For Trader's that Want to Improve Their Technical Analysis Skills and Their Trading By Understanding How To Analyze The Market Using Multiple Timeframes and Understanding The Bigger Picture on the Charts

Silver is Again in the Bullish directionHello Traders
In This Chart XAGUSD HOURLY Forex Forecast By FOREX PLANET
today XAGUSD analysis 👆
🟢This Chart includes_ (XAGUSD market update)
🟢What is The Next Opportunity on XAGUSD Market
🟢how to Enter to the Valid Entry With Assurance Profit
This CHART is For Trader's that Want to Improve Their Technical Analysis Skills and Their Trading By Understanding How To Analyze The Market Using Multiple Timeframes and Understanding The Bigger Picture on the Charts

USDJPY UPDATED Technical Elements Observed
Bullish Reversal Setup:
There’s a greyed box indicating a potential bullish setup.
A projected “W” pattern (double bottom) is drawn within the red zone, implying a reversal formation.
Support Zone (Red Area):
Range: ~143.791 to 144.486
The chart suggests a possible bounce off this zone.
This is the critical demand/support area.
Resistance / Target Zone:
Target price: ~147.056
This implies a ~200-pip upside move from the support area.
Stop-Loss Indication:
Below the red zone: ~143.700
This is a conservative stop-loss based on the chart setup.
Trade Idea Summary (Based on Drawing)
Buy Zone: 144.486–144.000
Stop Loss: ~143.700
Take Profit: ~147.056
Risk:Reward Ratio: Approximately 1:3 or better

Gold Will be Bullish from a Historic Support LevelHello Traders
In This Chart GOLD HOURLY Forex Forecast By FOREX PLANET
today Gold analysis 👆
🟢This Chart includes_ (GOLD market update)
🟢What is The Next Opportunity on GOLD Market
🟢how to Enter to the Valid Entry With Assurance Profit
This CHART is For Trader's that Want to Improve Their Technical Analysis Skills and Their Trading By Understanding How To Analyze The Market Using Multiple Timeframes and Understanding The Bigger Picture on the Charts
Gold update next weekI really wanted to sell at a higher price.
But the selling pressure was very strong, not overcoming the resistance, so I came up with a new strategy to sell gold at a lower price. Do you have any other ideas? Leave a comment.
Limit sell 3255 sl65
Limit sell 3272 sl 82 ( fake break)
Take profit 3178- 3070
---
Limit buy 3070
SL 3048.5 TP 3178
---
Limit buy 2994- 2982
SL 2972 TP 3090- 3170

Silver Analysis: Bearish Continuation Toward $31 Support ?🧠 Chart Context & Setup
Chart Type: Candlestick
Timeframe: Likely 4H or Daily
Indicators Used:
EMA 50 (Red) — 32.814
EMA 200 (Blue) — 32.559
🔍 Key Technical Levels
Resistance Zone: 33.600 – 33.950
Price faced repeated rejection in this zone, confirming it as a valid supply/resistance area.
Support Zone: 30.600 – 31.100
Marked as the next potential demand zone, aligning with previous accumulation and reaction levels.
Current Price: ~32.618
Just below the 50 EMA and slightly above the 200 EMA.
🔄 Market Structure
The market experienced a strong bearish impulse in early April, followed by a bullish correction that reclaimed the 200 EMA.
Multiple internal liquidity (INT.LQ) sweeps were taken before forming a potential lower high (LH) at the resistance zone.
The recent bearish move broke below the EMAs and previous structure, indicating a possible shift back to bearish momentum.
📉 Bearish Scenario Outlook (Most Probable as of Now)
The chart shows a projected lower high formation, likely leading into a continuation of the bearish move.
If price fails to break back above 32.800–32.900, we could expect a sell-off toward the support zone (30.600–31.100).
This move aligns with:
Breakdown below EMAs
Failed bullish continuation
Rejection from a strong resistance zone
🧭 EMA Analysis
EMA 50 > EMA 200, but the price is now sandwiched and showing signs of weakness.
If price sustains below both EMAs, momentum is likely to favor bears in the short to medium term.
⚠️ Risk Factors to Watch
Any strong bullish engulfing candle reclaiming the 33.000 zone could invalidate the bearish thesis.
Fundamentals like USD volatility, inflation data, or geopolitical tension could impact Silver drastically.
✅ Conclusion
The chart currently suggests a bearish continuation setup, with the potential for price to revisit the $31.00–$30.60 support zone after rejecting resistance. A retest of broken structure around 32.700–32.800 might provide an ideal entry for sellers.

TSLA daily trading (option)1. Key Level: TSLA was at a risky spot — it hit resistance and has been moving sideways, with about a 50/50 chance of going up or down.
2. Strategy Triggered: It dropped and then retested the 50 SMA on the H1 chart.
3. Pattern Observed: An uptrend breakdown.
➡️ I think TSLA could go up in the long term (next 1–2 weeks), but we might see a red candle tomorrow or Monday

NZDCHF Elliott Wave AnalysisHello friends
In the NZDCHF currency pair chart, we are witnessing the formation of a complete Elliott wave pattern. These waves from 1 to 5 are clearly defined. Now this 5-wave pattern is an upward contracting triangle that usually forms in waves 1 or 4 or 5 or C.
Considering the counting of the previous waves, which is a wide ABC with a C wave extended or waves 1 to 3, we assume that we are facing wave 1 or 4. It is definitely not wave 5 or C.
So if it is wave 1, then it must correct at least 50 to 61.8% of Fibonacci from wave 1.
So the first target is the 04800 range.
If it is wave 5, it must go below the bottom of wave 3 and the second target is at least the 04600 range.
This movement usually occurs with a break of the trend line and a pullback to it.
Good luck and be profitable.

GOLD(XAUUSD) -Weekly Forecast,Technical Analysis & Trading IdeasMidterm forecast:
2772.38 is a major support, while this level is not broken, the Midterm wave will be uptrend.
TVC:GOLD OANDA:XAUUSD
Technical analysis:
A trough is formed in daily chart at 2956.50 on 04/07/2025, so more gains to resistance(s) 3357.00, 3500.00 and more heights is expected.
Take Profits:
2833.00
2879.11
2955.00
3057.40
3160.00
3257.03
3357.00
3500.00
__________________________________________________________________
❤️ If you find this helpful and want more FREE forecasts in TradingView,
. . . . . . . . Hit the 'BOOST' button 👍
. . . . . . . . . . . Drop some feedback in the comments below! (e.g., What did you find most useful? How can we improve?)
🙏 Your support is appreciated!
Now, it's your turn!
Be sure to leave a comment; let us know how you see this opportunity and forecast.
Have a successful week,
ForecastCity Support Team
