Wave 5 Completed – Time to Ride the Correction!"Structure Overview
Wave Count: You’ve marked the end of wave (5), indicating a potential trend reversal or correction.
Bearish Setup:
Price rejected the orange supply zone post wave (5), suggesting bearish pressure.
Entry appears to be near the top of the small pullback into that zone.
Target is set near the larger demand zone around 1.12274.
Right-Side Box (Key Idea Summary):
Suggests a range-bound market, followed by:
A lower high into a new supply zone (brown box).
A sharp drop into a deeper demand zone at the base (green zone).
Key Price Levels:
Resistance/Supply: 1.14153, 1.15205
Support/Demand: 1.12274, lower box near 1.11400
Possible Strategy:
Sell setup: Look for confirmation candles or patterns near the orange/brown zones.
Target: Previous demand zone or lower if structure breaks.
SL: Above the orange/red zone to manage risk.
Trend Lines

USDJPY InsightHello to all our subscribers,
Please share your personal opinions in the comments. Don’t forget to like and subscribe!
Key Points
- U.S. President Trump stated that if China does not negotiate, "the United States will make the decision and set the tariff rates," while White House spokeswoman Karoline Leavitt said, "Negotiations with China are going very well."
- Regarding Federal Reserve Chair Jerome Powell, President Trump said, "I have no intention of firing him, but I hope Chairman Powell will be more proactive about the idea of a rate cut."
- The Russian side explained that when the President mentioned the possibility of bilateral talks to ban attacks on civilian targets, it was with negotiations and discussions with Ukraine in mind.
This Week’s Key Economic Events
+ April 23: U.S. April Manufacturing PMI, U.S. April Services PMI
USDJPY Chart Analysis
Contrary to expectations, the pair showed a downward movement and formed a bottom around the 140 level. A rebound is occurring in this zone, suggesting the potential for a short-term rise. The 144 level is a likely target for the next peak. However, if the 140 level is broken downward, there is a possibility of a decline toward the 135–136 range.

Bitcoin short from 102k regionPreparing for short at around that region.
102k-105k is a short region for me. I will most likely exit 50% from the markets.
I think summer will be just like any other summer season. Bleed and not much volatility . Q4 2025 and Q1 2026 will most likely be bullish.
Lets see what markets will offer this year.


BNB Ascending Channel (1W)BINANCE:BNBUSDT remains within an ascending channel dating back to January 2024, with multiple strong reactions at both boundaries.
After testing the upper boundary and hitting a new ATH last December, it entered a clear downtrend (orange trendline) that led to multiple attempts at the channel's support.
Price action is now getting compressed, and we could see a breakout soon.
Key Levels
• To the upside, the main resistance remains ~$700 area.
• Above that, CRYPTOCAP:BNB could have a shot at a new ATH and potentially the channel's upper boundary in the ~$900 area.
• To the downside, in case of a channel breakdown, $400 seems the first logical support (important S/R for previous swings).
Still very uncertain and in a No-Trade Zone until a breakout is confirmed.

Babcock & Wilcox Stock Quote | Chart & Forecast SummaryKey Indicators On Trade Set Up In General
1. Push Set Up
2. Range Set up
3. Break & Retest Set Up
Notes On Session
# Babcock & Wilcox Stock Quote
- Double Formation
* Wave Feature | Completed Survey
* ((No Trade)) | Inverted Structure At 11.00 USD | Subdivision 1
- Triple Formation
* (EMA Settings)) + Downtrend Continuation | Subdivision 2
* (TP1) | Subdivision 3
* Daily Time Frame | Trend Settings Condition
- (Hypothesis On Entry Bias)) | Logarithmic Settings
- Position On A 1.5RR
* Stop Loss At 0.45 USD
* Entry At 0.25 USD
* Take Profit At 0.10 USD
* (Downtrend Argument)) & Pattern Confirmation (Inverted Structure)
* Ongoing Entry & (Neutral Area))
Active Sessions On Relevant Range & Elemented Probabilities;
European-Session(Upwards) - East Coast-Session(Downwards) - Asian-Session(Ranging)
Conclusion | Trade Plan Execution & Risk Management On Demand;
Overall Consensus | Sell

AUDNZD giving signs to start a bullish trendbullish divergence and price breaking trendline, these are some confluences that give a hint for a reversal trend, but one and most important factor to consider for a bullish trend is that if price breaks the marked LH, and for that I have also placed buy stop order on the chart with marked SL and TP

The Market Wins... For now... Let's talk CryptoIt seems that when I said in my previous videos "no matter what we want, Bitcoin can technically shoot up to a million tomorrow because that's just crypto", Crypto heard and said, "yeah, we'll do that". Kidding, we're not at a million nor will we be today or tomorrow. And at some point it will reverse because we need more demand for a sustainable push to new ATH's (peep 2021-2023 as I mention in this video). But at what point? Not for us to say until we start to see signs of tapering.
Once we broke out and consolidated out of our strong selling channel, we were given the heads up to be careful with our shorts - and with a certain amount of levels broken (i.e. FWB:88K ) I closed most of my short positions. But I do still have a HTF target at lower levels.
most importantly, we don't dictate to the market when it goes where. It decides on it's own and we wait for signals utilizing the algorithms and volume to guide us.
This is a long video because I don't have the "answers" as to why BTC is up 10%! But I still urge everyone to stay patient and cautious, either long or short, because in all markets there is clearly something being prepared for.
Happy Trading :)

EURUSD I Monday CLS I KL - Inverted OB I Continuation SetupHey, Market Warriors, here is another outlook on this instrument
If you’ve been following me, you already know every setup you see is built around a CLS range, a Key Level, Liquidity and a specific execution model.
If you haven't followed me yet, start now.
My trading system is completely mechanical — designed to remove emotions, opinions, and impulsive decisions. No messy diagonal lines. No random drawings. Just clarity, structure, and execution.
🧩 What is CLS?
CLS is real smart money — the combined power of major investment banks and central banks moving over 6.5 trillion dollars a day. Understanding their operations is key to markets.
✅ Understanding the behaviour of CLS allows you to position yourself with the giants during the market manipulations — leading to buying lows and selling highs - cleaner entries, clearer exits, and consistent profits.
🛡️ Models 1 and 2:
From my posts, you can learn two core execution models.
They are the backbone of how I trade and how my students are trained.
📍 Model 1
is right after the manipulation of the CLS candle when CIOD occurs, and we are targeting 50% of the CLS range. H4 CLS ranges supported by HTF go straight to the opposing range.
📍 Model 2
occurs in the specific market sequence when CLS smart money needs to re-accumulate more positions, and we are looking to find a key level around 61.8 fib retracement and target the opposing side of the range.
👍 Hit like if you find this analysis helpful, and don't hesitate to comment with your opinions, charts or any questions.
Disclosure: I am part of Trade Nation's Influencer program and receive a monthly fee for using their TradingView charts in my analysis.
⚔️ Listen Carefully:
Analysis is not trading. Right now, this platform is full of gurus" trying to sell you dreams based on analysis with arrows while they don't even have the skill to trade themselves.
If you’re ever thinking about buying a Trading Course or Signals from anyone. Always demand a verified track record. It takes less than five minutes to connect 3rd third-party verification tool and link to the widget to his signature.
"Adapt what is useful, reject what is useless, and add what is specifically your own."
— David Perk aka Dave FX Hunter ⚔️

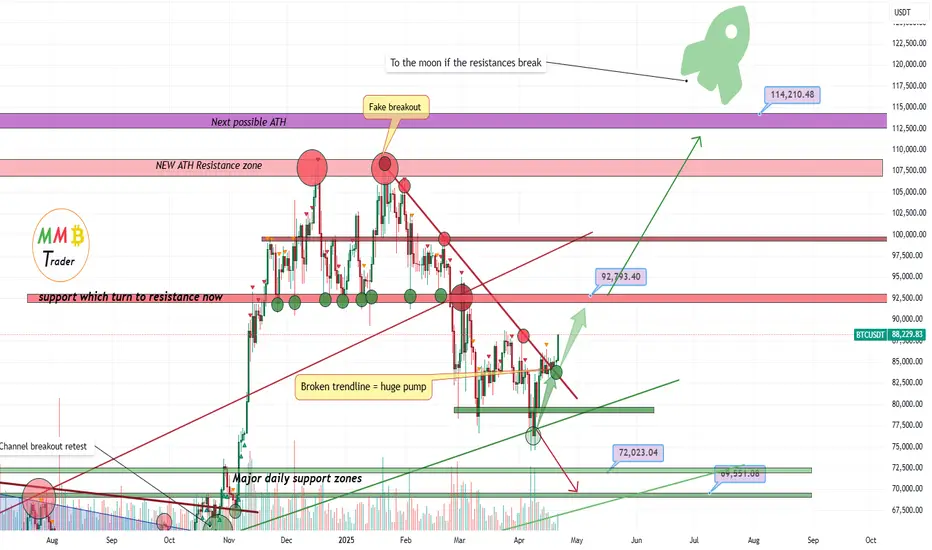
Bitcoin Broke falling trendline and retest complete= Heavy pump As we can see the red trendline is already broken and porice is going to test 92K resistance zone and soon after that the resistance there will also break and we are looking for bull market now again and rise and gain for Spots in upcoming weeks.
DISCLAIMER: ((trade based on your own decision))
<<press like👍 if you enjoy💚
EURUSD still has potential to go higherseems that the price will hit the trendline acting as resistance that has been intact for over 7 years. Currently, there is no major sign of reversal until price enters in marked area. So, it would be advised to look for buy setups on shorter time frames

USDCHF Swing UpdateUSDCHF has officially broken out of the 0.82485 consolidation zone. Based on structure and momentum, we could be seeing a deeper pullback toward 0.83366, which has been a key level historically and would make sense for retesting the bearish structure.
If price fails to reach that level or rejects sooner, I’ll be watching for continuation setups below 0.81394 and 0.80464. A clean break and retest of either would offer strong selling opportunities targeting 0.70517 for a longer-term swing setup.
Momentum remains bearish, so staying patient for high-quality entries is key.

Trading opportunity for KASUSDTBased on technical factors there is a Sell position in :
📊 KASUSDT
🔴 Sell Now
🪫Stop loss 0.11000
🔋Target 0.06767
📏 R/R 2
💸RISK : 1%
We hope it is profitable for you ❤️
Please support our activity with your likes👍 and comments📝

GER40 | 4H | SWING TRADING | BULL Hey there my friend
SIGNAL ALERT
BUY GER40 - 20,783,0 / 20,281,0
🟢TP1: 21,000,0
🟢TP2: 21,500,0
🟢TP3: 22,950,0
🔴SL: 19,298,5
RR - 20,797,0 - 1,50 / 20,281,0 - 2,97
Please don't forget to like 🙏🏻

Ethereum sell analysis/idea based on Supply & DemandBased on Supply & Demand trading, we have a Drop-Base-Drop in our downtrend move in the weekly timeframe, so I will start selling once the price reaches the supply base.

SELL GBPUSDThis is an opportunity to go short on this pair, lets get the pips and stay on a solid risk management plan.

Gold: Beware of the Impending Mid-to-Long Term Bearish Trend💥 Post-market surprise news shook the gold market:
About a week ago, Trump publicly hinted at “considering firing” Powell. But just after today’s market close, he suddenly walked it back, saying he “never thought about it.”
At the same time, he dropped signals of easing trade tensions — this combo crushed gold’s safe-haven sentiment, causing a gap-down open that nearly broke below 3300!
🗣 Looks like Trump might be happily trading gold himself! 😂
Now, gold has recovered most of that drop and filled the gap, so this round of quick rebound profits is mostly over.
📉 What’s next? Strategy outlook:
🔺 Short-term resistance to watch:
Key level at 3400
If broken, 3420–3440 is a strong short-entry zone
If price pushes further, consider scaling into shorts between $3440–3540, targeting $3268
🔻 Short-term support:
A gap still exists around 3313
If price fails to break above 3440, apart from shorting near 3420, watch for buying opportunities near 3300
📉 Mid-term view:
If gold climbs past 3440 again this week and holds, expect a mid-term correction
Mid-term targets: 3190–3128
A drop below 3000 is not out of the question — the rally from 2000 to 3500 is simply too steep!
🧭 In summary: The rebound opportunity is nearly over. Don’t chase blindly at these highs — the market is entering a highly volatile decision zone. We could be looking at bull traps followed by a meaningful correction.
🎯 Long positions — manage your rhythm!
If price shows signs of exhaustion or stalls in the 3400–3440 zone,
🔔 Take profits promptly to avoid giving gains back!
If a clear breakout fails, it’s time to switch back to shorts and follow the trend.

EUR/USD Bearish Setup Unfolding Below Key Resistance📊 Technical Analysis of EUR/USD (4H Chart)
🧭 Chart Overview:
Current Price: ~1.1350
Indicators Used:
EMA 50 (Red): ~1.1311 — acting as dynamic support.
EMA 200 (Blue): ~1.1114 — aligns closely with major support zone.
📌 Key Levels:
🔼 Main Resistance Zone: 1.1375 – 1.1400
Price has tested this zone multiple times, forming a potential double top pattern.
Strong bearish pressure observed each time price enters this area.
🔁 Minor Resistance (Retest Zone): ~1.1325 – 1.1345
Currently acting as a decision zone.
If price fails to hold above this level, it could turn into resistance on the next bearish leg.
🔽 Support Zone: 1.1100 – 1.1130
Converges with EMA 200 — making it a high-probability demand zone.
Potential target for the anticipated drop.
🧠 Price Action & Structure:
Market showed a strong bullish rally previously, breaking through resistance levels.
Now showing signs of exhaustion at the top.
Bearish scenario projected with a lower high forming below the main resistance, followed by a sell-off toward the support zone.
⚙️ Possible Scenarios:
Bearish Scenario (High Probability):
Price rejects the minor resistance → breaks below EMA 50 → continues lower to support.
Target: 1.1110 area.
Bullish Scenario (Low Probability):
Price reclaims and closes above 1.1375 with strong momentum.
Potential breakout and continuation toward 1.1450+.
🧩 Confluences Supporting Bearish Bias:
Lower high formation potential.
EMA 50 starting to flatten.
Failure to maintain momentum above main resistance.
Clean drop path toward 1.1110 if support breaks.
📉 Conclusion:
This setup favors short-term bearish movement, particularly if the price rejects around the 1.1345 level again. A breakdown below the minor resistance zone would likely trigger a sell-off toward the 1.1110 support, in line with the 200 EMA.

XAU/USD Target Achieved – $3,500 Successfully Hit 🔥 XAU/USD Target Smashed – $3,500 HIT! 🎯💰
Gold has officially reached $3,500, perfectly hitting our projected buy target!
This move confirms the strength of the bullish momentum and technical breakout setup.
🔹 Entry: Above $3,430
🔹 Final Target: ✅ $3,500 – Hit
🔹 Result: High-conviction setup delivered with precision
🔹 Trend: Remains bullish, but profit-taking expected at round number resistance
👏 Massive congrats to all who followed the plan — another clean win on XAU/USD!

BTC/USD Eyes $109K After Bullish Breakout!!🧠 Chart Type and Indicators:
Chart Type: Candlestick
Indicators Used:
EMA 50 (red line): 85,335.18
EMA 200 (blue line): 85,657.29
🔍 Technical Pattern Analysis:
Pattern Identified: Ascending Triangle
The price has formed higher lows (ascending trendline support) while repeatedly testing a horizontal resistance zone (~$88,000), forming an ascending triangle.
This is typically a bullish continuation pattern when it occurs after an uptrend, though in this context, it's forming after a consolidation, giving more significance to the breakout.
🚀 Breakout Confirmation:
The price has broken above the horizontal resistance and is currently trading at $92,766.51.
Volume is not visible but should be increasing during a valid breakout.
Both EMAs have been decisively breached to the upside, signaling momentum shift in favor of bulls.
🧩 Key Levels:
Support Zone (Post-Breakout Retest): ~$88,000
Previously a resistance zone, now likely to act as support.
Immediate Resistance: ~$96,000
Historical resistance zone shown on the chart with a horizontal black line.
Extended Target (measured move): ~$109,420
Based on the height of the triangle projected from the breakout point.
📈 Price Action Forecast:
Two possible scenarios (depicted with arrows on the chart):
Bullish Continuation:
A retest of the $88,000 zone followed by continuation to $96,000, then $109,420.
Short-Term Pullback:
Price may dip to retest the breakout zone (~$88,000), consolidate, then rally higher.
✅ Bullish Signals Summary:
Breakout from a bullish ascending triangle.
EMAs crossed and price holding above them.
Clear higher highs and higher lows formation.
Momentum suggesting further upside.
🧨 Risks to Watch:
False Breakout Risk: If the price fails to hold above $88,000 and falls back into the triangle range.
Macro Factors: Bitcoin remains sensitive to macroeconomic news and regulations that could disrupt technical setups.

Can the 3370 support level turn the tide?The Asian session low of 3413 rebounded to 3500 under pressure, and then fell back to 3370 in the evening, with a single-day fluctuation of more than 100 points. Since the 14-day bull market started at 2959 on April 7, the gold price has soared 500 points, and the short-term overbought has triggered technical correction pressure. The current market presents a strong pattern of "buying on every correction", and even if there is a long upper shadow, the bullish sentiment still dominates the market.
From a technical perspective, the support near 3370 is crucial. If it holds, the bullish trend will continue; otherwise, a break may trigger a deeper adjustment. Although there is short-term profit-taking pressure, the overall market is bullish. It is recommended to pay attention to the key support level of 3370 and be alert to low-long opportunities in repeated fluctuations.

Gold intraday high V reversal looks to continueToday's market analysis and interpretation:
First, the gold daily level: After closing with a full increase of 100 US dollars yesterday, it continued to rise by nearly 90 US dollars today. The daily line may not feel the acceleration, but from the weekly line, the trend of continuous large positives for nearly three weeks and an increase of more than 500 US dollars, it seems to be accelerating to the top; although the overall bullish trend this year will not be affected at all, in the short term, some bulls may flee due to the accelerated pull, that is, profit-taking, which is often more likely to happen; In addition, yesterday's research report focused on interpreting the trend of 2956 to 3500. It is very likely to cycle the previous wave of 2832 to 3167. The maximum retracement of 618 division position just confirms the previous top and bottom support of 3167. In addition, from the wave shape, if 2832-3167 belongs to the first wave, 3167 to 2956 belongs to the second wave, and the third wave is calculated by 1.618 times the first wave, it is exactly 3498, which is today's intraday high of 3500. Then the fourth correction wave may be brewing in the follow-up, which is generally the third wave 382 or 50 division, and it generally will not fall below the first wave high of 3167. Therefore, in the next few days, if 3500 cannot be broken through again, the correction will focus on the 382 division support 3292 and the 50 division support 3228. The limit is that it is unlikely to fall too far from 3167, and then Waiting for the opportunity of band bullishness, each squat adjustment is to further continue the bullish trend;
Second, gold 4-hour level: the current MA5-day moving average support is barely holding up temporarily, and the top is a bearish pattern of "evening star" with a large Yin wrapped in Yang. It needs to be combined with the subsequent K-line pattern. If there are continuous Yins and large Yins continue to appear, then this cycle will begin to be under pressure, and the MA10-day support of 3428 and the middle track of 3378-72 will be gradually tested below;
Third, gold hourly level: Asian session continues to rise sharply, but the European session suppresses the 3500 line and falls back, temporarily supporting the middle track. The inability of the European session to attack increases the risk of further downward adjustment tonight; once the middle track is effectively lost, it will continue to fall. Finally, tonight, we can gradually see the 66-day moving average, which is also the lower track of the white channel in the figure, about 3380; The short-term resistance is the 10-day moving average and the white channel counter-pressure point, concentrated at 3470-3480, which happens to be the 618 division point of the European session's decline and rebound; therefore, pay attention to 3470-3480 tonight. If it cannot withstand the pressure, it will continue to decline and gradually look at 3428 and 3411. The strong support is in the range of 3380-3370 tonight. If it stabilizes here, it will rebound to confirm the middle track, and the ups and downs will be huge.

USDCHF Daily, H4,H1 Forecasts, Technical Analysis & Trading IdeaMidterm forecast:
0.84000 is a major resistance, while this level is not broken, the Midterm wave will be downtrend.
OANDA:USDCHF
Technical analysis:
A trough is formed in daily chart at 0.80385 on 04/21/2025, so more gains to resistance(s) 0.83314 and maximum to Major Resistance (0.84000) is expected.
Take Profits:
0.83314
0.84000
0.85430
0.86286
0.87550
0.89147
0.90367
0.92218
0.94400
__________________________________________________________________
❤️ If you find this helpful and want more FREE forecasts in TradingView,
. . . . . . . . Hit the 'BOOST' button 👍
. . . . . . . . . . . Drop some feedback in the comments below! (e.g., What did you find most useful? How can we improve?)
🙏 Your support is appreciated!
Now, it's your turn!
Be sure to leave a comment; let us know how you see this opportunity and forecast.
Have a successful week,
ForecastCity Support Team
