EURJPY is in the Sell Trend after testing Lower HighHello Traders
In This Chart EURJPY HOURLY Forex Forecast By FOREX PLANET
today CADJPY analysis 👆
🟢This Chart includes_ (EURJPY market update)
🟢What is The Next Opportunity on EURJPY Market
🟢how to Enter to the Valid Entry With Assurance Profit
This CHART is For Trader's that Want to Improve Their Technical Analysis Skills and Their Trading By Understanding How To Analyze The Market Using Multiple Timeframes and Understanding The Bigger Picture on the Charts
Trend Lines

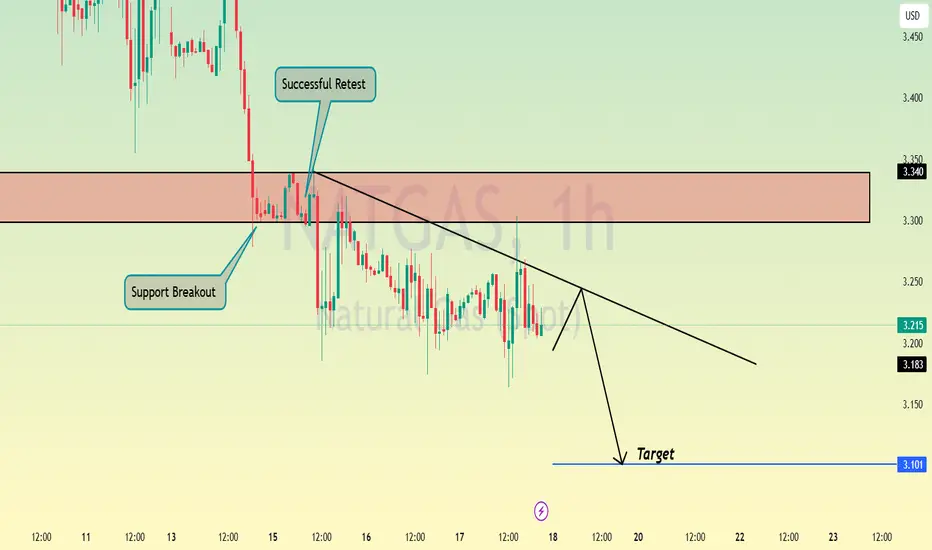
The Natural gas will make a dip once againNATURAL GAS H1 Analysis 📊
First of all , lets take about the gap
war , This gap is due to war and as you know market will refill it sooner or later , thats the main reason of the selling
Yes, no doubt , the market can go up for some sl hunting thats why the red zone is little wider
The ultimate trend is sell due to no investors in gas because all the investors are busy in the BITCOIN AND GOLD. so it will come back at its lowest support sooner or later
Follow the money management strictly and this is just the prediction.
The GBPCAD is Unstoppable due to Strong Up TrendGBPCAD H4 Analysis 📈
NZD AND AUD are linked with each other not directly but indirectly.
That's why if AUD weak then NZD is also weak and now as you can see these 4 pairs are going up without any retracement.
The pair is moving in a similar way like GBPAUD.
The red zone is a support zone a and last the the market was pumped from the same zone.
If The markets holds on the red zone or holds above the red zone , it will be a confirmation of buy .
If the markets breaks the red zone in the downside direction then but setup is no more valid.
The pair is looking to retest its higher resistance points according to the Weekly time frame.

Crude Oil Breaks Out — Is $65.5 the Next Wall?Price started its bullish move in the first week of April, and since then, it’s been making higher lows. Today’s candle broke cleanly above a key trendline, and price is now heading toward the $65.5 resistance, which could act as a critical decision zone.
Key Levels:
- Support: Around $63.2
- Resistance: $65.5 (next major wall)
- Setup: Trendline Breakout
What I’m Watching:
When price gets to 65.5, I’ll be looking for:
- A strong breakout (maybe even retest + continuation) to hold my buy
- Or a clear rejection to scale out or re-evaluate
I’m staying patient. I’ve picked my setup and I’m sticking to it — no jumping around. Let’s see how this plays out.
Cheers!
pClem Trades

Dollar Tree | DLTR | Long at $67.00Dollar Tree NASDAQ:DLTR has taken a massive hit to its stock price as low-income spenders are cutting back (recession red flag, anyone?). It recently touched my selected "crash" simple moving average area (white lines on the chart) and may take many years before true recovery occurs. However, the Director recently bought $150k+ in shares after this recent drop, showing confidence in the company as a whole. I don't think we'll see all-time highs again for some time, but I believe at $67.00 there is a longer-term opportunity into 2026 and beyond. This does not mean I feel the bottom has occurred yet. I wouldn't be surprised if it hits around the $50.00 mark with more bad economic news. No one truly knows. But, I personally choose to position build over time while using charts and fundamental information. At $67.00, NASDAQ:DLTR is in a personal buy zone. If it drops further and fundamentals don't nosedive, more shares will likely be added.
Target #1 = $81.00
Target #2 = $88.00
Target #3 = $94.00

Place long orders after the adjustment is over!After gold accelerated its rise in the Asian session, it fell back in the European session and temporarily entered an adjustment cycle, accumulating strength to provide power for the next round of launch. The short-term support in the US session is 3430 and 3412. In terms of operation, go long according to the strength of the decline. There is still no guess on the top, and gradually look to 3480 and 3500! Short-term volatility has increased, and the notice has been issued before the market!
Operation suggestion: Gold is long near 3410-15, and look at 3445 and 3455!

Gold's retracement is an opportunity to go longStay long and don't relax. Continue to buy gold when it falls back!
The gold market has fluctuated violently recently, with a rise of $100 and a fall of $90, which has brought great obstacles to our trading. Long and short positions with bad entry positions will be washed out, so we need to wait patiently for opportunities in operation. The strong market remains unchanged. Continue to buy when it falls back. Find the watershed position to participate in the transaction. It is better to miss it than to be too aggressive. In the Asian session, I will share with you the support of the 3405/3410 watershed of gold. I will rely on this position to buy when it falls back. Gold hit a high of 3499 during the day, which is one step away from 3500. The European and American sessions fell back by $90, which just happened to fall back to the watershed position shared with you in the Asian session. The long orders have also been realized at the target position. Friends who have participated should pay attention to protecting profits, and friends who are short should wait patiently for opportunities and not be too aggressive!

XAU/USD: Trend Remains Strong as Price Holds Above Key SupportThe XAU/USD market continues its impressive rally, recently reaching a new all-time high at 3500 before pulling back toward support and the previous day's high. The price action completed an ABC structure prior to this retracement.
Currently, the market may be forming a triangle or flag pattern, similar to past consolidation setups. As long as the price remains above the upward trendline and the critical 3400 support level, the probability of a trend continuation remains high. A retest of the ATH level followed by a move higher is likely, with the next target at the resistance zone around 3520

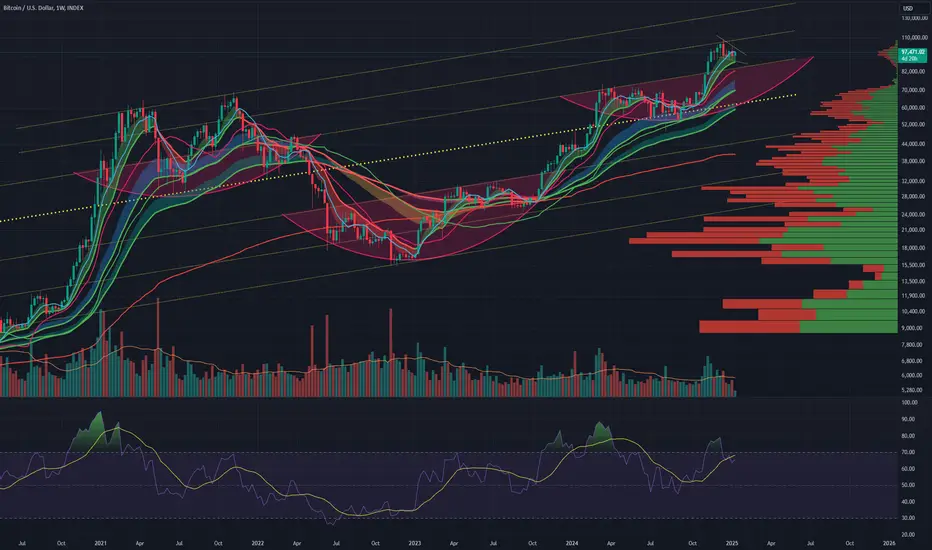
The Big (BTC) Short*please note that this chart has been "flipped" so is upside down.
It's difficult to ignore the number of indicators and chart patterns that are signalling a move up for Bitcoin:
- Bullish div in daily RSI
- Oversold daily RSI
- Breakout of downtrend (both RSI and chart pattern)
- Near-touch of the previous ATH
Etc
HOWEVER this idea is a "what-if-everyones-wrong" hedge. We've already seen a break in the uptrend that was in play since Oct 23 so it is feasible that if we break through again we could see a significant move down to the sound of -30% which would re-test the 618 fib and is a liquidity-rich Zone.
Entry @ 94K (which ironically is also the 618 measuring from ATH to the local trough @ 74.5K) which coincides with the random "pump" we saw on Sunday 2nd March. I think the crypto God's are telling us something with this particular price point/wick.
Estimated flight time is roughly 2 months (back end of June).

Macro $BTC Trend - Weekly IH&SZoomed out view of BITSTAMP:BTCUSD on weekly view. Macro inverted head and shoulders with a falling wedge. Chart also has previous trend channels.
On a macro basis, I think this is bullish. My guess is that we might get rejected by the 8 week VWAP and retest the prior trend line at ~$88k.
However... I could also see this getting momentum and breaking out of the falling wedge. I tend to err on the side of caution here and with an election about to happen, I don't plan on scaling back in until ~February.
Keeping a close eye on this one. If it does breakout of the wedge to the upside, it should be a very quick move to the $130k+ range.
GBPUSD is in the Selling DirectionHello Traders
In This Chart GBPUSD HOURLY Forex Forecast By FOREX PLANET
today GBPUSD analysis 👆
🟢This Chart includes_ (GBPUSD market update)
🟢What is The Next Opportunity on GBPUSD Market
🟢how to Enter to the Valid Entry With Assurance Profit
This CHART is For Trader's that Want to Improve Their Technical Analysis Skills and Their Trading By Understanding How To Analyze The Market Using Multiple Timeframes and Understanding The Bigger Picture on the Charts

Gold hits all-time highTechnical Analysis
Gold prices hit an all-time high near $3,500 earlier Tuesday, consolidating a strong uptrend. This latest surge, which has surpassed 10% in just over a month, follows rapid gains from $3,126 to $3,498. Currently, the bulls are maintaining their dominance.
Looking at historical price action, every significant rise in gold has been followed by a period of profit-taking. Therefore, a short-term correction is expected. Furthermore, a break above $3,417 could trigger a deeper correction, which warrants caution.
Trading Recommendations
Trading Trend: Sell
Entry Price: 3,438
Target Price: 3,235
Stop Loss: 3,534

XRP looks perfectly coiled up.If this fails and breakdown
I’ll be very surprised!
XRP has held 2.00 as a great support now it’s just all about patience.

StoneCo May Have Turned HigherStoneCo has been stuck in a range since crashing in 2021, but some traders may think it’s turning back to the upside.
The first pattern on today’s chart is the series of lower highs since early last year. Prices have apparently broken that falling trendline.
Second, the Brazilian fintech jumped on a strong quarterly report last month and continued higher after a pullback. That could reflect improved fundamentals.
Third, the 8-day exponential moving average (EMA) is above the 21-day EMA. MACD is also rising. Those signals may be consistent with a short-term uptrend.
Fourth, the 50-day simple moving average (SMA) is nearing a potential “golden cross” above the 200-day SMA.
Finally, Latin American stocks have outperformed in recent weeks. Brazil, in particular, has seen economic growth forecasts increase.
TradeStation has, for decades, advanced the trading industry, providing access to stocks, options and futures. If you're born to trade, we could be for you. See our Overview for more.
Past performance, whether actual or indicated by historical tests of strategies, is no guarantee of future performance or success. There is a possibility that you may sustain a loss equal to or greater than your entire investment regardless of which asset class you trade (equities, options or futures); therefore, you should not invest or risk money that you cannot afford to lose. Online trading is not suitable for all investors. View the document titled Characteristics and Risks of Standardized Options at www.TradeStation.com . Before trading any asset class, customers must read the relevant risk disclosure statements on www.TradeStation.com . System access and trade placement and execution may be delayed or fail due to market volatility and volume, quote delays, system and software errors, Internet traffic, outages and other factors.
Securities and futures trading is offered to self-directed customers by TradeStation Securities, Inc., a broker-dealer registered with the Securities and Exchange Commission and a futures commission merchant licensed with the Commodity Futures Trading Commission). TradeStation Securities is a member of the Financial Industry Regulatory Authority, the National Futures Association, and a number of exchanges.
TradeStation Securities, Inc. and TradeStation Technologies, Inc. are each wholly owned subsidiaries of TradeStation Group, Inc., both operating, and providing products and services, under the TradeStation brand and trademark. When applying for, or purchasing, accounts, subscriptions, products and services, it is important that you know which company you will be dealing with. Visit www.TradeStation.com for further important information explaining what this means.

GOLD (XAU/USD) Breakout Watch –Bullish Continuation or Pullback?🔍 Instrument Analysis: XAU/USD (Gold vs USD)
Timeframe: Likely 1H or 4H (based on candle structure)
Indicators:
EMA 50 (Red) – Current value: 3,365.25
EMA 200 (Blue) – Current value: 3,248.04
📈 Current Market Structure
Price: Trading at 3,433.62, in a strong uptrend with higher highs and higher lows.
Trend: Bullish, supported by price trading above both the 50 EMA and 200 EMA.
Key Zones:
Immediate Resistance: ~3,430 - 3,440 zone (currently being tested).
First Support Zone: ~3,315 - 3,330
Second Support Zone: ~3,250 - 3,270
🧠 Scenario Analysis
✅ Bullish Scenario (Primary Bias)
Price is attempting a break and retest of the resistance zone.
If a successful retest confirms it as support, next upside leg could target 3,480+.
Bullish continuation is favored as long as price holds above 3,385 (recent breakout level).
⚠️ Bearish Scenario (Secondary Bias)
If price fails to hold above 3,385, we may see a pullback to:
3,315 - 3,330 support area (reaction likely due to proximity to EMA 50).
A deeper retracement toward the 3,250 zone, aligned with EMA 200, which would be a critical level for bullish continuation or breakdown.
📊 EMA Insight
EMA 50 > EMA 200: Confirms bullish momentum.
The slope of both EMAs is upward, reinforcing current upward trend.
A test of the EMA 50 may offer a buy opportunity if structure holds.
🔔 Trade Outlook
Bullish bias remains intact above 3,385.
Look for bullish price action confirmation (bullish engulfing, pin bars, etc.) on retest of resistance-turned-support.
Monitor volume/activity around 3,385-3,400 for potential rejection or continuation clues.


XRP bullish scenarioLong position
Entry 2.10
TP 6.5
SL 2.0
Breaking out of daily RSI downtrend 📈
Believe that $3 price point has significance. Huge move up Sun 2nd March - believe that is a signal.
Anticipate $3 to act as resistance, bounce up from the downtrend (approx 10th May), re-test all time high and then flip $3 into support. Upper target $6.82 however setting $6.5 TP for safety.
Bitcoin breaking above GETTEX:89K could be a trigger for a move up across alts including XRP.
Really tight stop loss as we are currently 0.02 away from flagging a red weekly candle. Recommend that if the uptrend breaks then flip to short with TP @ $1.30

KIMSKIMS has given inverted H&S breakout with decent volume. The depth is around 28-30% from neckline to bottom of the head. So if we add it to breakout line then we may see the same move on upper side. If we look at weekly timeline then also it has given resistance breakout. Seems very promising.

The bull market is extremely strong! Keep the rhythm right!Analysis of gold trend:
On Tuesday (April 22) in the Asian session, spot gold continued to rise. Fundamentally, on Monday, as Trump's comments on Powell damaged investors' confidence in US assets, the US dollar index plummeted to its lowest level since March 2022. The United States plans to impose new tariffs on solar products imported from four Southeast Asian countries. Trump's approval rating has dropped to the lowest level since returning to the White House. The market's risk aversion has increased, and gold prices have strengthened significantly. At present, global trade tensions will continue, and concerns about economic growth and inflation expectations will continue to support gold prices.
After rising to around $3,430 at the beginning of the week, the price of gold retreated slightly to around $3,406. Before the close, it was more of a shock operation at the high of the day. Including the idea given before the break at the beginning of the week, the price of gold will continue to break new highs on Tuesday. But it was not expected that the price of gold would rise to around $3,500 during the Asian session, which was indeed a bit unexpected. At the end of the Asian session, the price of gold retreated, retreating to around $3,461. This retracement came relatively late, breaking the normal operation system. Today, it is recommended to refer to the suppression range near 3490 US dollars and 3500 US dollars for shorting. If it breaks above, refer to the daily error band indicator near 3510 US dollars for shorting. If it breaks below, refer to the support near 3455 US dollars and 3444 US dollars for longing. If it breaks below, look at the 3437-3390 US dollars range for high selling and low selling.

The ultimate safe-haven gold price will not fall! Keep bullish!Remember that gold is currently the ultimate safe-haven asset. Any pullback is actually an opportunity for you to get on board. Before the current trade war eases, gold is still the most favored asset in the market. A year ago, people thought that it was not outrageous for gold to rise to $5,000 by 2030; now, this prediction has become "conservative".
Fundamentally, this is because the current rise in gold is a performance as a "monetary asset" rather than a "commodity asset". This redefinition of gold's "identity" - especially under the catalysis of major events in the past few weeks - has also triggered people's deep thinking about the future role of gold in the international monetary system. It may be moving towards a new positioning: the ultimate safe-haven asset.
The current retracement of gold has given you an opportunity, so don’t hesitate to enter the market directly at 3440-3450 for long orders, and buy directly at 3455-60 radically, and continue to watch the upward break to new historical highs!

USDCHF: One More Bearish Wave Ahead?! 🇺🇸🇨🇭
It looks like USDCHF has successfully completed a consolidation
after quite an extended bearish rally.
A breakout of a support line of an ascending triangle pattern
on a 4H time frame provides a strong bearish confirmation.
We can expect a movement down at least to 0.81 level.
❤️Please, support my work with like, thank you!❤️
I am part of Trade Nation's Influencer program and receive a monthly fee for using their TradingView charts in my analysis.

GOLD → Correction after reaching 3500. What's next?FX:XAUUSD updates high to $3,500 amid Trump's attacks on the Fed, we are still in the aggressive trend phase. North train makes a small stop which may give us a chance to trade...
Investors are fleeing to safe-haven assets amid an escalating US-China trade war and Trump's verbal attacks on Fed chief Powell.
Trump is blaming the Fed for the slowing economy and demanding immediate rate cuts, which is undermining confidence in the dollar and boosting demand for gold.
3500 is a psychologically important target and once it is reached, traders have moved to profit-taking, which could lead to a small correction...
Resistance levels: 3475, 3500
Support levels: 3441, 3408, 3385
As part of the correction, the price may test 3440, or 3410. The trend is aggressively bullish and sales should not be considered. The ideal scenario would be liquidity capture relative to 3410 and rebound or continuation of growth, as the fundamental background is on the side of gold....
Regards R. Linda!

Gold bulls are unstoppableGold is now too strong, and the rise is not going to end. It continues to rise. Before the gold daily line reverses at a high level, the decline is just an adjustment, not a reversal. However, everyone should also pay attention to the reversal of the high level of the market at any time. Once the situation is not right, you must withdraw in time. With such a violent rise, if the market reverses next, it will also be very rapid.
Go long gold 3460-70, target 3495-3500.
