Selling America - Buying EUThis is a long term trend analyzing the US market from the perspective of foreign investors. Not valuing the S&P500 500 in USD. Instead, valuing the S&P500 in multiplies of the European Stoxx 600. A multi-year trend of the US outperforming the EU has been broken.
Trend Lines

US CRUDE OIL (#WTI): Intraday Bullish ReversalUSOIL reached a significant level of support last week and formed an inverted head and shoulders pattern before bouncing back and breaking through a strong downward trend line.
This indicates strong buying pressure and suggests that the market may continue to rise. The next resistance level for to watch is at 65.32.

Gold Hits Fibonacci 3.618! What’s Next?GOLD (XAU/USD) Quick Analysis – April 2025
Gold just surged to $3,329/oz, reaching the Fibonacci 3.618 extension around $3,338 🚀
The trend remains strongly bullish, but the price is now extended far above key moving averages – signaling potential exhaustion.
Key Levels:
Support: $2,856 (Fibo 2.618)
Next Resistance: $3,635 (Fibo 4.236)
🧭 Outlook:
As long as price holds above $2,856 → the bullish structure remains intact
🎯 Strategy:
Wait for a healthy pullback → buy the dip near support
Or enter on a breakout-retest above $3,338 for potential continuation

Gold at strong resistanceGold now has reached to a very strong resistance at about 3350 which is a trend line in the past and can work as a strong resistance now

TRXUSDT (TRON) End of correction and Bullish Starting PointBased on the presented chart, it is observed that TRON is undergoing a corrective phase. This correction may extend to the level of 0.2421. It is anticipated that after reaching this level, a new upward trend in TRON's movement will commence

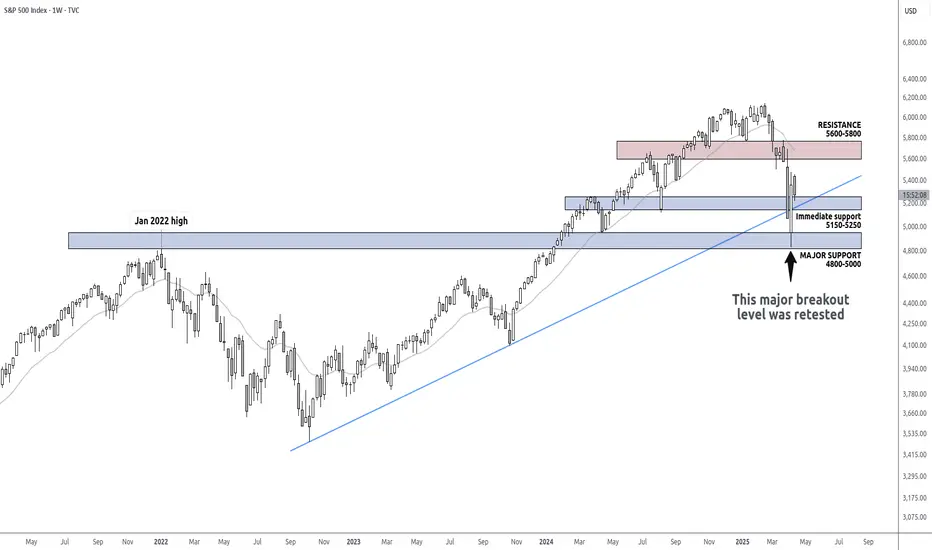
Could be a good time to build a longer term SPX long Potentially good reward:risk here for investors / longer timeframe swing traders or position traders
Last week was a big test for the SPX index - it tested two crucial supports
1) Retest of the 2022 highs
2) Retest of the major trendline which has held the trend for around 2.5 years now
It looks like buyers came in strong at support giving us a big bullish candle - likely forming a capitulation low.
Major pullbacks like these come only a few times a year - and if managed well can be good R:R trades.
For investors/position traders:
If the low from last week holds, any pullbacks into 5250 or lower seem like a good time to add - for a longer term hold for a few months or even a few quarters.
For traders wanting to see some clear momentum first:
The most important resistance up above is the 5600-5800 area & the 20w ema (which aligns with it currently). You might want wait for a clean reclaim of this resistance first. For investors, you could think of adding to your buys once this resistance is reclaimed strongly.
TLDR;
SPX might have capitulated
This is a decent area to start buying for a longer term hold - targeting the prior highs first and holding some into price discovery
Invalidation: if a weekly candle closes below the recent low
When to observe PA closely: test of the 5600-5800 resistance / 20w ema
GBPUSD InsightHello to all our subscribers.
Please feel free to share your personal opinions in the comments. Don’t forget to hit the booster and subscribe!
Key Points
- U.S. President Trump stated via Truth Social that he would personally participate in negotiations with Japan.
- President Trump signed an executive order on "Ensuring National Security and Economic Resilience through Trade Expansion Act Section 232 Investigation of Processed Critical Minerals and Derived Products," which suggests the possibility of future tariffs on minerals.
- The World Trade Organization (WTO) announced that global trade volume could decrease by up to 1.5% this year due to President Trump’s tariff policies. For the U.S., exports are expected to fall by 12.6% and imports by 9.6% compared to last year.
- Federal Reserve Chair Jerome Powell stated during a speech at the Economic Club of Chicago that “the larger-than-expected tariff hikes could create a dual impact of rising inflation and slowing growth.”
Major Economic Events This Week
+ April 17: ECB Interest Rate Decision
+ April 18: Easter
GBPUSD Chart Analysis
After a sharp rally from the 1.27000 level, the pair formed a high around the 1.33000 level. As there is still no major resistance, the uptrend may continue in the short term, with a projected high around the 1.34000 level. However, a failure to break this resistance could lead to a short-term decline toward the 1.31500–1.32000 range.

Silver Bulls Breaks Resistance, Eyes on $34.57 RetestThe upside risk we flagged earlier this week has now materialised for silver, with the spot price staging a bullish break above the 50-day moving average, resistance at $32.73, and the December 2024 uptrend on Wednesday.
Having closed above this former resistance zone, it may now provide a base for fresh longs targeting a retest of the March 28 swing high at $34.57. Levels to watch in between include Wednesday’s high at $32.16 and $33.50 which acted as support around the turn of the month. A stop loss beneath the uptrend would offer protection should the trade move against you.
While momentum indicators remain more neutral than outright bullish, the bias is to the upside following the breakout and ongoing trends in RSI (14) and MACD.
Good luck!
DS

SHORT XRP/USDT🔥 #XRP/USDT
🔴 SHORT
🎲 Entry Zone: 2.1110
✅ Take Profit 1: 2.0675
✅ Take Profit 2: 2.0242
✅ Take Profit 3: 1.9545
✅ Take Profit 4: 1.8867
(Extended if Momentum Persists)
❌ Stop Loss: (A Strong Close Above 2.2100 Invalidates the Short Setup)
💱 Recommended Margin: 2.5% - 5%
🧳 Recommended Leverage: 5X - 15X
⚠️ Take Care of Risk Management for Your Account

GOLD → If you didn't catch the train, what should you do?FX:XAUUSD in a rally. Running into a train that is already in motion is prohibited due to the lack of ability to calculate risks. Ahead of the news, a correction is possible, which will allow us to find a place to trade
Gold continues to update an all-time high on the back of expectations of retail sales in the US and the speech of Fed chief Powell. Price growth was supported by strong data from China, increased demand for “protective assets” due to geopolitical tensions and trade risks between the U.S. and China. Additional support was provided by forecasts of gold price growth from ANZ to $3,600 by the end of the year
Technically, the psychological zones of interest 3325 - 3350 are ahead, from which a correction may form. The ideal scenario is to wait for a correction to local or intermediate support levels and only there look for an entry point.
Resistance levels: 3318, 3335, 3350
Support levels: 3275, 3265, 3244
On the background of a strong bull market it is worth using as a productive strategy to trade on the breakdown of resistance in order to continue growth, but in this case we need to wait for consolidation, we do not have it.
Or wait for correction, support retest and only then consider buying.
Regards R. Linda!

NZDUSD → Is there a chance for continued growth?FX:NZDUSD within the framework of the rally, which is associated with a strong decline in the dollar, is exiting the ascending channel and testing the resistance at 0.5922.
Against the backdrop of the falling dollar, which is associated with economic factors, the New Zealand has good chances to continue to grow. Consolidation of the currency pair above the level will indicate the readiness of the currency pair to continue to grow.
But! Today is quite a day full of economic news. Traders are waiting for Core retail sales & retail sales, as well as Powell's speech at 17:15 UTC. High volatility is possible!
Resistance levels: 0.5922, 0.6038
Support levels: 0.5853
A small correction may be formed from the resistance, but another retest and price consolidation above 0.5922 may be a good signal for both the bulls and us to make decisions. The currency pair has all chances to reach 0.6000
Regards R. Linda!

GBPCAD → False breakdown, where do we go from here?FX:GBPCAD is forming a false breakdown of trend support. Against the backdrop of the falling dollar, the pound sterling went into the rally phase, which is favorable for the currency pair.
The fundamental situation is in favor of GBP and CAD against the dollar, which continues its rapid decline.
As part of the correction, the currency pair forms a test of support without the opportunity to continue the downward movement. The maneuver ends with a false breakdown and consolidation above the level (inside the channel). The currency pair may continue the uptrend if the bulls hold the defense above 1.8144 - 1.823
Support levels: 1.81500, 1.79788
Resistance levels: 1.8233, 1.83796
Accordingly, based on the fact that we have an uptrend, a strong currency pair (on the background of a weak dollar) and a false breakdown of support, we can say that the price is not allowed down and it is worth considering an attempt to continue the uptrend.
Regards R. Linda!

Alibaba - Don't Forget Chinese Stocks Now!Alibaba ( NYSE:BABA ) still remains super interesting:
Click chart above to see the detailed analysis👆🏻
After we saw the very expected parabolic rally on Alibaba about four months ago, Alibaba is now perfectly retesting major previous structure. Yes, we could see a short term pullback in the near future but this just offers a perfect break and retest after the rounding bottom pattern.
Levels to watch: $110, $140
Keep your long term vision,
Philip (BasicTrading)

Trend Support and 18M AVWAP: Our Final Stronghold📜 Field Orders – Operation: Defensive Line
Troops, listen up.
We’re falling back to our key defenses—Trend Support and the 18M AVWAP.
Hold your ground.
Do not charge.
We wait.
🎯 Your Orders:
Stand down unless support is broken cleanly with force.
If the red army pushes through and confirms—join the short side.
Enter only with structure, never emotion.
Protect your treasures—capital is your ammunition. Don’t waste it fighting in the chop.
If this is a trap, and you’re caught in it—retreat immediately.
Take the loss. Regroup. Redeploy with strength and clarity.
If we bounce here—watch for signs of a counteroffensive near the AVWAP wall.
But again—only enter with confirmation. Not hope.

Cat's in the CradleHey Guys!! Here's one for you that you are going to Like
Let's Aim for a ~50% profit, on This one...
($22---->30 )
double-bottom,Trend Channel
Clearly defined Support-and-resistance Touch points.
Cheers!
And the cat's in the cradle and the silver spoon
Little boy blue and the man on the moon
"When you comin' home, Dad?"
"I don't know when, but we'll get together then
You know we'll have a good time then"

23400 is here but weekly candle is yet to close! As we can see NIFTY did manage to close itself above 23400 level showing signs of bullishness but this level has acted as a strong support previously and hence expected to act as a strong resistance. Hence we must wait for a weekly candle to close above 23400 level for confirmation for further upmove else our view is bearish and can result in good fall as the gap has already been filled and can result in sharp fall as it is already trading in strong supply zone so plan your trades accordingly and keep watching.

Gold Will be Bullish from a Historic Support LevelHello Traders
In This Chart GOLD HOURLY Forex Forecast By FOREX PLANET
today Gold analysis 👆
🟢This Chart includes_ (GOLD market update)
🟢What is The Next Opportunity on GOLD Market
🟢how to Enter to the Valid Entry With Assurance Profit
This CHART is For Trader's that Want to Improve Their Technical Analysis Skills and Their Trading By Understanding How To Analyze The Market Using Multiple Timeframes and Understanding The Bigger Picture on the Charts

GHST/USD Cryptocurrency Quote | Chart & Forecast SummaryKey Indicators On Trade Set Up In General
1. Push Set Up
2. Range Set up
3. Break & Retest Set Up
Notes On Session
# GHST/USD Cryptocurrency Quote
- Double Formation
* (EMA Settings)) On (A+ Set Up)) | Completed Survey
* (Reversal Argument)) At 325.00 USD Indexed To 100 | Subdivision 1
- Triple Formation
* (Flag Structure) & Retest Area | Subdivision 2
* (TP1) | Subdivision 3
* Daily Time Frame | Trend Settings Condition
- (Hypothesis On Entry Bias)) | Indexed To 100
- Position On A 1.5RR
* Stop Loss At 40.00 USD
* Entry At 33.00 USD
* Take Profit At 20.00 USD
* (Downtrend Argument)) & Pattern Confirmation
* Ongoing Entry & (Neutral Area))
Active Sessions On Relevant Range & Elemented Probabilities;
European-Session(Upwards) - East Coast-Session(Downwards) - Asian-Session(Ranging)
Conclusion | Trade Plan Execution & Risk Management On Demand;
Overall Consensus | Sell

XAU/USD: All-Time High Reached with Pullback Opportunity AheadThe XAU/USD market has set a new all-time high, continuing its strong bullish trajectory toward the 3300 resistance zone. This level may act as a potential reversal point, offering a chance to enter on a pullback.
A range zone has formed around the 3225 level, which, along with the nearby upward trendline, could serve as a key support area for identifying buy signals. With high-impact news scheduled for today, volatility is expected. Should a retracement occur, the support zone around 3225 may provide a launchpad for the next move toward the resistance zone at 3390

EUR/NZD: Bullish Structure Intact After Pullback to Key SupportThe EUR/NZD pair has completed an ABC pullback toward the support zone and channel boundary, recently bouncing off the psychological level at 1.91000, which has shown to be a significant area of strength.
On higher timeframes, the market continues to post higher highs and higher closes, confirming a bullish long-term trend. While the recent retracement suggests a possible consolidation phase, the price is expected to retest at least 50% of the pullback range, with potential to climb even higher. If it holds above the 1.9000–1.9100 support zone, the probability of a resumed upward move remains strong. The next target is the resistance zone around 1.96700

GBPUSD 5th wave upLooks like we should be expecting one move up to complete this cycle then we will have a correction to correct the whole bullish cycle.
BNB/USDT: Key Support Zone Holds Potential for Bullish ReversalThe BNB/USDT market recently bounced from the 560 support level, a notable swap zone that has acted as a key turning point in past price action. The current pullback from the downward trendline appears to be directing price back toward this historically significant support area.
On the weekly timeframe, a bullish candle has formed, while the daily chart shows a pattern of higher lows, pointing to growing buying pressure. If the price revisits the 550–560 zone, a bounce is likely, potentially sparking a bullish move. With technical signals aligning across multiple timeframes, this zone stands out as a prime area of interest. The next target is the resistance zone around 613

Apple – More Pain to come? Apple’s NASDAQ:AAPL chart right now? Honestly, it’s a mess. It’s one of those setups where you can’t confidently say much with conviction , but one thing feels clear to me: it should go lower before it gets better.
Zooming out to the 3-day timeframe , you can spot something interesting: the downtrend from 2022 to 2023 looks almost identical to the one we’ve seen from July 2023 to April 2024 — same structure, same slow bleed, and almost the exact same duration. That kind of symmetry doesn’t happen by accident.
After that, we had a massive rally from April/May 2024 , but now we’re already seeing a sharp retracement — down over 35%. My take? We probably need one more leg lower to really shake things out before Apple makes a meaningful move higher, maybe toward $250–$260 .
To get there, I think we still need to retest the $160–$150 zone. If we break below that and head toward $120, then we’re in real trouble structurally — that would shift the whole outlook.
Yes, the recent bounce from the VWAP level was clean , and it looked strong — but I wouldn’t rule out one more flush before we get the real recovery. Apple is in no-man’s-land right now, and until we hit key levels or reclaim broken structure, it’s caution over confidence.
