Silver Bulls Breaks Resistance, Eyes on $34.57 RetestThe upside risk we flagged earlier this week has now materialised for silver, with the spot price staging a bullish break above the 50-day moving average, resistance at $32.73, and the December 2024 uptrend on Wednesday.
Having closed above this former resistance zone, it may now provide a base for fresh longs targeting a retest of the March 28 swing high at $34.57. Levels to watch in between include Wednesday’s high at $32.16 and $33.50 which acted as support around the turn of the month. A stop loss beneath the uptrend would offer protection should the trade move against you.
While momentum indicators remain more neutral than outright bullish, the bias is to the upside following the breakout and ongoing trends in RSI (14) and MACD.
Good luck!
DS
Trend Lines

SHORT XRP/USDT🔥 #XRP/USDT
🔴 SHORT
🎲 Entry Zone: 2.1110
✅ Take Profit 1: 2.0675
✅ Take Profit 2: 2.0242
✅ Take Profit 3: 1.9545
✅ Take Profit 4: 1.8867
(Extended if Momentum Persists)
❌ Stop Loss: (A Strong Close Above 2.2100 Invalidates the Short Setup)
💱 Recommended Margin: 2.5% - 5%
🧳 Recommended Leverage: 5X - 15X
⚠️ Take Care of Risk Management for Your Account

GOLD → If you didn't catch the train, what should you do?FX:XAUUSD in a rally. Running into a train that is already in motion is prohibited due to the lack of ability to calculate risks. Ahead of the news, a correction is possible, which will allow us to find a place to trade
Gold continues to update an all-time high on the back of expectations of retail sales in the US and the speech of Fed chief Powell. Price growth was supported by strong data from China, increased demand for “protective assets” due to geopolitical tensions and trade risks between the U.S. and China. Additional support was provided by forecasts of gold price growth from ANZ to $3,600 by the end of the year
Technically, the psychological zones of interest 3325 - 3350 are ahead, from which a correction may form. The ideal scenario is to wait for a correction to local or intermediate support levels and only there look for an entry point.
Resistance levels: 3318, 3335, 3350
Support levels: 3275, 3265, 3244
On the background of a strong bull market it is worth using as a productive strategy to trade on the breakdown of resistance in order to continue growth, but in this case we need to wait for consolidation, we do not have it.
Or wait for correction, support retest and only then consider buying.
Regards R. Linda!

NZDUSD → Is there a chance for continued growth?FX:NZDUSD within the framework of the rally, which is associated with a strong decline in the dollar, is exiting the ascending channel and testing the resistance at 0.5922.
Against the backdrop of the falling dollar, which is associated with economic factors, the New Zealand has good chances to continue to grow. Consolidation of the currency pair above the level will indicate the readiness of the currency pair to continue to grow.
But! Today is quite a day full of economic news. Traders are waiting for Core retail sales & retail sales, as well as Powell's speech at 17:15 UTC. High volatility is possible!
Resistance levels: 0.5922, 0.6038
Support levels: 0.5853
A small correction may be formed from the resistance, but another retest and price consolidation above 0.5922 may be a good signal for both the bulls and us to make decisions. The currency pair has all chances to reach 0.6000
Regards R. Linda!

GBPCAD → False breakdown, where do we go from here?FX:GBPCAD is forming a false breakdown of trend support. Against the backdrop of the falling dollar, the pound sterling went into the rally phase, which is favorable for the currency pair.
The fundamental situation is in favor of GBP and CAD against the dollar, which continues its rapid decline.
As part of the correction, the currency pair forms a test of support without the opportunity to continue the downward movement. The maneuver ends with a false breakdown and consolidation above the level (inside the channel). The currency pair may continue the uptrend if the bulls hold the defense above 1.8144 - 1.823
Support levels: 1.81500, 1.79788
Resistance levels: 1.8233, 1.83796
Accordingly, based on the fact that we have an uptrend, a strong currency pair (on the background of a weak dollar) and a false breakdown of support, we can say that the price is not allowed down and it is worth considering an attempt to continue the uptrend.
Regards R. Linda!

Alibaba - Don't Forget Chinese Stocks Now!Alibaba ( NYSE:BABA ) still remains super interesting:
Click chart above to see the detailed analysis👆🏻
After we saw the very expected parabolic rally on Alibaba about four months ago, Alibaba is now perfectly retesting major previous structure. Yes, we could see a short term pullback in the near future but this just offers a perfect break and retest after the rounding bottom pattern.
Levels to watch: $110, $140
Keep your long term vision,
Philip (BasicTrading)

Trend Support and 18M AVWAP: Our Final Stronghold📜 Field Orders – Operation: Defensive Line
Troops, listen up.
We’re falling back to our key defenses—Trend Support and the 18M AVWAP.
Hold your ground.
Do not charge.
We wait.
🎯 Your Orders:
Stand down unless support is broken cleanly with force.
If the red army pushes through and confirms—join the short side.
Enter only with structure, never emotion.
Protect your treasures—capital is your ammunition. Don’t waste it fighting in the chop.
If this is a trap, and you’re caught in it—retreat immediately.
Take the loss. Regroup. Redeploy with strength and clarity.
If we bounce here—watch for signs of a counteroffensive near the AVWAP wall.
But again—only enter with confirmation. Not hope.

Cat's in the CradleHey Guys!! Here's one for you that you are going to Like
Let's Aim for a ~50% profit, on This one...
($22---->30 )
double-bottom,Trend Channel
Clearly defined Support-and-resistance Touch points.
Cheers!
And the cat's in the cradle and the silver spoon
Little boy blue and the man on the moon
"When you comin' home, Dad?"
"I don't know when, but we'll get together then
You know we'll have a good time then"

23400 is here but weekly candle is yet to close! As we can see NIFTY did manage to close itself above 23400 level showing signs of bullishness but this level has acted as a strong support previously and hence expected to act as a strong resistance. Hence we must wait for a weekly candle to close above 23400 level for confirmation for further upmove else our view is bearish and can result in good fall as the gap has already been filled and can result in sharp fall as it is already trading in strong supply zone so plan your trades accordingly and keep watching.

Gold Will be Bullish from a Historic Support LevelHello Traders
In This Chart GOLD HOURLY Forex Forecast By FOREX PLANET
today Gold analysis 👆
🟢This Chart includes_ (GOLD market update)
🟢What is The Next Opportunity on GOLD Market
🟢how to Enter to the Valid Entry With Assurance Profit
This CHART is For Trader's that Want to Improve Their Technical Analysis Skills and Their Trading By Understanding How To Analyze The Market Using Multiple Timeframes and Understanding The Bigger Picture on the Charts

GHST/USD Cryptocurrency Quote | Chart & Forecast SummaryKey Indicators On Trade Set Up In General
1. Push Set Up
2. Range Set up
3. Break & Retest Set Up
Notes On Session
# GHST/USD Cryptocurrency Quote
- Double Formation
* (EMA Settings)) On (A+ Set Up)) | Completed Survey
* (Reversal Argument)) At 325.00 USD Indexed To 100 | Subdivision 1
- Triple Formation
* (Flag Structure) & Retest Area | Subdivision 2
* (TP1) | Subdivision 3
* Daily Time Frame | Trend Settings Condition
- (Hypothesis On Entry Bias)) | Indexed To 100
- Position On A 1.5RR
* Stop Loss At 40.00 USD
* Entry At 33.00 USD
* Take Profit At 20.00 USD
* (Downtrend Argument)) & Pattern Confirmation
* Ongoing Entry & (Neutral Area))
Active Sessions On Relevant Range & Elemented Probabilities;
European-Session(Upwards) - East Coast-Session(Downwards) - Asian-Session(Ranging)
Conclusion | Trade Plan Execution & Risk Management On Demand;
Overall Consensus | Sell

XAU/USD: All-Time High Reached with Pullback Opportunity AheadThe XAU/USD market has set a new all-time high, continuing its strong bullish trajectory toward the 3300 resistance zone. This level may act as a potential reversal point, offering a chance to enter on a pullback.
A range zone has formed around the 3225 level, which, along with the nearby upward trendline, could serve as a key support area for identifying buy signals. With high-impact news scheduled for today, volatility is expected. Should a retracement occur, the support zone around 3225 may provide a launchpad for the next move toward the resistance zone at 3390

EUR/NZD: Bullish Structure Intact After Pullback to Key SupportThe EUR/NZD pair has completed an ABC pullback toward the support zone and channel boundary, recently bouncing off the psychological level at 1.91000, which has shown to be a significant area of strength.
On higher timeframes, the market continues to post higher highs and higher closes, confirming a bullish long-term trend. While the recent retracement suggests a possible consolidation phase, the price is expected to retest at least 50% of the pullback range, with potential to climb even higher. If it holds above the 1.9000–1.9100 support zone, the probability of a resumed upward move remains strong. The next target is the resistance zone around 1.96700

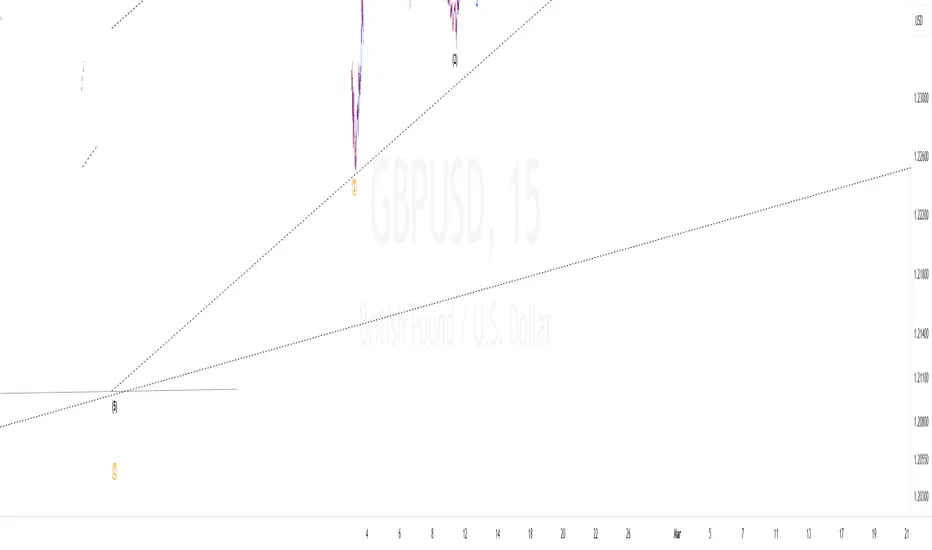
GBPUSD 5th wave upLooks like we should be expecting one move up to complete this cycle then we will have a correction to correct the whole bullish cycle.
BNB/USDT: Key Support Zone Holds Potential for Bullish ReversalThe BNB/USDT market recently bounced from the 560 support level, a notable swap zone that has acted as a key turning point in past price action. The current pullback from the downward trendline appears to be directing price back toward this historically significant support area.
On the weekly timeframe, a bullish candle has formed, while the daily chart shows a pattern of higher lows, pointing to growing buying pressure. If the price revisits the 550–560 zone, a bounce is likely, potentially sparking a bullish move. With technical signals aligning across multiple timeframes, this zone stands out as a prime area of interest. The next target is the resistance zone around 613

Apple – More Pain to come? Apple’s NASDAQ:AAPL chart right now? Honestly, it’s a mess. It’s one of those setups where you can’t confidently say much with conviction , but one thing feels clear to me: it should go lower before it gets better.
Zooming out to the 3-day timeframe , you can spot something interesting: the downtrend from 2022 to 2023 looks almost identical to the one we’ve seen from July 2023 to April 2024 — same structure, same slow bleed, and almost the exact same duration. That kind of symmetry doesn’t happen by accident.
After that, we had a massive rally from April/May 2024 , but now we’re already seeing a sharp retracement — down over 35%. My take? We probably need one more leg lower to really shake things out before Apple makes a meaningful move higher, maybe toward $250–$260 .
To get there, I think we still need to retest the $160–$150 zone. If we break below that and head toward $120, then we’re in real trouble structurally — that would shift the whole outlook.
Yes, the recent bounce from the VWAP level was clean , and it looked strong — but I wouldn’t rule out one more flush before we get the real recovery. Apple is in no-man’s-land right now, and until we hit key levels or reclaim broken structure, it’s caution over confidence.

Nifty near the trendline resistance now after another good day.Nifty has cleared the 200 days EMA or the Father line on Daily chart. But in the hourly chart depicted here has hit a resistance zone which happens to be a trend line resistance.
RSI of Nifty is currently above 73 and the scope for upside is there but limited. With a shortened week tomorrow we will have a weekly closing. So a positive closing tomorrow can place us in a good space for a next week. However with everchanging trade war scenario it is difficult to guess if investors will encash their long positions or carry them forward into the next week.
The next resistances for Nifty remain at 23456, 23621, 23713, 23784 and 23915 before Nifty regains 24K levels. The support zones for Nifty remain at 23292, 23156, (Mother and Father lines of hourly chart are close by near) 23017 and 22980. So this zone will be a strong support. A closing below 22980 can drag Nifty down towards 22771 or even 22361 region.
Also one must keep an eye on Reliance result tomorrow. As it is a index power house it can single handedly make or break the weekly closing. Flat or positive closing tomorrow will be very helpful for the bull run to continue.
Disclaimer:The above information is provided for educational purpose, analysis and paper trading only. Please don't treat this as a buy or sell recommendation for the stock or index. The Techno-Funda analysis is based on data that is more than 3 months old. Supports and Resistances are determined by historic past peaks and Valley in the chart. Many other indicators and patterns like EMA, RSI, MACD, Volumes, Fibonacci, parallel channel etc. use historic data which is 3 months or older cyclical points. There is no guarantee they will work in future as markets are highly volatile and swings in prices are also due to macro and micro factors based on actions taken by the company as well as region and global events. Equity investment is subject to risks. I or my clients or family members might have positions in the stocks that we mention in our educational posts. We will not be responsible for any Profit or loss that may occur due to any financial decision taken based on any data provided in this message. Do consult your investment advisor before taking any financial decisions. Stop losses should be an important part of any investment in equity.

GBP/USD For Bearish as pull-backyou can go short now
or
wait for pull-back near by entry point and then go short
general trend is up trend
current phase is pull-back
have fun :)

Trading Signals for GOLD we look to sell at $3,335 XAUUSD SELL PLAN @3330_3335
SL : @3345
TP : @3288
TP : @3253
Trade Analysis
Early in the American session, gold is trading around 3,307, showing signs of exhaustion.
A further technical correction toward the 21SMA is likely in the coming hours.
On the H4 chart, we can see that gold is trading within a bullish trend channel formed on April 10th. It is likely that in the coming hours the metal could continue its a rise to 3,335 and could even reach 3,338.
If gold breaks and consolidates below 3,288, we could expect a strong downward movement.
So, the metal could continue its sell with a target at 3,274, and the price could eventually reach the +2/8 Murray located at 3,248.
if gold rise towards the 8/8 Murray located at 3,335, we could expect confirmation first if the gold price consolidates above the +1/8 Murray, then it could reach this target.
The indicator is reaching overbought levels, so we will look for opportunities to sell below its high of 3,335, with targets at 3,288, 3,274, and finally 3,248.

Nothing different - stay patient, wait for your best fills!Still shorting these names for now until I see signs that we're no longer building bearish short-term liquidity which from the looks of PA and the algos, we still are.
Waiting for more fills in the low $70k's and ideally a reach to FWB:67K
Happy Trading :)

SBI CARD – Breakout Watch | Trendline Resistance TestedSBICARD is currently at a crucial technical juncture. After a long consolidation and multiple rejections from a descending trendline (marked in grey), the stock is now attempting a decisive breakout on the weekly chart.
📊 Key Observations:
Price has broken above a multi-year trendline resistance. Strong bullish candle.
Breakout level around ₹860–₹870 — previously acting as supply zone.
Volume pickup supports the breakout strength.
Immediate target shown on chart is ₹1,065, which is ~22.78% potential upside from breakout.
🎯 What to Watch:
Sustained weekly close above ₹870 could confirm breakout.
Possible retest of breakout zone before next leg up.
Stop-loss for swing traders can be placed around ₹820.
📌 Disclaimer: Not a recommendation. Do your own research and risk management.

Chevron (CVX) / US Dollar Quote | Chart & Forecast SummaryKey Indicators On Trade Set Up In General
1. Push Set Up
2. Range Set up
3. Break & Retest Set Up
Notes On Session
# Chevron (CVX) / US Dollar Quote
- Double Formation
* (A+ Set Up)) At 90.00 USD | Completed Survey
* (Flag Structure) | Subdivision 1
- Triple Formation
* ((No Trade)) & Area Of Value | Subdivision 2
* (TP1) | Subdivision 3
* Daily Time Frame | Trend Settings Condition
- (Hypothesis On Entry Bias)) | Logarithmic Settings
- Position On A 1.5RR
* Stop Loss At 125.00 USD
* Entry At 135.00 USD
* Take Profit At 148.00 USD
* (Uptrend Argument)) & Pattern Confirmation
* Ongoing Entry & (Neutral Area))
Active Sessions On Relevant Range & Elemented Probabilities;
European-Session(Upwards) - East Coast-Session(Downwards) - Asian-Session(Ranging)
Conclusion | Trade Plan Execution & Risk Management On Demand;
Overall Consensus | Neutral

Gold continues to surge to new highs! Market analysis referenceToday's Asian session has directly pulled up from yesterday's multiple rebound highs near 3230. The current relative low has risen by nearly 80 points, and there is a trend of further hitting new highs. Once it breaks the high again, it will continue to hit the 3330-50 line. We have analyzed before that the next big target of the weekly pattern and segmentation cycle is to look at 3400. It is estimated that it will reach it after a few waves of pull-ups. The weekly line last week's big positive also needs to rise inertia this week. The current focus of the day is still on falling back to do more.
After the Asian session gold price rose sharply, the European session trend is crucial. If the European session maintains a small sideways fluctuation, then the US session is likely to launch an upward attack again. What needs to be focused on now is the extent of the bulls' callback repair. In view of the current volatile market, the decline of tens of dollars may just be a normal adjustment of the bulls, not a trend reversal. The current support below can refer to the afternoon low of 3280, which can also be used as an important reference for European session operations. The key watershed below may be at the previous top and bottom conversion position of 3245, while the upper key pressure is focused on the 3330-3350 line. On the whole, the short-term operation strategy of gold today is recommended to be long on pullbacks and short on rebounds. The upper short-term focus is on the 3330-3350 line of resistance, and the lower short-term focus is on the 3275-3280 line of support. Friends must keep up with the rhythm.
Gold operation strategy reference: Strategy 1: Short gold rebounds near 3330-3340, target near 3305-3290, and look at the 3280 line if it breaks.
Strategy 2: Long gold pullback near 3275-3285, target near 3310-3330, and look at the 3350 line if it breaks.
