Marriott Vacations Stock Quote | Chart & Forecast SummaryKey Indicators On Trade Set Up In General
1. Push Set Up
2. Range Set up
3. Break & Retest Set Up
Notes On Session
# Marriott Vacations Stock Quote
- Double Formation
* ABC Wave Feature | Completed Survey
* (No Trade)) At 115.00 USD | Subdivision 1
- Triple Formation
* (EMA Settings)) | Short Set Up | Subdivision 2
* (TP1) | Subdivision 3
* Daily Time Frame | Trend Settings Condition
- (Hypothesis On Entry Bias)) | Logarithmic Settings
- Position On A 1.5RR
* Stop Loss At 59.00 USD
* Entry At 54.00 USD
* Take Profit At 45.00 USD
* (Downtrend Argument)) & No Pattern Confirmation
* Ongoing Entry & (Neutral Area))
Active Sessions On Relevant Range & Elemented Probabilities;
European-Session(Upwards) - East Coast-Session(Downwards) - Asian-Session(Ranging)
Conclusion | Trade Plan Execution & Risk Management On Demand;
Overall Consensus | Sell
Trend Lines


Breakout Confirmation with Retest? $S Eyes Potential Rally S has just broken above a key descending trendline on the 8H chart, indicating potential bullish momentum ahead

GOLD(XAUUSD) -Weekly Forecast,Technical Analysis & Trading IdeasMidterm forecast:
2772.38 is a major support, while this level is not broken, the Midterm wave will be uptrend.
We will close our open trades, if the Midterm level 2772.38 is broken.
OANDA:XAUUSD TVC:GOLD
Technical analysis:
A peak is formed in daily chart at 3167.60 on 04/03/2025, so more losses to support(s) 3000.00, 2955.00, 2879.11 and minimum to Major Support (2772.38) is expected.
Take Profits:
2833.00
2879.11
2955.00
3000.00
3057.40
3100.00
3167.60
3200.00
__________________________________________________________________
❤️ If you find this helpful and want more FREE forecasts in TradingView,
. . . . . . . . Hit the 'BOOST' button 👍
. . . . . . . . . . . Drop some feedback in the comments below! (e.g., What did you find most useful? How can we improve?)
🙏 Your support is appreciated!
Now, it's your turn!
Be sure to leave a comment; let us know how you see this opportunity and forecast.
Have a successful week,
ForecastCity Support Team

BBFL- 2x Buying Opportunity!If price breaks above TL with good volume, but trade is on the cards with 2x earning potential

Bitcoin Dominance Update (1D)Bitcoin dominance is currently showing signs of weakness and appears to be losing momentum for another upward move.
If we see a breakdown below the 62% level, a sharp decline toward 57% is likely.
During this phase, it may feel like an altcoin season is approaching, but in reality, most altcoins will likely just be retracing previous losses rather than entering true price discovery.
Still, for those who buy the dips, it can present a profitable rally opportunity—especially in short to mid-term cycles.
— Thanks for reading.

XYOusdt Trading opportunityXYOUSDT has achieved a magnificent breakout from its downtrend, showcasing a potential inverse head and shoulder formation. The price is currently forming the right shoulder of this pattern, with a broad accumulation zone that can accommodate most of the right shoulder formation. Targets are clearly delineated on the chart, ranging from immediate to final levels. For this setup, I recommend a 25% stop loss and suggest trading on spot to allow for proper room for dollar-cost averaging (DCA) if feasible.

USDJPY RETRACEMENT Still on bearish,
If price action will not displace a body of a candle on our breakout the price will go up on our RETRACEMENT area 145.570

Ishares 20+ Treasury Bond | TLT | Long in the $90sIshares 20+ Treasury Bond NASDAQ:TLT are particularly sensitive to interest rates: the price moves up when they are lowered and down when they rise. Locally, I'm witnessing banks lower their interest rates for CDs and shorten the duration for those with high-yielding returns. The general political rhetoric, especially due to the election cycle, is a push for the Federal Reserve to drop them. Now, despite the possible negative economic implications of lowering interest rates too soon if inflation is high, there is a good probability they may be lowered (even slightly) in 2024... perhaps September?
This analysis isn't to time the bottom perfectly, though. Instead, it's a probability assessment. Personally, TLT in the low $90s is in a long-term "buy-zone".
Target #1 = $104
Target #2 = $122
Target #3 = $170+ (very long-term view / economic crash... let's hope not, though)

iShares 20 Year Treasury Bond | TLT | Long in the $80sFor the patient, one of the "safest" investments is in long-term treasury bonds (specifically NASDAQ:TLT ). For those who may not understand why, bond prices move inversely to yields. If interest rates drop (which the Federal Reserve has stated is going to happen this year), NASDAQ:TLT will rise. If interest rates rise (like what happened in early 2022), NASDAQ:TLT will fall. But all information from the Federal Reserve points to interest rate cuts starting this year *or* in the near future.
As of April 1st, 2025, the dividend yield for NASDAQ:TLT is 4.52%. That interest rate beats the vast majority of savings accounts right now. I don't think we will see NASDAQ:TLT prices in the $80's longer than a year or two. A contrarian may argue "inflation is rising!", but the data continue to point to it actually stabilizing. Yes, prices are higher compared to 4-5 years ago for just about everything... but the higher prices are "stable". Tariffs may put a slight wrinkle in this stability in the near-term, but I think the economy is already slowing and the Federal Reserve will be pressured to start dropping interest rates sooner than later.
I believe a global economic bust is inevitable - but no one knows when. Anyone who says they can time it is a charlatan. If/when a global economic bust occurs, the Federal Reserve will drop interest rates (like what happened in 2020) to get the economy juiced up again. NASDAQ:TLT will double in price or go further.
My general point is I *believe* NASDAQ:TLT is nearing a low and any future declines (especially below $80) are personal opportunities for buy-and-hold. It's a solid hedge with a good dividend. Options don't give you that and timing events is a guessing game for every retail trader. So, as someone who tries to think beyond the "now", I am gathering shares, enjoying the dividend, and not touching them until a global economic bust occurs. Currently holding positions at $85, $86, $87, and $90.
Targets:
2027: $100.00
2028: $105.00
2029: $110.00
2030: $115.00
Bust (unknown timing): $170+

Prepare for LIFTOFF $ADAThe Global Net Liquidity index is breaking out of its multiyear downtrend channel on the back of a weak TVC:DXY dollar. Altcoins like CRYPTO:ADAUSD and other risk assets historically wildly outperform during Global Net Liquidity uptrends and dollar debasement cycles. As the business cycle heats up with ISM Manufacturing PMI ECONOMICS:USBCOI rising above 50, expect altcoins to gain relative strength to CRYPTO:BTCUSD and a Bitcoin Dominance
CRYPTOCAP:BTC.D collapse into the 35-45% range.
This is your last chance.

Gold may face sharp fluctuations,The risk of downside increases!Technical analysis: Gold daily line rose by more than $100 on Thursday, creating a rare single-day increase in more than ten years. The cumulative increase in three days exceeded $200, and the technical indicators were overbought. The current gold price is in the stage of accelerating to the top. In the short term, pay attention to the resistance of the 3245-3250 area, and be alert to the risk of falling back after a high. Although the trend is still strong, the effectiveness of technical analysis is weakened under the guidance of news. It is recommended to focus on high altitude. This week is the fifth week of rising, and the probability of a change on Friday increases.
Ⅰ: The daily indicator macd golden cross is initially established, and the smart indicator sto quickly repairs upward, representing the bullish trend of the price. At present, because it is a historical high, there is no resistance point to judge, so we can only try it based on the small cycle indicators. The current support point of the daily line is located near the moving average MA5 and MA10, 3096-3088, and it is not considered to be far away from the candlestick chart.
Ⅱ: The current macd high golden cross in 4 hours is oscillating with large volume, and the smart indicator sto is overbought, which means that the price is oscillating at a high level. Because the indicators are at a relatively high level, they may face short-term peak signals at any time. Currently, we are focusing on the support line of 3176 near the MA5 moving average.
Ⅲ: The hourly MACD is currently oscillating with large volume, and the dynamic indicator STO is overbought, which means that the hourly line is still oscillating strongly. The current focus is on the 3220 line*. If it breaks through 3220 this hour, it will continue to look for a high point. Otherwise, a small cycle peak signal will be formed at this position. The current support below the hourly line is located at the MA5 and MA10 moving averages, and the focus is on the MA10 support line of 3185. Comprehensive thinking: The current price is oscillating at a high level, and the short-term focus is on the 3220 line*. If it breaks through, the price will continue to move upward. The current focus below is the support near 3190. If it falls below, the price may move to around 3150-3135.
Strategy: Refer to 3440-45 for short selling

AvalonBay Inc Stock Quote | Chart & Forecast SummaryKey Indicators On Trade Set Up In General
1. Push Set Up
2. Range Set up
3. Break & Retest Set Up
Notes On Session
# Avalon Bay Communities Inc Stock Quote
- Double Formation
* (EMA Settings)) At 205.00 USD | Completed Survey
* (Downtrend Argument)) | Subdivision 1
- Triple Formation
* 0.5 Retracement Area | Short Set Up | Subdivision 2
* (TP1) | Subdivision 3
* Daily Time Frame | Trend Settings Condition
- (Hypothesis On Entry Bias)) | Logarithmic Settings
- Position On A 1.5RR
* Stop Loss At 200.00 USD
* Entry At 189.00 USD
* Take Profit At 170.00 USD
* (Downtrend Argument)) & Pattern Confirmation
* Ongoing Entry & (Neutral Area))
Active Sessions On Relevant Range & Elemented Probabilities;
European-Session(Upwards) - East Coast-Session(Downwards) - Asian-Session(Ranging)
Conclusion | Trade Plan Execution & Risk Management On Demand;
Overall Consensus | Sell

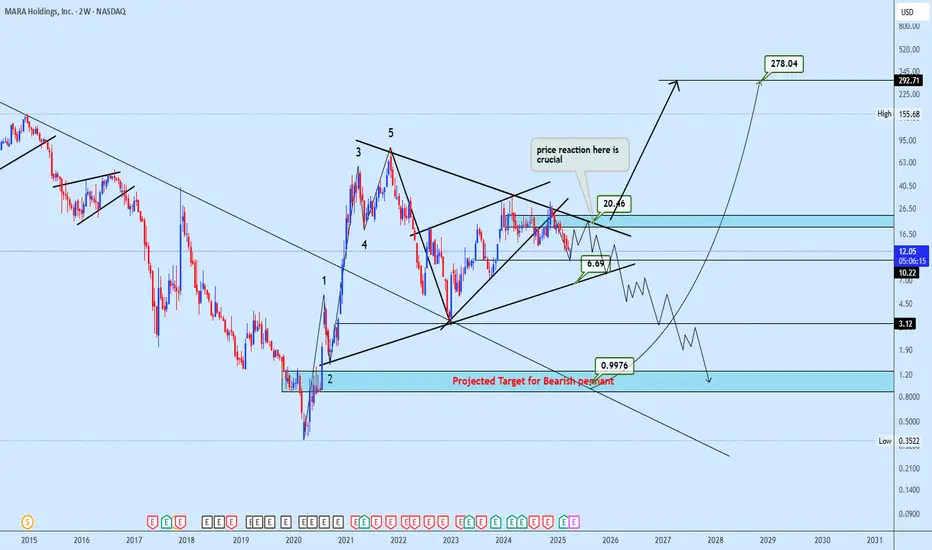
MARA's Defining Moment: Breakdown or Breakout?MARA Holdings has completed a textbook 5-wave macro impulse, followed by a complex correction, now compressing within a bearish pennant just beneath the key 20.46 resistance.
This level marks a crucial pivot, failure to reclaim it may trigger a steep drop toward the 0.9976 zone, while a breakout above could unlock exponential upside toward 155.68 and 281.27.
The coming price reaction will be decisive in shaping the next macro narrative.
EURCHF: To The New Lows 🇪🇺🇨🇭
THere is a high chance that EURCHF will drop lower before the market closes.
I see a confirmed violation of a support of the flag
on an hourly time frame.
Next support - 0.921
❤️Please, support my work with like, thank you!❤️

#USDCAD: We took the Swing Sell, Now let's focus on Swing Buy! The USD/CAD exchange rate experienced a significant decline, reaching its all-time high against the USD. This decline is primarily attributed to the ongoing trade dispute between China and the United States, which has led to a depreciation of the USD and resulted in a yearly low.
However, we anticipate a potential reversal in the price trajectory. We identify a favourable area where the price may stabilise and address the liquidity gap it has created.
We have established three targets, and to effectively utilise these targets, we recommend executing small entries with each target set based on a predetermined take-profit level.
We extend our sincere gratitude for your unwavering support throughout this journey within this community. Additionally, we appreciate the contributions of each individual who has supported our endeavours. We are pleased to announce that we have garnered 20,000 followers.
Much Love,
Team Setupsfx_
❤️🚀

Trading opportunity for ADAUSDTBased on technical factors there is a Sell position in :
📊 ADAUSDT
🔴 Sell Now
🪫Stop loss 0.7200
🔋Target 0.5000
📏 R/R 1,5
💸RISK : 1%
We hope it is profitable for you ❤️
Please support our activity with your likes👍 and comments📝

GBPNZDWe can attempt to buy GBPNZD from specified level as it make HL , also there is no bearish divergence occur indicate that it moves upward.
SL , TP mention in chart.

XAUUSDWe can attempt to buy XAUUSD from specified level as it make HL , also there is bullish divergence occur indicate that it moves upward.
SL , TP mention in chart.

SILVER (XAGUSD): More Growth is Coming
Following Gold, Silver formed a strong bullish pattern on an hourly time frame.
I found the ascending triangle formation and a breakout of its neckline
as a strong bullish confirmation.
I expect growth at least to 31.7 level now.
❤️Please, support my work with like, thank you!❤️
I am part of Trade Nation's Influencer program and receive a monthly fee for using their TradingView charts in my analysis.

AUD/USD bearish flagwe going to keep it simple and clean
# we've a bearish flag
# also, it has already retested, the flag and the trend line
find your entry if it aligns with your analysis

Silver at a Crossroads: More Pain or a Rally Above 34?Silver is undergoing a potential trend change. The previous yellow uptrend channel has been broken, and a new, nearly flat-slightly downward channel (marked by blue lines) appears to be forming. While it may be too early to confirm this as an established trend, the structure is developing with increasing clarity.
Silver is now at a crossroads. The former trendline is being retested, and just above it lies a confluence of resistance: a previous demand zone and the 200-day moving average. These former support levels have now merged into a strong resistance area.
Unless this resistance zone is broken, downward pressure is likely to persist. However, a breakout could open the door for a medium-term move toward the 34 level.
Please check gold/silver chart for longer term understanding:

EURUSD Tests 17-Year Long-Term Trend!!!After Trump announced an additional 20% in tariffs, EURUSD made a relatively surprising move and surged sharply. This marks the second leg of the upward trend that began in early March. However, the sharp rise has now brought EURUSD to the doorstep of a very long-term resistance level.
Since testing 1.60 in 2008, EURUSD has been moving lower within a wide descending trend channel that has held for 17 years. Since 2015, the pattern has evolved into a wedge formation within this broader channel. The most recent test of this resistance came last year, but at the time, a weak Eurozone economy, crowded Euro long positions, and a hawkish Fed prevented a breakout.
This time, the landscape is different. The Eurozone is showing early signs of recovery, the ECB’s rate cuts appear to be nearing their end, and European countries have started to band together following a decline in confidence in their biggest ally and decide to increase technology, defence spending.
Despite these developments, the medium-term effects of the new tariffs and the strength of the long-term resistance level are likely to prevent a clear breakout for now. Still, the long-term outlook is beginning to shift in favor of the euro, and a breakout later this year carries a significant probability.
