Short-term Short entry in about 12 hours (+Long term entry)I use a combination of Support resistances, FVG, Fib Retracements, trendline, 5 waves, etc.
To keep it simple... (I add more stuff later)
Short term:
Good possible short entry STARTING 95236-95808 to target 89k-88,547 (Using FVG & Support Resistance)
Long term:
Start looking for longs starting at 81283 - 77908 (SL has to be below the 78400 candle) More update for long term strategy later on...
Trend Lines

How to arrange when gold fluctuates upward🗞News side:
1. Pay attention to the recent trade situation and news about the Fed's interest rate cuts
2. Be wary of DXY trends
3. The situation of the Russian-Ukrainian war and the follow-up events of the India-Pakistan conflict
4.Trump imposes 100% tariff on non-US films
📈Technical aspects:
In the morning, we seized the opportunity to short and earn a wave of profits. Then gold fell back to 3255 and rebounded again, moving upward in a fluctuating manner. From the hourly chart, Friday's low was around 3220 and today's high was around 3270. In this trend, 3255 may be the short-term low for short-term trading. From the daily chart, gold has closed the cross star. The current gold price is more critical. If it breaks through 3285, it may continue to rise to the 3295-3300 line. If the gold price fails to effectively break through 3285, it may usher in a wave of retracement. It will be a good time for us to go long.
If you agree with this point of view, or you have a better idea, please leave a message in the comment area. I look forward to hearing different voices.
TVC:GOLD FOREXCOM:XAUUSD FXOPEN:XAUUSD FX:XAUUSD OANDA:XAUUSD

Gold bulls make a comeback
The non-farm payrolls data released last Friday were unexpectedly strong. The seasonally adjusted non-farm payrolls in the United States increased by 177,000 in April, significantly higher than the expected 130,000, and the unemployment rate remained at 4.2%, in line with market expectations.
After the data was released, the market's expectations for the Fed's interest rate cuts this year have cooled, and the number of interest rate cuts is expected to be close to four. Trump once again said that tariffs will bring billions of dollars in revenue, we are just in a transitional stage, and the Fed should lower interest rates.
Last week, gold retreated to around 3200. Before the release of the non-farm payrolls data, gold once rebounded to around 3270.
After the release of the non-farm payrolls data, gold once again fell back, once stepped back to around 3220, and finally closed at 3240.
From the current point of view, the correction of gold has basically come to an end. If nothing unexpected happens next, it will slowly recover its losses and stand above the 3300 mark again.
Here on the 4-hour chart:
It can be clearly seen that gold has re-established itself above the trend line.
If it was suppressed near 3270 last Friday, there would be no problem.
But as time goes by, the suppression trend line is getting lower and lower. Now there is no need to pay attention to 3270 at all, because the trend has broken.
Now if you still pay attention to 3270, it will be meaningless.
From the 1-hour chart:
From Friday's low of around 3220 to today's high of around 3270, you can see that around 3253 is exactly the support position of this trend.
Therefore, the next operation is very simple. Just pay attention to 3255-50. As long as gold is still above this support before the European session, you can rely on 3255-50 to enter the market and do more.
The first target is 3280, and the second is 3300.

Genuine Parts Stock Quote | Chart & Forecast SummaryKey Indicators On Trade Set Up In General
1. Push Set Up
2. Range Set up
3. Break & Retest Set Up
Notes On Session
# Genuine Parts Stock Quote
- Double Formation
* Wave Feature | Completed Survey
* Start Of (Anchored VWAP)) At 140.00 USD | Subdivision 1
- Triple Formation
* (Target Entry Or Gap Fill) & Downtrend Continuation | Subdivision 2
* (TP1) | Subdivision 3
* Daily Time Frame | Trend Settings Condition
- (Hypothesis On Entry Bias)) | Regular Settings
- Position On A 1.5RR
* Stop Loss At 114.00 USD
* Entry At 120.00 USD
* Take Profit At 129.00 USD
* (Uptrend Argument)) & No Pattern Confirmation
* Ongoing Entry & (Neutral Area))
Active Sessions On Relevant Range & Elemented Probabilities;
European-Session(Upwards) - East Coast-Session(Downwards) - Asian-Session(Ranging)
Conclusion | Trade Plan Execution & Risk Management On Demand;
Overall Consensus | Neutral

add to the watchlist, after bullish wave of btc, eth is next2048-2440 Strong resistance levels, upbrake of the trend will pump etherium to the target. invalidation level is important it is half of the current price. patience will create gain opprtunity on this one.

EURUSD update and new bearish view
FX:EURUSD one more view on EU, we can see long zone and break of same how currently looks, two bounce on sup zone 1.13500, price now pushing till crucial zone 1.12700, if we see break here we will have confirm.
Currently how everything looks, its expected to see stronger fall here.
SUP zone: 1.14000
RES zone: 1.11700, 1.11200

Berkshire Hathaway Stock Quote | Chart & Forecast SummaryKey Indicators On Trade Set Up In General
1. Push Set Up
2. Range Set up
3. Break & Retest Set Up
Notes On Session
# Berkshire Hathaway Stock Quote
- Double Formation
* (Anchored VWAP)) | Completed Survey
* Wave Feature & Ongoing Wave (3)) | Subdivision 1
- Triple Formation
* (Uptrend Argument)) At 510.00 USD | Subdivision 2
* (TP1) | Subdivision 3
* Daily Time Frame | Trend Settings Condition
- (Hypothesis On Entry Bias)) | Regular Settings
- Position On A 1.5RR
* Stop Loss At 512.00 USD
* Entry At 540.00 USD
* Take Profit At 585.00 USD
* (Uptrend Argument)) & No Pattern Confirmation
* Ongoing Entry & (Neutral Area))
Active Sessions On Relevant Range & Elemented Probabilities;
European-Session(Upwards) - East Coast-Session(Downwards) - Asian-Session(Ranging)
Conclusion | Trade Plan Execution & Risk Management On Demand;
Overall Consensus | Buy

Weibo Corp ADR Stock Quote | Chart & Forecast SummaryKey Indicators On Trade Set Up In General
1. Push Set Up
2. Range Set up
3. Break & Retest Set Up
Notes On Session
# Weibo Corp ADR Stock Quote
- Double Formation
* Wave Feature(ABC) | Completed Survey
* (Anchored VWAP)) On Middle Range Entry | Subdivision 1
- Triple Formation
* 0.5 Retracement Area - Range Structure | Subdivision 2
* (TP1) | Subdivision 3
* Daily Time Frame | Trend Settings Condition
- (Hypothesis On Entry Bias)) | Regular Settings
- Position On A 1.5RR
* Stop Loss At 7.50 USD
* Entry At 8.50 USD
* Take Profit At 10.00 USD
* (Ranging Argument)) & No Pattern Confirmation
* Ongoing Entry & (Neutral Area))
Active Sessions On Relevant Range & Elemented Probabilities;
European-Session(Upwards) - East Coast-Session(Downwards) - Asian-Session(Ranging)
Conclusion | Trade Plan Execution & Risk Management On Demand;
Overall Consensus | Buy

Thales Group Stock Quote | Chart & Forecast SummaryKey Indicators On Trade Set Up In General
1. Push Set Up
2. Range Set up
3. Break & Retest Set Up
Notes On Session
# Thales Group Stock Quote
- Double Formation
* Start Of (Anchored VWAP)) At 55.00 EUR | Completed Survey
* VWAP Feature At 125.00 EUR On Long Bias Entry | Subdivision 1
- Triple Formation
* (EMA Settings)) - Uptrend & Retest | Subdivision 2
* (TP1) | Subdivision 3
* Daily Time Frame | Trend Settings Condition
- (Hypothesis On Entry Bias)) | Regular Settings
- Position On A 1.5RR
* Stop Loss At 228.00 EUR
* Entry At 253.00 EUR
* Take Profit At 290.00 EUR
* (Uptrend Argument)) & No Pattern Confirmation
* Ongoing Entry & (Neutral Area))
Active Sessions On Relevant Range & Elemented Probabilities;
European-Session(Upwards) - East Coast-Session(Downwards) - Asian-Session(Ranging)
Conclusion | Trade Plan Execution & Risk Management On Demand;
Overall Consensus | Buy

Sherwin-Williams Stock Quote | Chart & Forecast SummaryKey Indicators On Trade Set Up In General
1. Push Set Up
2. Range Set up
3. Break & Retest Set Up
Notes On Session
# Sherwin-Williams Stock Quote
- Double Formation
* (Target Entry Or Gap Fill)) At 770.00 USD | Completed Survey
* ((No Trade)) On Reversed Settings | Subdivision 1
- Triple Formation
* (Anchored VWAP)) + Cup & Handle Structure | Subdivision 2
* (TP1) | Subdivision 3
* Daily Time Frame | Trend Settings Condition
- (Hypothesis On Entry Bias)) | Regular Settings
- Position On A 1.5RR
* Stop Loss At 300.00 USD
* Entry At 360.00 USD
* Take Profit At 460.00 USD
* (Consolidation Argument)) & Pattern Confirmation
* Ongoing Entry & (Neutral Area))
Active Sessions On Relevant Range & Elemented Probabilities;
European-Session(Upwards) - East Coast-Session(Downwards) - Asian-Session(Ranging)
Conclusion | Trade Plan Execution & Risk Management On Demand;
Overall Consensus | Buy

The latest gold strategy analysis and operation guidance📌Fundamentals:
This week, the US economic data was released intensively, and ADP employment, unemployment benefits, GDP and PCE price index were all bullish, but some data showed signs of weakness after Trump's tariff policy. The unemployment rate remained the same as the previous value of 4.2%, while the expected new employment of 130,000 was significantly lower than the previous value of 228,000. The market's concerns about the cooling of the economy provided support for the gold price.
📊Technical side:
Although the 1-hour moving average is still in a dead cross short arrangement, there are signs of turning around. At the same time, after the rebound, gold began to consolidate at a high level instead of continuing to fall, so the momentum of the bears was weakened. So today's closing is critical. Today, gold fell back to around 3230 under pressure from 3270. In the short term, this is a balance range. You can see the shock in this range at night. If gold finally closes above 3270, then gold will most likely continue to rise next week. If it closes below 3240, then gold bears still have a great chance. If you want to operate in the short term, then don't chase it for the time being. Since it is a shock, you can go short first at a high level. If it breaks through 3270, then wait until next week. On the whole, today's short-term operation of gold suggests that the rebound is mainly short, and the callback is supplemented by long. The top short-term focus is on the first-line resistance of 3265-3270, and the bottom short-term focus is on the first-line support of 3200-3197.
🎯Practical strategies:
Strategy 1: Go short when gold rebounds around 3263-3266, with a target around 3230-3210.
Strategy 2: Go long when gold pulls back around 3197-3200, with a target around 3220-3230.

BTC - “Bull Market” OR Bearish Retest on HTF? Bitcoins excessive rise for the previous two years brings concern for the mechanics of this market. Moving only up for so long leaves much liquidity in the form of long position stop losses below the current price.
These stop loss orders, or leveraged sell orders, are an explosive chain reaction ready to set off.
Observe these two trendlines and copy them to your charts. These two bearish trendlines (in my view) are why bitcoin has truly been rising so freely.
Moves up in the form of bearish retests are fast and fluid, only after the rejection does price fall aggressively.
I anticipate two scenarios here in the realm of bearish ideas:
Possibility 1 - 30% Probability
96,700 to 34,500
34,500 retrace to 68,500
68,500 to 7,000
Possibility 2 - 70% Probability
96,700 to 43,000
43,000 retrace to 60,000
60,000 to 7,000
Note that both of these possibilities end with 7,000. I’m mapping out two routes that take us there, using confluences with trendlines, volume profiles, liquidity mapping, and common sense.
Be mindful of this possibility. And protect yourself accordingly.

Kava potential Reversal and Target ProjectionKAVA is forming a potential bullish reversal after completing Wave 5 within a descending channel, reaching the External Demand Zone. A rally from current levels is anticipated, with initial support at the Immediate Resistance Level.
The setup targets a short-term move to 1.10, then mid-term at 2.25, with a final breakout aimed at 4.97. The pattern suggests strong upside potential, contingent on holding support and breaking through key resistance zones. A confirmed upward break above immediate resistance will validate the bullish projection toward the final target.

CAKEUSDT Potential DownsidesHey Traders, in today's trading session we are monitoring CAKEUSDT for a selling opportunity around 2.17 zone, CAKEUSDT is trading in a downtrend and currently is in a correction phase in which it is approaching the trend at 2.17 support and resistance area.
Trade safe, Joe.

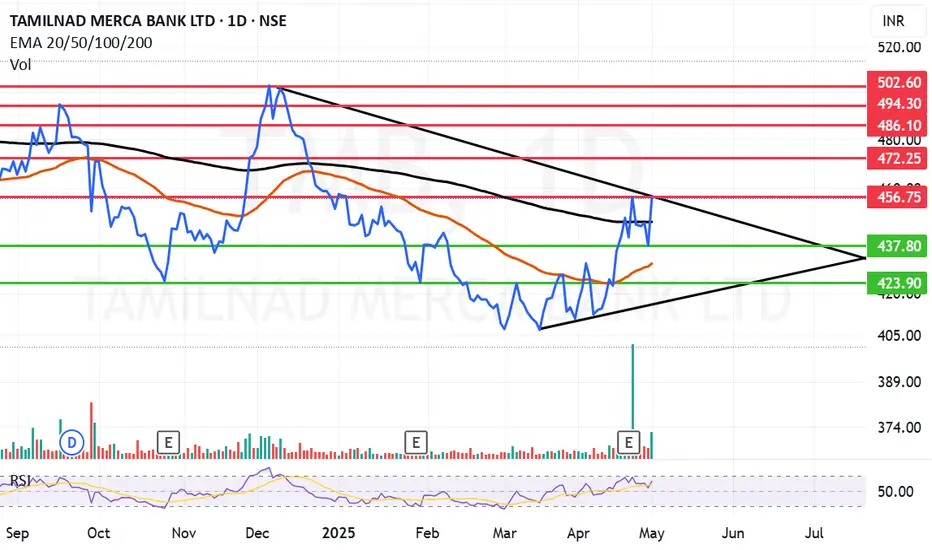
Tamilnad Merca Bank trying to rise with volumes.Tamilnad Mercantile Bank Ltd. engages in the provision of banking services. It offers loan products, current accounts, business and prepaid cards, online and foreign exchange services. It operates through the following business segments: Treasury, Corporate/Wholesale Banking, and Retail Banking.
Tamilnad Mercantile Bank Ltd. Closing price is 456.10. The positive aspects of the company are Very Attractive Valuation (P.E. = 6.1), Companies with Zero Promoter Pledge, Companies with Low Debt, Company able to generate Net Cash - Improving Net Cash Flow, FII / FPI or Institutions increasing their shareholding and Mutual Funds Increased Shareholding over the Past Two Months. The Negative aspects of the company are Stocks Underperforming their Industry Price Change in the Quarter, Declining profits every quarter for the past 2 quarters and Increase in Provisions in Recent Results.
Entry can be taken after closing above 457 Historical Resistance in the stock will be 472 and 486. PEAK Historic Resistance in the stock will be 494 and 502. Stop loss in the stock should be maintained at Closing below 437 or 423 depending upon your risk taking ability.
Disclaimer: The above information is provided for educational purpose, analysis and paper trading only. Please don't treat this as a buy or sell recommendation for the stock or index. The Techno-Funda analysis is based on data that is more than 3 months old. Supports and Resistances are determined by historic past peaks and Valley in the chart. Many other indicators and patterns like EMA, RSI, MACD, Volumes, Fibonacci, parallel channel etc. use historic data which is 3 months or older cyclical points. There is no guarantee they will work in future as markets are highly volatile and swings in prices are also due to macro and micro factors based on actions taken by the company as well as region and global events. Equity investment is subject to risks. I or my clients or family members might have positions in the stocks that we mention in our educational posts. We will not be responsible for any Profit or loss that may occur due to any financial decision taken based on any data provided in this message. Do consult your investment advisor before taking any financial decisions. Stop losses should be an important part of any investment in equity.
HelenP. I Euro may correct to trend line and then rebound upHi folks today I'm prepared for you Gold analytics. After a sharp, impulsive rise, price entered a broad consolidation phase between 1.1575 and 1.1270 levels, creating a horizontal channel where price oscillated for several sessions. This type of structure often serves as a re-accumulation zone during a trending market. What's particularly notable is the recent touch of the lower boundary of the range, which coincided with a retest of both the ascending trend line and the support zone around 1.1270 points. This confluence of technical factors makes the current area critical for further price development. Following the bounce from the support zone, the pair is showing early signs of recovery. The trend line has held firmly, and buyers stepped in with a reaction candle confirming demand interest. While EUR is not yet out of the consolidation, the structure suggests strength and potential continuation. Given the alignment of the upward trend line, support zone validation, and stabilization after the drop, I expect that EURUSD may climb almost toward the upper boundary of the consolidation. That's why my current goal lies at 1.1500. If you like my analytics you may support me with your like/comment ❤️

USDJPY: Bullish Continuation Confirmed?! 🇺🇸🇯🇵
USDJPY looks bullish after a test of a recently broken resistance.
The price formed a bullish imbalance candle on an hourly time frame
after its test and violated a resistance line of a bullish flag pattern then.
I believe that the pair will continue growing.
Goal - 145.8
❤️Please, support my work with like, thank you!❤️
I am part of Trade Nation's Influencer program and receive a monthly fee for using their TradingView charts in my analysis.

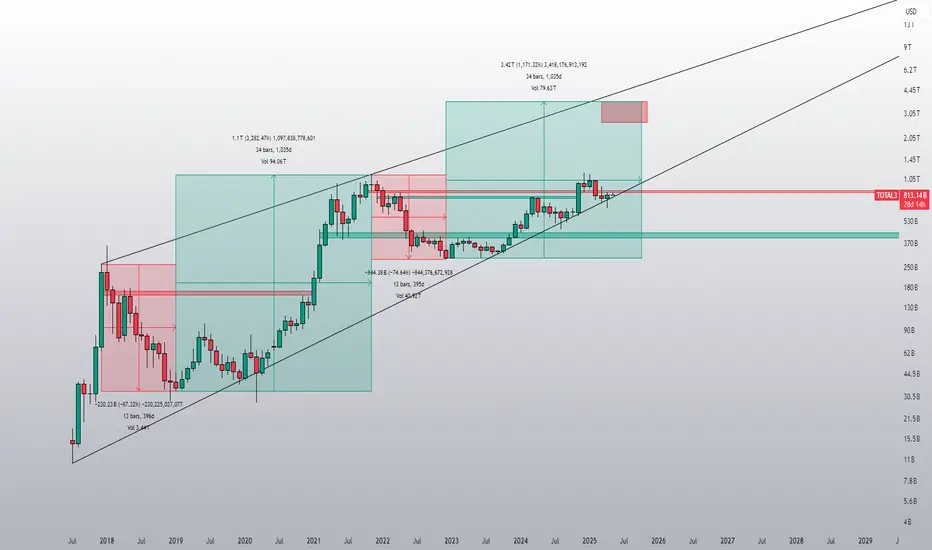
Are small caps about to bounce?TOTAL3 looks poised for a major upturn. Don't give up on Altcoin Season! No financial advice!

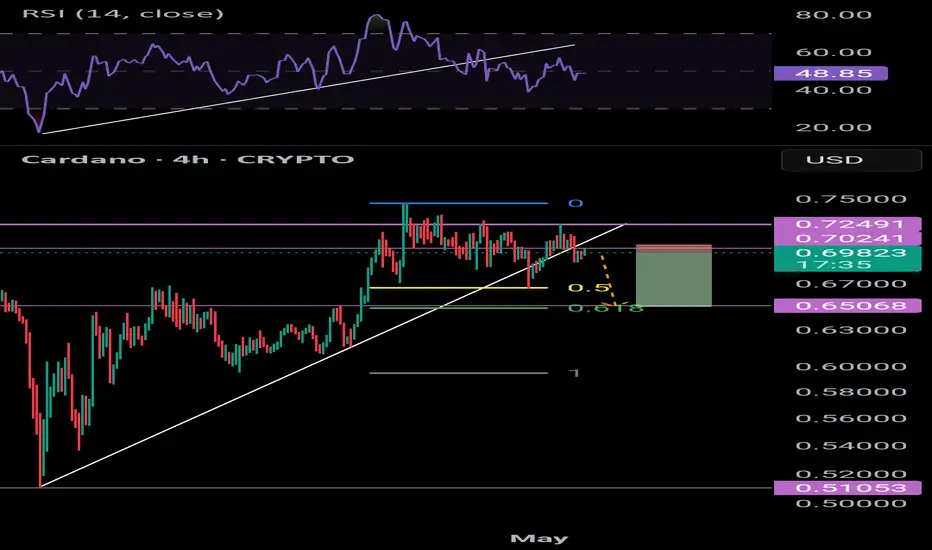
ADA uptrend brokenThe uptrend has broken for Cardano - fibonnaci retracement suggests next price level down will be @ 618 / $0.65
Move down = 6.5%
Shorting this you could set a TP @ $0.655
Bitcoin Range-Bound in Heavy Resistance – CME Gap Still Open!Bitcoin ( BINANCE:BTCUSDT ), like Gold , has been moving in a Range for the past 5-6 days and is currently in a Heavy Resistance zone($95,950-$88,500) , as it has been in the past few days .
In terms of Elliott Wave theory , Bitcoin appears to be completing a main wave 4 . The main wave 4 structure can take two forms: Double Three Correction(WXY)_Expanding Flat(3-3-5) .
I label this analysis " Short " for the following reasons:
Due to Bitcoin's higher correlation with the S&P 500 Index ( SP:SPX ) these days, I am short on the S&P 500 Index.
China’s president Xi Jinping says Trump lied about them having a phone call ; it is NOT good news for the S&P 500 Index and Bitcoin .
CME Gap($92,525-$91,415) has NOT filled yet, and I think Bitcoin will NOT start the next bullish rally before filling the CME Gap.
I expect Bitcoin to drop to at least $92,830 and then decline to the Support zone($92,000-$91,400) if the Support lines are broken.
Cumulative Short Liquidation Leverage: $96,741-$95,520
Note: If Bitcoin can touch $97,000, we should expect more pumping.
Note: If Bitcoin goes below the 100_SMA(Daily), we should expect a fall.
Please respect each other's ideas and express them politely if you agree or disagree.
Bitcoin Analyze (BTCUSDT), 1-hour time frame.
Be sure to follow the updated ideas.
Do not forget to put a Stop loss for your positions (For every position you want to open).
Please follow your strategy and updates; this is just my Idea, and I will gladly see your ideas in this post.
Please do not forget the ✅' like '✅ button 🙏😊 & Share it with your friends; thanks, and Trade safe.


BTC Elliot Waves I'm looking for at least one more high, but wave III could already reach that level.
