NASDAQ Bullish Breakout Above Channel;📈 Technical Analysis Overview
1. Breakout from Downtrend Channel
The price has clearly broken out of a descending channel, confirmed by a clean breakout above the upper trendline.
This is a bullish signal, indicating the end of the prior downtrend and the start of a possible uptrend or reversal.
2. Moving Averages (EMA 50 & EMA 200)
EMA 50 (Red): 18,965
EMA 200 (Blue): 19,409
Price is currently trading above both EMAs, which is another strong bullish indicator.
A bullish crossover (where EMA 50 crosses above EMA 200) is likely imminent if upward momentum continues—this would form a Golden Cross, further confirming bullish sentiment.
3. Structure and Market Behavior
After the breakout, price retested the breakout zone and showed a bounce, forming a higher low, which is characteristic of a bullish structure.
The chart includes projected price action with higher highs and higher lows—suggesting a bullish continuation pattern.
4. Volume & Momentum (Not shown but implied)
Breakouts are typically validated by volume. Although volume is not shown, the sharp upward movement and breakout above resistance suggest strong buying pressure.
🔍 Key Levels to Watch
Resistance: 20,000 psychological level; above that, 20,500–21,000 may act as resistance.
Support: 19,400 (near EMA 200), and 18,965 (EMA 50); a break below may invalidate the bullish setup.
📊 Conclusion
The chart shows a clear breakout from a descending channel, supported by the price moving above both key EMAs. The structure favors bullish continuation, especially if price holds above the 19,400–19,500 support zone. Upside targets lie around 20,500 to 21,000.
Trend Lines

Gold trend layout in the evening after the release of NFP data🗞News side:
1. Pay attention to the recent trade situation and news about the Fed's interest rate cuts
2. Be wary of DXY trends
3. The situation of the Russian-Ukrainian war and the follow-up events of the India-Pakistan conflict
📈Technical aspects:
The short orders in hand have already been profitable, and gold is now back near 3250, while the US dollar index has once again fallen by 100, reaching around 99.6, and the 1H moving average is currently showing signs of turning upward. The upper and lower shadow lines of the 1H K-line closing look like cross stars of equal length, which means that things may go wrong, and gold may rebound upwards in the short term. We can still focus on the resistance of 3260-3270 above, and further focus on the first-line resistance of 3280-3286, while the bottom has never been able to effectively break through the first-line support of 3240. If this week closes at 3240, then the market outlook next week will be conducive to long trading.
Intraday operation suggestions
🎁SELL 3260-3270
🎁TP 3245-3240
🎁BUY 3230-3240
🎁TP 3260-3270
If you agree with this point of view, or you have a better idea, please leave a message in the comment area. I look forward to hearing different voices.
OANDA:XAUUSD FX:XAUUSD FXOPEN:XAUUSD FOREXCOM:XAUUSD TVC:GOLD
CAD/JPY at Key Decision Zone: Breakout or Rejection?🕵️♂️ Chart Overview:
Instrument: CAD/JPY
Chart Type: Candlestick
Time Frame: Appears to be intraday (possibly 1H or 4H)
EMAs Used:
50 EMA (Red): 102.814
200 EMA (Blue): 102.710
📊 Key Zones Identified:
1. Immediate Zone (103.30 - 103.50)
Marked as: “Resistance + Support”
This is a key decision zone. Price has tested this region multiple times, showing it holds dual roles — a flip zone.
Price is currently testing this zone again. A break and retest above could confirm bullish momentum.
2. Upper Resistance Zone (104.80 - 105.50)
A broader supply area where previous strong selling pressure occurred.
This is the next logical target if price breaks and holds above 103.50.
3. Lower Support (101.29)
Strong horizontal support, clearly defined from previous lows.
If the price fails to break above the current zone, a rejection could lead to a move back down toward this support.
📈 Bullish Scenario:
Break above 103.50, with a successful retest confirming new support.
Momentum could carry price toward the 105.00–105.50 resistance.
Supported by 50 EMA crossing above 200 EMA (early sign of bullish crossover — Golden Cross).
📉 Bearish Scenario:
Rejection from the 103.30–103.50 zone could signal continuation of range-bound or bearish pressure.
Break below 102.00, followed by momentum towards 101.29 key support.
Would invalidate short-term bullish structure.
📌 Additional Technical Notes:
The chart shows consolidation between 102.00 and 103.50 — likely accumulation or re-accumulation phase.
EMAs are tightening, indicating a potential volatility expansion move is near.
Volume is not visible but would be useful to confirm breakout strength.
📍Conclusion:
CAD/JPY is currently at a critical decision zone. The next few candles will be key. Monitor:
Breakout direction
Retest confirmations
Momentum and volume indicators (if available)

Next up Nasdaq = US100 buy continues.if the correction wave ended at 0.5 fibo level which is current dip next target is new high. in shorter time timezones first targets are 19900 - 20250 - 22300

Tesla - The Next 7 Days Decide Everything!Tesla ( NASDAQ:TSLA ) is sitting at a crucial structure:
Click chart above to see the detailed analysis👆🏻
Despite the -60% correction which we have been seeing over the past couple of months, Tesla still continuously validates its overall uptrend. That's exactly the reason for my strong bullish thesis and the assumption, that after we see bullish confirmation, Tesla will reject the current support area.
Levels to watch: $250, $400
Keep your long term vision,
Philip (BasicTrading)

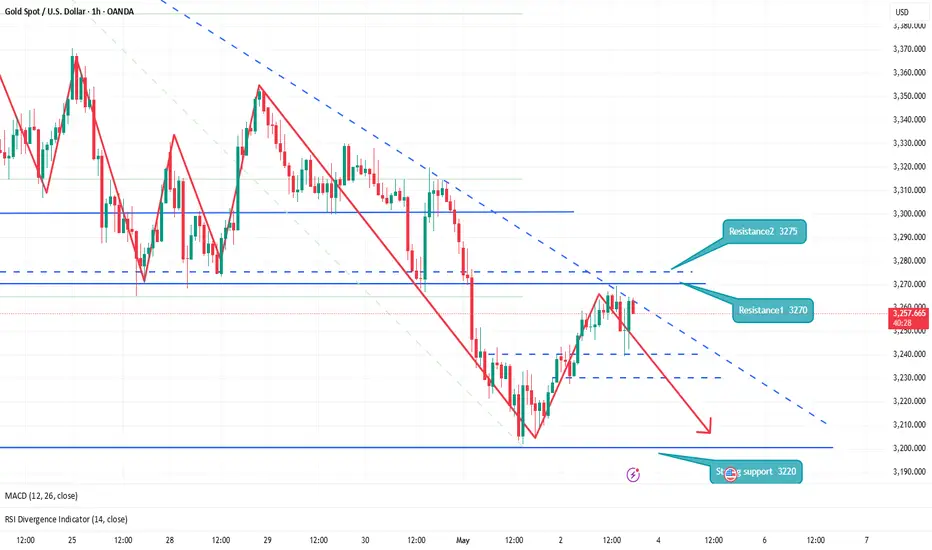
GOLD → Correction before NFP. What are the chances of a decline?FX:XAUUSD strengthens amid dollar correction. The market is correcting ahead of NonFarm Payrolls, trying to accumulate potential before high volatility.
Gold recovers ahead of US employment report
On Friday, gold rebounded from a two-week low, recouping some of its losses ahead of the release of US labor market data (NFP), which could set the tone for prices going forward. Amid optimism over trade talks and a strong dollar, gold ended its worst week in two months, but geopolitical tensions and a potentially weak jobs report could boost demand for safe-haven assets again.
The correction in the dollar gives gold a small chance to strengthen. However, fundamentally, the overall trend has already set the tone and gold may continue to fall.
Resistance levels: 3268, 3285, 3295
Support levels: 3227, 3204
The correction may reach a local zone of interest (money pool) — liquidity above 3270, or the 0.7 Fibonacci zone, after which the price may continue its course along the new trend — down to 3193.
However, unpredictable and unexpected data could disrupt the structure and push the price up to 3320-3350.
Best regards, R. Linda!

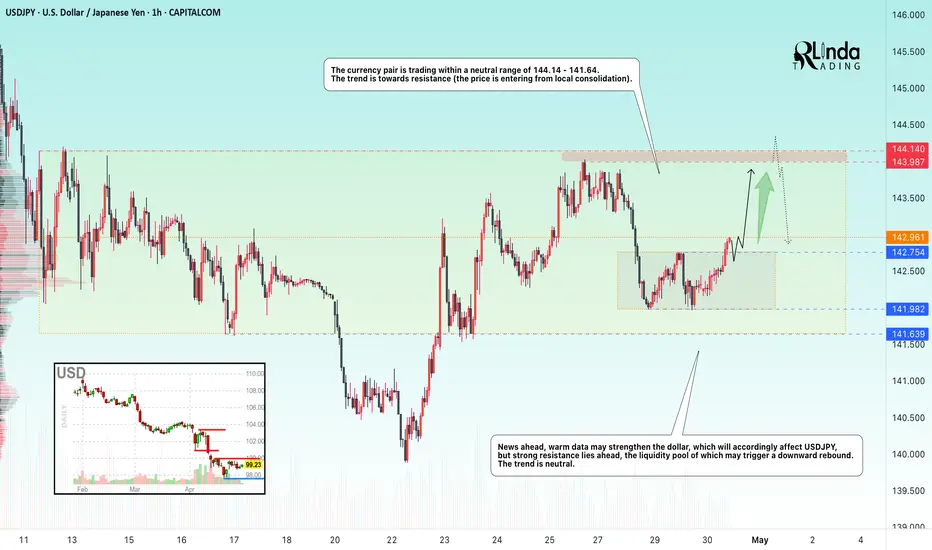
USDJPY → Price in range, retest of resistanceFX:USDJPY is emerging from local consolidation in hopes of seeing economic data that could support the dollar. The target for this movement could be the liquidity zone at 144.00.
The currency pair is trading within a neutral range of 144.14 - 141.64. However, a local consolidation has formed within the range, from which the price has broken out. The main task for the bulls is to hold the defense above 142.75, in which case we will be able to catch the price distribution to the upper border of the global range of 144.14.
News ahead, positive data may strengthen the dollar, which will accordingly affect USDJPY, but there is strong resistance at 144.14, whose liquidity pool may trigger a downward rebound. The trend is neutral.
Resistance levels: 143.9, 144.14
Support levels: 142.75, 141.98
There are no reasons to exit the global range. Over the past two weeks, this will be the first retest of the 144.14 zone, which in general only increases the chances of a false breakout and correction.
Best regards, R. Linda!
The decisive day of major data (BTCUSD)Yesterday, it was mentioned that the expectation of continuing to buy after a retracement of 96k was completely correct. Followers also made good profits.
BTCUSD bulls are still strong. The retracement is mainly long trading, which needs to be paid attention to at present. 96k/95k are both good buying opportunities.
TP98K-100K

The decisive day of major data (USOIL)
Yesterday, it was pointed out in the analysis circle: The support of 58 needs to be tested. Sure enough, buying at low levels continued to expand profits. The current price is 59.6. From the pressure analysis, the market is still affected by data that oversupply, and institutions will not reduce production in a short time. Therefore, oil prices will fall further,
The oil price broke through 59. Due to supply reasons, the market still has a downward range. 60-61 is a good choice to sell in succession.
tp58-57

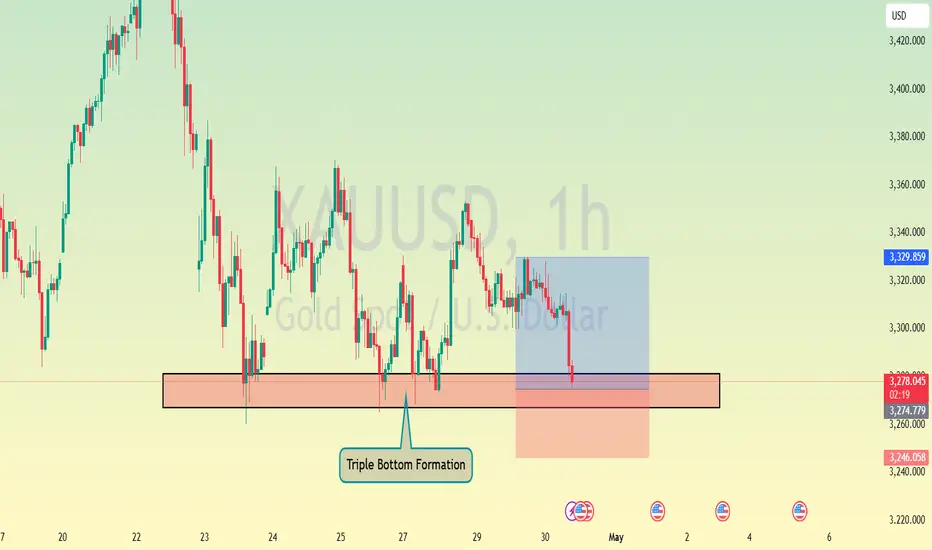
The decisive battle day of major data (XAUUSD/GOLD)
Yesterday, it was clearly pointed out that the pressure position after the rebound is 3255-3270. Today, due to the oversold influence of XAUUSD, it rebounded to a high of 3258. In terms of operation, it is still mainly chosen to sell. Today is the "third day" deadline. If the impact of geopolitics continues to be suspended. It is expected that XAUUSD will fall by $100/ounce today.
There have been some oversold rebounds in the Asian market XAUUSD. Beware of the market's inducement to buy more. So 3260-3270 continues to be mainly sold.
TP1 3230-3220.
TP2 3170-3160

Still in structure! Yet to break! As we can see despite the strong upmove in first half, it couldn’t close above the given structure hence we can still wait for the proper breakout and sustainment above the given structure for unidirectional move so plan your trades accordingly and keep watching everyone.

Non-agriculture ended perfectly, Today’s closing is key!📌Fundamentals:
The US April non-farm payrolls data (177,000 new jobs) exceeded expectations, reinforcing the Fed's expectations of a smaller rate cut. The market's expectations for rate cuts this year have been lowered from 90 basis points to 85 basis points, and the strengthening of the US dollar has suppressed gold prices.
📊Technical aspects:
From the 4-hour analysis, gold fell after the negative news of non-farm payrolls today, but gold bottomed out and rebounded, and continued to fluctuate. It feels that non-farm payrolls have gradually lost its charm, and the market is not as good as usual. However, today's closing is very critical, and it is also the key to whether gold will turn around. The non-farm payrolls market has basically finished, and the upper side continues to pay attention to the suppression of 3260-68, focusing on the suppression of 3290-95 above, and the short-term support near 3235-3240 below.
🎯Practical strategies:
1. Go short when gold rebounds at 3260-65, cover short positions at 3378-85, and target 3240-3245.

Ripple potential UpsidesHey Traders, in today's trading session we are monitoring XRPUSDT for a buying opportunity around 2.13 zone, XRPUSDT is trading in an uptrend and currently is in a correction phase in which it is approaching the trend at 2.13 support and resistance area.
Trade safe, Joe.

PLANETUSDT Breakdown After Wedge, Base Forming for Relief RallyFollowing its initial post-listing rally, PLANETUSDT concluded its impulsive ascent within a bearish rising wedge formation, a classical exhaustion pattern. The subsequent breakdown triggered a steep decline, extending well around the 200% Fibonacci extension level, reflecting a structurally violent markdown phase. This collapse established a new low before price found equilibrium within a clearly defined immediate demand zone.
Current price action suggests a potential bottoming structure, with the asset attempting to base and consolidate within this demand region. Should buyers maintain control and price manage a sustained breakout above the descending channel resistance, a corrective leg to the upside becomes increasingly likely.
The short- to mid-term recovery target is situated near the 0.0000090901 level, which coincides with the broader critical supply zone—a region marked by previous heavy distribution. This area is expected to attract significant selling pressure, presenting a likely inflection point for a renewed bearish phase or potential macro rejection.

Nvidia May Be Fighting HigherNvidia has been rebounding along with the broader market, and some traders may think it’s getting ready to accelerate.
The first pattern on today’s chart is the April 9 high of $115.10. The chip giant has challenged that level in the last two sessions. A close above that resistance may be viewed as confirmation of a breakout.
Second is the series of lower highs since mid-February. NVDA closed above that falling trendline yesterday and remains above it today.
Third, MACD has turned higher.
Finally, NVDA is a highly active underlier in the options market. (It averages 3.9 million contracts per day ranks first in the S&P 500, according to TradeStation data.) That could help traders take positions with calls and puts.
TradeStation has, for decades, advanced the trading industry, providing access to stocks, options and futures. If you're born to trade, we could be for you. See our Overview for more.
Past performance, whether actual or indicated by historical tests of strategies, is no guarantee of future performance or success. There is a possibility that you may sustain a loss equal to or greater than your entire investment regardless of which asset class you trade (equities, options or futures); therefore, you should not invest or risk money that you cannot afford to lose. Online trading is not suitable for all investors. View the document titled Characteristics and Risks of Standardized Options at www.TradeStation.com . Before trading any asset class, customers must read the relevant risk disclosure statements on www.TradeStation.com . System access and trade placement and execution may be delayed or fail due to market volatility and volume, quote delays, system and software errors, Internet traffic, outages and other factors.
Securities and futures trading is offered to self-directed customers by TradeStation Securities, Inc., a broker-dealer registered with the Securities and Exchange Commission and a futures commission merchant licensed with the Commodity Futures Trading Commission). TradeStation Securities is a member of the Financial Industry Regulatory Authority, the National Futures Association, and a number of exchanges.
Options trading is not suitable for all investors. Your TradeStation Securities’ account application to trade options will be considered and approved or disapproved based on all relevant factors, including your trading experience. See www.TradeStation.com . Visit www.TradeStation.com for full details on the costs and fees associated with options.
Margin trading involves risks, and it is important that you fully understand those risks before trading on margin. The Margin Disclosure Statement outlines many of those risks, including that you can lose more funds than you deposit in your margin account; your brokerage firm can force the sale of securities in your account; your brokerage firm can sell your securities without contacting you; and you are not entitled to an extension of time on a margin call. Review the Margin Disclosure Statement at www.TradeStation.com .
TradeStation Securities, Inc. and TradeStation Technologies, Inc. are each wholly owned subsidiaries of TradeStation Group, Inc., both operating, and providing products and services, under the TradeStation brand and trademark. When applying for, or purchasing, accounts, subscriptions, products and services, it is important that you know which company you will be dealing with. Visit www.TradeStation.com for further important information explaining what this means.

NKE at 52-Week Lows Oversold Giant or Value Trap?Nike is a blue-chip name going through a rough patch. But this recent dip, fueled by disappointing earnings and macro uncertainty, could present a classic oversold opportunity. The stock is now in a high-probability reversal zone where risk/reward becomes extremely attractive.
🎯 Updated Entry Plan:
$58.00 – Soft support zone; start building a position
$53.00 – Close to the 52-week low; likely strong bounce area
$50.00 – 49.00 Psychological round number and historical demand zone
📈 Target Levels
Profit
TP1: $68
TP2: $77.50
TP3: $88.50
Pro Tip: Nike doesn’t stay down forever. The brand is fundamentally strong. This is not a growth story right now, it’s a value + patience play.
📢 Disclaimer: This is not financial advice. Always do your own research, manage your risk, and never risk more than you’re willing to lose.

Gold is in the bullish direction after correcting the supportHello Traders
In This Chart GOLD HOURLY Forex Forecast By FOREX PLANET
today Gold analysis 👆
🟢This Chart includes_ (GOLD market update)
🟢What is The Next Opportunity on GOLD Market
🟢how to Enter to the Valid Entry With Assurance Profit
This CHART is For Trader's that Want to Improve Their Technical Analysis Skills and Their Trading By Understanding How To Analyze The Market Using Multiple Timeframes and Understanding The Bigger Picture on the Charts
Gold is in the Bearish DirectionHello Traders
In This Chart GOLD HOURLY Forex Forecast By FOREX PLANET
today Gold analysis 👆
🟢This Chart includes_ (GOLD market update)
🟢What is The Next Opportunity on GOLD Market
🟢how to Enter to the Valid Entry With Assurance Profit
This CHART is For Trader's that Want to Improve Their Technical Analysis Skills and Their Trading By Understanding How To Analyze The Market Using Multiple Timeframes and Understanding The Bigger Picture on the Charts

DJI: This looks huge!The Dow Jones has broken above its 125 year trend line and right now it looks like it may have a successful re-test, which could be huge.

ARKMUSDT Correction Structuring MidTerm RecoveryARKMUSDT has completed a complex corrective structure, terminating near a well-defined immediate demand zone where price action has begun to exhibit basing characteristics. The final leg into this zone coincided with the lower boundary of a descending broadening wedge, further reinforcing this region as a potential accumulation area.
Price is currently stabilizing above this demand zone, with the 0.840 level emerging as a pivotal structural resistance that must be reclaimed for bullish continuation. A successful breakout above this threshold opens the pathway toward 1.727, a mid-range liquidity target, and subsequently to the 3.798 zone, which aligns with the prior external supply zone and confluence of historical distribution.
Directional bias remains bullish while price holds above the immediate demand zone, though the level around 0.756 remains critical for directional validation. Any failure to sustain above this zone could see price cascading toward the lower strong demand region.

W.W. Grainger Inc. Stock Quote | Chart & Forecast SummaryKey Indicators On Trade Set Up In General
1. Push Set Up
2. Range Set up
3. Break & Retest Set Up
Notes On Session
# W.W. Grainger Inc. Stock Quote
- Double Formation
* Wave Feature On Flat Structure | Completed Survey
* ((No Trade)) - Invalid Short Set Up | Subdivision 1
- Triple Formation
* (EMA Settings)) Start At 942.00 USD | Subdivision 2
- Support & Resistance
* (TP1) | Subdivision 3
* Daily Time Frame | Trend Settings Condition
- (Hypothesis On Entry Bias)) | Indexed To 100
- Position On A 1.5RR
* Stop Loss At 107.00 USD
* Entry At 114.00 USD
* Take Profit At 126.00 USD
* (Uptrend Argument)) & No Pattern Confirmation
* Ongoing Entry & (Neutral Area))
Active Sessions On Relevant Range & Elemented Probabilities;
European-Session(Upwards) - East Coast-Session(Downwards) - Asian-Session(Ranging)
Conclusion | Trade Plan Execution & Risk Management On Demand;
Overall Consensus | Buy

Non-agricultural prospective data analysis Operation suggestions📌Fundamentals:
📊Technical aspects:
Technically, spot gold is in a downward trend in the short term, and there is a certain rebound or shock at the key support level. At the 4-hour level, the gold price is running above the lower track of the Bollinger Band, and the opening shows signs of contraction. The MACD indicator dead cross is gradually closing, and the RSI indicator is running in the 35-45 range, showing that the long and short forces are relatively balanced.
🎯Practical strategy:
3260-3270 light position short, target 3225-3200. When it reaches 3225-3200 and stabilizes, try to go long, target 3250-3270.
