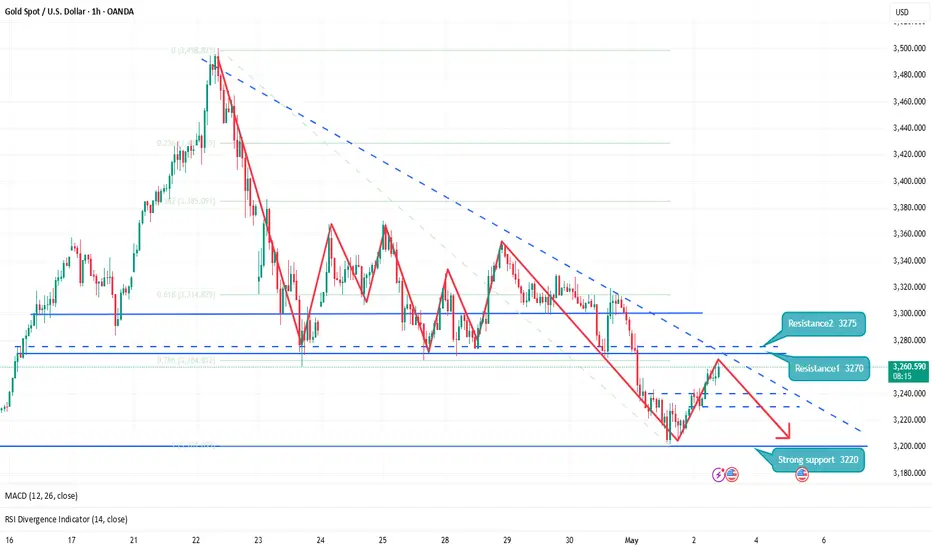
Gold is in the Bearish DirectionHello Traders
In This Chart GOLD HOURLY Forex Forecast By FOREX PLANET
today Gold analysis 👆
🟢This Chart includes_ (GOLD market update)
🟢What is The Next Opportunity on GOLD Market
🟢how to Enter to the Valid Entry With Assurance Profit
This CHART is For Trader's that Want to Improve Their Technical Analysis Skills and Their Trading By Understanding How To Analyze The Market Using Multiple Timeframes and Understanding The Bigger Picture on the Charts
Trend Lines

DJI: This looks huge!The Dow Jones has broken above its 125 year trend line and right now it looks like it may have a successful re-test, which could be huge.

ARKMUSDT Correction Structuring MidTerm RecoveryARKMUSDT has completed a complex corrective structure, terminating near a well-defined immediate demand zone where price action has begun to exhibit basing characteristics. The final leg into this zone coincided with the lower boundary of a descending broadening wedge, further reinforcing this region as a potential accumulation area.
Price is currently stabilizing above this demand zone, with the 0.840 level emerging as a pivotal structural resistance that must be reclaimed for bullish continuation. A successful breakout above this threshold opens the pathway toward 1.727, a mid-range liquidity target, and subsequently to the 3.798 zone, which aligns with the prior external supply zone and confluence of historical distribution.
Directional bias remains bullish while price holds above the immediate demand zone, though the level around 0.756 remains critical for directional validation. Any failure to sustain above this zone could see price cascading toward the lower strong demand region.

W.W. Grainger Inc. Stock Quote | Chart & Forecast SummaryKey Indicators On Trade Set Up In General
1. Push Set Up
2. Range Set up
3. Break & Retest Set Up
Notes On Session
# W.W. Grainger Inc. Stock Quote
- Double Formation
* Wave Feature On Flat Structure | Completed Survey
* ((No Trade)) - Invalid Short Set Up | Subdivision 1
- Triple Formation
* (EMA Settings)) Start At 942.00 USD | Subdivision 2
- Support & Resistance
* (TP1) | Subdivision 3
* Daily Time Frame | Trend Settings Condition
- (Hypothesis On Entry Bias)) | Indexed To 100
- Position On A 1.5RR
* Stop Loss At 107.00 USD
* Entry At 114.00 USD
* Take Profit At 126.00 USD
* (Uptrend Argument)) & No Pattern Confirmation
* Ongoing Entry & (Neutral Area))
Active Sessions On Relevant Range & Elemented Probabilities;
European-Session(Upwards) - East Coast-Session(Downwards) - Asian-Session(Ranging)
Conclusion | Trade Plan Execution & Risk Management On Demand;
Overall Consensus | Buy

Non-agricultural prospective data analysis Operation suggestions📌Fundamentals:
📊Technical aspects:
Technically, spot gold is in a downward trend in the short term, and there is a certain rebound or shock at the key support level. At the 4-hour level, the gold price is running above the lower track of the Bollinger Band, and the opening shows signs of contraction. The MACD indicator dead cross is gradually closing, and the RSI indicator is running in the 35-45 range, showing that the long and short forces are relatively balanced.
🎯Practical strategy:
3260-3270 light position short, target 3225-3200. When it reaches 3225-3200 and stabilizes, try to go long, target 3250-3270.

USDJPY: Bullish Trend Reversal?! 🇺🇸🇯🇵
USDJPY formed a strong bullish reversal pattern on a daily,
breaking the underlined daily resistance and confirming
a Change of Character CHoCH.
I believe that the pair will steadily return to a global bullish trend.
The price may grow at least to 147.0 level after a completion of a retracement.
❤️Please, support my work with like, thank you!❤️

APEUSDT WXY Correction and Long Accumulation SetupAPEUSDT has undergone an extensive corrective structure, which unfolds in a clear WXY complex pattern. The terminal point of this correction appears to have completed with a potential five-wave impulse to the downside, suggesting capitulation and a shift in directional bias.
The immediate demand zone, aligned with historical accumulation and confluence of prior reaction levels, presents a technically favorable area for strategic long accumulation. Price currently hovers near 1.4665, a critical level likely to act as a liquidity magnet and interim resistance before any substantial bullish continuation can materialize.
The structural roadmap anticipates a recovery phase, contingent on sustained demand within this zone. However, the final projected upside target aligns with the macro supply zone around 6.2213, where historical sell-side activity is expected to resume. This level is marked as the primary distribution zone and should be monitored closely for potential reversal setups or exit strategies.

ME Likely to Revisit 1.415 ZoneBased on the MissedPrice concept, rapid price moves often skip levels that price later revisits. The 1.415 level shows an Open Interest leap, suggesting missed positions.

USDCADRange Breakout: The pair has been trading within a range, and the breakout from this range signals potential bullish momentum. A breakout indicates that the price is ready to move out of its consolidation phase, with buyers now in control.
Trendline Breakout: The price breaking above a key trendline further confirms a shift from a bearish or neutral market sentiment to a more bullish one. This is a strong signal that upward momentum is building.

Trendzilla vs Chop Kong (EUR/JPY)The bias for EUR/JPY - in our view - is higher
On the weekly timeframe:
A) WMA has flattened out and price held above it B) downtrend line broken and held
On daily timeframe:
EUR/JPY just broke resistance for possible breakout trade up to the olf high to 166 - and possibly beyond
Thoughts ?

Maintain shock and short position before non-agricultural📌Fundamentals:
From the news perspective: the United States released a trade agreement and tariff reduction signal, the trade situation eased, resulting in a decline in market demand for safe-haven assets, triggering a sell-off in gold; the situation between Russia and Ukraine has eased, and the dawn of peace talks is approaching, which is a negative factor for gold; at the same time, the situation between India and Pakistan has heated up, which has supported the price of gold to a certain extent.
📊Technical aspects:
In the past few days, we have been emphasizing that gold should be bearish, and warned that gold is likely to break and fall sharply.
Gold, the general trend is as described in the continuous analysis. This round of price has fallen from the historical high of 3500. The first round of selling to 3260 rebounded to repair 3370; after rebounding to 3358 during the week, it weakened again, and the Asian market quickly sold off and fell below 3260. The subsequent analysis emphasized that the short-selling pattern of each cycle is good, and the shock bearish trend continued before the non-agricultural, and the target was adjusted to the parallel attack and defense range of 3193-3168;
European and American markets fluctuated and were bearish, which is in line with expectations; short-term resistance 3221, 3226, strong resistance 3231-3235; short-term support 3212, strong support 3202;
🎯Practical strategy:
It is recommended to rebound and sell: short near 3220-3230, target 10-15 points

How to layout gold before non-agricultural data🗞News side:
1. Progress in Sino-US tariff negotiations: The United States has recently contacted China through multiple channels, releasing signals that a trade agreement may be reached. Market concerns about trade friction have significantly cooled down, weakening the safe-haven appeal of gold.
2. The U.S. non-farm payrolls report for April will be released today (expected to add 130,000 new jobs). If the data is weak, it may strengthen expectations for an interest rate cut. On the contrary, if it is stronger than expected, the interest rate cut schedule may be further delayed.
📈Technical aspects:
Gold bottomed out yesterday and has now rebounded to around 3250. For the current market situation, the previous low of 3260-3270 has become an important resistance level above the gold price after the top-to-bottom conversion. In addition, non-agricultural data will be released in the U.S. market today. Therefore, if gold wants to reverse upward, the first resistance will be in the 3260-3270 range. If the counter pull from the bottom fails to stabilize at 3270, then there will be a downward trend. If it breaks through this resistance range, it may test the 3286 line. Before the release of non-agricultural data, the European market can be shorted when encountering resistance at 3260-3270. Everyone is waiting patiently for the opportunity to enter. The following focuses on the important support of 3200.
If you agree with this point of view, or you have a better idea, please leave a message in the comment area. I look forward to hearing different voices.
FART-The 200% Explosion That's About To Correct – PREPARE now
## The Most Deceptive Chart Pattern In Crypto Right Now 💣
The 4-hour FARTCOIN/USDT chart reveals a textbook example of parabolic extension that's setting up for a critical reversal. This explosive move (+13.93% today) has created the perfect storm for smart traders to position ahead of what appears to be an inevitable correction.
🔥 TECHNICAL ALARM BELLS SCREAMING:
💥 Triple Channel Overextension
* FARTCOIN trapped in powerful ascending yellow megaphone pattern
* Secondary gray channel providing momentum framework
* Price hitting upper boundaries of BOTH channels simultaneously
* Current price ($1.06284) testing resistance cluster
💥 Unsustainable Vertical Rally
* 200%+ gain from April lows ($0.35503) to current levels
* Extreme volume spike (634.2K) signaling potential exhaustion
* Parabolic acceleration far exceeding mean channel growth rate
* Candle structure showing early reversal signals at resistance
💥 Blue Forecast Path: The Smart Money Road Map
* Initial testing of $1.20 psychological resistance
* Multiple retests of the $1.00 psychological support
* Final capitulation toward $0.85-0.90 channel support area
Why This Pattern Is SIGNIFICANTLY More Important Than It Appears
This isn't just another correction—it's the classic "blow-off top" formation that has historically preceded major reversals in speculative assets. The confluence of technical factors suggests we're witnessing the final phase of a multi-week uptrend.
🧠 The Psychology Behind This Pattern:**
* Retail FOMO creating final buying surge
* Smart money distribution happening during high volume spike
* Divergence between price action and momentum indicators
* Pink consolidation zone formed perfect launchpad for final push
## The ACTIONABLE STRATEGY For Maximum Protection & Profit
For CURRENT HOLDERS:
* Consider taking partial profits above $1.10
* Set trailing stops at $1.03 to protect gains
* Prepare for 20-30% retracement possibility
For NEW POSITIONS:
* Primary entry zone: $0.88-$0.92 (lower channel support)
* Potential secondary entry: $0.98-$1.02 (psychological support)
* Invalidation point: Sustained trading above $1.20
Risk:Reward = 1:3 on counter-trend positioning
The Hidden Market Dynamics Few Are Noticing
The explosive move coincides with broader altcoin rotation and appears to be sector-specific rather than fundamentally driven. The technical pattern suggests institutional distribution rather than accumulation—a critical distinction for timing the reversal.

ETHUSD – Breaker Block Rejection in Play?Ethereum has been consolidating in a rising channel after failing to break below the 1754 support zone for weeks. Yesterday, price tapped into the 1854 resistance — which also aligns with a bearish breaker block — but failed to close above, showing two strong rejections so far.
Current Observation:
The 1854 level is holding up as resistance, and the most recent candles show weakness at that zone. If price fails to break and close above it, we could see a move back down toward the 1687–1694 support area.
What I'm Watching:
– A confirmed close below the breaker block zone around 1854 could trigger a short setup, with 1754 as the first target.
– If 1754 breaks, I’ll be eyeing the next zone between 1686.8 and 1694.1 for a potential take-profit zone or reaction.
Key Levels:
– Resistance: 1854 → 1881
– Support: 1754 → 1694 → 1687
If 1854 continues to reject price, I’ll be looking to go short on confirmation, targeting a drop back into the lower support zones.
But if we get a strong close above 1854, I’ll reassess for possible upside continuation.
Let’s see how it reacts.
Trade safe.
pClem Trades

GOLD (XAUUSD) Short Idea (Sell Limit)As we see in technicals, there is a major support which can became resistance (SBR) and there is a descending Trendline as well.
So For XAUUSD pair, my presumption is price going up to 3271-3276 level (may spike a little bit) then go down to the Previous day Low level at least.
let's see what GOLD shows us.
If price closes 1H over 3285, then the setup is failed.
GOOD LUCK!

CADUSDT Ending Diagonal Completion Could Ignite Structural ShiftCADUSDT correction appears to be approaching a critical juncture, with a well-defined ending diagonal structure suggesting that wave 5 is nearing completion. This projected fifth leg presents a technically sound accumulation zone, and a successful breakout from the diagonal pattern is likely to initiate a significant bullish move toward the internal supply zone (ISZ).
The expected path, outlined on the chart, anticipates initial rejection at the ISZ before a possible continuation breakout propels price toward the final projected target an area where major distribution and potential sell-off could emerge.
The long-term trendline extending from the previous all-time high remains a pivotal structural element and must be closely monitored as it continues to guide broader market sentiment.

GRTUSDT Triangle Coil Tension Builds Bullish Breakout in FocusGRTUSDT is forming a clean symmetrical triangle with price rebounding from the lower trendline which brings an encouraging signal for potential continuation to the upside.
As long as the structure holds, we anticipate a breakout above the triangle, which could ignite strong bullish momentum. The external demand zone remains ideal for strategic accumulation, while the internal supply area should be monitored for signs of short-term rejection.
If buyers absorb pressure at that level, GRT could rally toward the crucial upper supply zone, which marks the next major area for distribution. Let’s see how this unfolds, feel free to share your perspective.

Shorting XTIUSD Took me 2 years to actually understand trend is your friend and Fib don't lie
Clear short

GBPJPY: Consolidation Phase Targeting the Main TrendHey Traders, in today's trading session we are monitoring GBPJPY for a buying opportunity around 189.600 zone, GBPJPY is trading in an uptrend and currently is in a correction phase in which it is approaching the trend at 189.600 support and resistance area.
Trade safe, Joe.

$NIVF 70x Long Target NASDAQ:NIVF is also spliting 1/10 of their stock
Target: 0.5390
Entry: 0.3230
Stoploss: 0.2817

$ELAB Long 250xNASDAQ:ELAB is very undervalued stock with PS ratio of 0.015 and PB ratio of 0.15 It has recently hunted everyone's stoplosses and gained liquidity.
Target: 9.60
Entry: 2.29
SL: 2.07

USOIL – Buyers Might Be Waking UpFrom last week, USOIL dropped aggressively from the 65.27 resistance zone and hit our 57.00 support target — a level we’ve been watching closely.
Now here’s where it gets interesting…
Current Observation:
The 57.00 support seems to be holding strong.
We’re starting to see signs that sellers might be losing momentum around this zone.
Price has reacted with a bounce, and if it sustains above 57.00, we could see the buyers step back in.
What I'm Watching:
– A confirmed hold above 57.00 could offer a buy opportunity, targeting to see a break above 59.5 first, then possibly 61.8 – 62.0.
– However, if 57.00 breaks, I’ll be shifting bias back to the downside, watching 55.10 next.
Key Levels:
– Support: 57.00 → 55.10
– Resistance: 59.5 → 62.0 → 65.27
At this point, it's all about how price reacts around 57.00 and 59.50.
A bounce and strong close above? I’ll be looking to go long.
Failure to hold? The sell pressure might continue.
Let’s see how this plays out. Trade safe.

USOIL trading alerts. Pressure and support.Oil also fell according to instructions. I just forgot to remind you. Sorry, but the profit is quite good. Sell short from 58.7. Then the lowest reached 56.34
But today in the New York market, USOIL rose again above 58. From a fundamental perspective. The market will continue to fall under pressure. But from the trend, we need to pay attention to the support of 58. If it does not fall today, it is likely to continue to fall based on Friday's trend. The pressure level near 59 needs to be paid attention to. In terms of operation, it is still mainly selling at high levels.
Always remind trading risks. So don't ignore this. If you don't know how to trade. Remember to wait and see. Don't trade blindly or gamble.
Many investor friends know that I have led some investors to create good profits for several consecutive days. If you don't know how to trade, remember to leave me a message and try it. Maybe your profit will double.
