Bitcoin - All Time Highs Are Inevitable!Bitcoin ( CRYPTO:BTCUSD ) is still massively bullish:
Click chart above to see the detailed analysis👆🏻
Despite the correction of about -30% which we have been seeing lately, Bitcoin remains in a bullish market. Even if we see another drop of about -20%, this will still just turn into a textbook bullish break and retest and either way, new all time highs will follow on Bitcoin.
Levels to watch: $70.000, $400.000
Keep your long term vision,
Philip (BasicTrading)
Trendlineanalysis

Gold shocks pull the trend towards the bearish side!Gold market trend analysis:
Gold technical analysis: You should have seen the exaggeration of gold, right? Gold has also experienced several major ups and downs in history, but this time is definitely one that can be recorded in the history books. The daily lines in the past few months are very exaggerated, and the rise and fall range is unprecedented. Just today's Asian market, a simple dive is dozens of points. This is the market. The market is always right. We need to respect it the most, rather than blindly look at it subjectively. Surviving in such a big market is the most important thing. Many times, the fluctuation of gold is basically not related to technicality. We try to follow the direct pursuit mode in operation, and we can catch big profits in such a big market. Last week, the weekly line closed with a big tombstone, the weekly line top appeared, and the air force appeared. In May, gold will at least adjust to around 3,000.
The above is the 4-hour pattern, which is repairing below the moving average. If the bulls break 3370 again, there is a possibility of rising again. Otherwise, gold will adjust deeply again. This wave of adjustment is at the weekly level. The daily pattern is also turning into a peaking mode. Note that the rise and fall of gold is not based on technical aspects, but more on fundamentals and big data, as well as the impact of tariffs. Without these influences, we will be bearish this week. If the decline of the big C wave continues, the target will be 3230 (the half point of the entire April rebound) in turn. 3165 is the Fibonacci 61.8 position of the callback and also the previous high point, which is easy to form a rebound. Today's gold focuses on two major suppressions, one is the hourly suppression around 3300, and the other is 3315 and 3328, both of which are opportunities for air forces. On the whole, today's short-term operation strategy for gold is to short on rebounds and to buy on pullbacks. The upper short-term focus is on the 3298-3300 resistance line, and the lower short-term focus is on the 3265-3260 support line. Friends must keep up with the rhythm. It is necessary to control the position and stop loss, set stop loss strictly, and do not resist single operation. The specific points are mainly based on real-time intraday trading. Welcome to experience, exchange real-time market conditions, and follow real-time orders.

Will the EUR/USD find support and rally or give up it's run?In this video I go over EUR/USD, GBP/USD, USD/JPY, NVDA & SPX.
With an overall bearish outlook on the U.S. Dollar, I'm watching for support to hold above 1.1200 on the EUR/USD in order to continue the rally.
Although a pullback was expected after an aggressive up move over the span of 3 weeks, this will be interesting with a good amount of economic data set to release beginning on Tuesday.
We'll see if Bulls hold up or if Bears decide to show some strength.
As always, Good Luck & Trade Safe.

Tesla - This Is Actually Not Gambling!Tesla ( NASDAQ:TSLA ) still looks quite bullish:
Click chart above to see the detailed analysis👆🏻
Just a couple of weeks ago I published a bunch of analysis, explaining all the reasons for a potential -40% drop on Tesla. However on the higher timeframe, Tesla still looks quite strong and with the bullish break and retest playing out so far, we could even see new all time highs soon.
Levels to watch: $260, $400
Keep your long term vision,
Philip (BasicTrading)

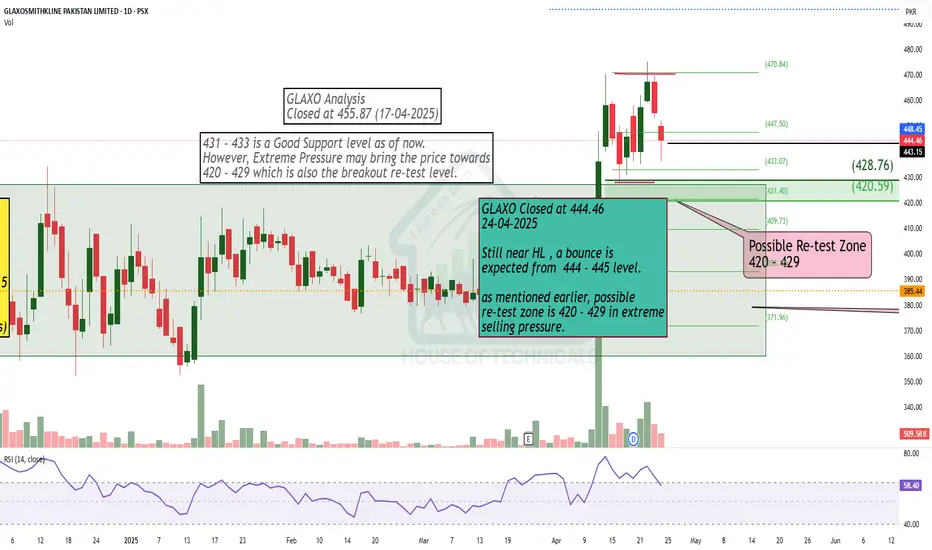
Near HL
Still near HL , a bounce is
expected from 444 - 445 level.
as mentioned earlier, possible
re-test zone is 420 - 429 in extreme
selling pressure.
GOLD ( XAU:USD) : Potential Bearish Pennant + Correction WaveGood morning, traders.
Please note, this is Not Financial Advice (NFA) —always conduct your own research and risk management.
1. Technical Analysis
We are currently observing the formation of a potential bearish pennant, with price action consolidating between converging trendlines. This formation appears to align closely with the Elliott Wave correction structure, particularly within the A-B leg. The apex of the pennant lies just after wave (B), suggesting a potential breakdown into wave (C), completing the corrective sequence.
Should this pattern confirm, we could anticipate a continuation of the downward movement, targeting deeper support zones in line with previous wave (4) levels.
2. Trend Structure
Wave (5) appears to have completed, initiating the A-B-C correction.
The corrective leg A → B is now complete, with price action consolidating near the upper resistance of the pennant.
A breakdown below the lower support trendline could confirm wave C in motion, reinforcing the bearish outlook.
3.) Macro Environment & Market Sentiment
Recent developments from the U.S. administration have introduced uncertainty in macroeconomic policy:
Tariffs:
Former President Donald Trump has hinted at a potential rollback of the 145% tariffs on Chinese goods, acknowledging their long-term unsustainability. Treasury Secretary Scott Bessent clarified that any changes would be part of bilateral negotiations and not unilateral actions. Major U.S. retailers have raised concerns over ongoing supply chain disruptions, adding pressure to de-escalate trade tensions. However, Trump insists tariffs won’t be eliminated completely, signaling no immediate resolution.
Federal Reserve Leadership:
Trump also walked back earlier statements threatening to dismiss Federal Reserve Chair Jerome Powell, now affirming that Powell will serve out his term until May 2026 . While this move has slightly calmed markets, Trump continues to pressure the Fed to lower interest rates amid persistent inflationary concerns. Although this softening stance introduces a degree of stability, the underlying tension between fiscal and monetary authorities remains.

Nvidia - The Chart Just Told Us So!Nvidia ( NASDAQ:NVDA ) might just still head a little lower:
Click chart above to see the detailed analysis👆🏻
After Nvidia perfectly retested the previous rising channel resistance just a couple of months ago, it was quite expected that we'll see a retracement. The overall trend however still remains bullish and if Nvidia drops a little more, the overall bullrun continuation rally might just follow.
Levels to watch: $80
Keep your long term vision,
Philip (BasicTrading)

Bitcoin - This Is Just Unbelievable!Bitcoin ( CRYPTO:BTCUSD ) is not dropping at all:
Click chart above to see the detailed analysis👆🏻
After we have been seeing one of the craziest weekly drops which I have experienced in my entire trading history, all major cryptos and especially Bitcoin are strongly holding their levels. Since bullish strength continues quite often, I do expect new all time highs on Bitcoin soon.
Levels to watch: $70.000, $300.000
Keep your long term vision,
Philip (BasicTrading)

S&P500 - The Correction Is Over Now!S&P500 ( TVC:SPX ) is retesting massive support:
Click chart above to see the detailed analysis👆🏻
Over the past couple of days, we have been seeing a quite harsh stock market "crash" with an overall correction of about -20%. However, as we are speaking the S&P500 is already retesting a major confluence of support and if we see bullish confirmation, this drop might be over soon.
Levels to watch: $4.900
Keep your long term vision,
Philip (BasicTrading)

Bearish Divergence has started appearing
Bearish Divergence has started appearing
on Bigger Tf.
Channel Top is also there.
Stay Cautious.
Sudden Spike can be witnessed till 1450 - 1500
but that would be a Risky Trade to take.
So Better to wait till the Bearish Divergence
plays & bring the price down & settle (may be)
around 1000 - 1050

Trend Support and 18M AVWAP: Our Final Stronghold📜 Field Orders – Operation: Defensive Line
Troops, listen up.
We’re falling back to our key defenses—Trend Support and the 18M AVWAP.
Hold your ground.
Do not charge.
We wait.
🎯 Your Orders:
Stand down unless support is broken cleanly with force.
If the red army pushes through and confirms—join the short side.
Enter only with structure, never emotion.
Protect your treasures—capital is your ammunition. Don’t waste it fighting in the chop.
If this is a trap, and you’re caught in it—retreat immediately.
Take the loss. Regroup. Redeploy with strength and clarity.
If we bounce here—watch for signs of a counteroffensive near the AVWAP wall.
But again—only enter with confirmation. Not hope.

UltraTech Cement Ltd is testing a strong resistance level aroundA breakout above this zone with volume confirmation may trigger a bullish move, making it a buy recommendation if it closes above ₹11,850. The next target would be ₹12,050, with a stop loss at ₹11,690. However, if the price gets rejected at resistance, it could lead to consolidation—so wait for a decisive breakout before entry.
for educational purposes only

Sudarshan Chemical Industries📊 Chart Highlights:
Current Price: ₹1,023
Fibonacci Resistance: Price is approaching the 0.618 Fib level at ₹1,027.60, which is a key resistance.
Box Range: Trading within a consolidation box (approx. ₹940–₹1,030) — currently testing the upper end of the range.
Volume: Volume is moderate; not a strong breakout candle yet.
RSI: Trending upwards, nearing overbought (above 60), positive momentum.
Heikin Ashi Candles: Showing bullish strength.
✅ Recommendation: BUY (on confirmation)
📌 Buy Entry:
Buy above ₹1,035 only on breakout confirmation with volume (i.e., daily close above ₹1,035).
🎯 Targets:
Target 1: ₹1,090 (Fib 0.786 level)
Target 2: ₹1,170 (Fib 1.0 level)
Target 3: ₹1,270 (Fib 1.272 extension)
❌ Stop Loss:
Place SL around ₹980 (just below the Fib 0.5 level and EMA cluster)
⚠️ If Rejected at ₹1,030:
Consider range trading: Sell near ₹1,030 with target ₹940–₹950 and SL ₹1,040.
Wait for a clean breakout or breakdown before taking large positions.

Bitcoin - This Is Just Wonderful!Bitcoin ( CRYPTO:BTCUSD ) creates textbook market stucture:
Click chart above to see the detailed analysis👆🏻
The entire stock market is selling off significantly but Bitcoin and most cryptocurrencies are still holding their strong levels. This is clearly a sign of bullish strength and even if we see a retest of the previous all time high, the overall uptrend remains perfectly valid over the next months.
Levels to watch: $70.000
Keep your long term vision,
Philip (BasicTrading)

EURJPY still bullish view
OANDA:EURJPY first analysis attached, in new analysis, we have new structures created (BULLISH FLAG, ZONE, TREND LINE), both pairs dominant in market, personally here still bullish i am.
SUP zone: 160.350
RES zone: 163.400, 164.100

MRP Agro Ltd shows strong fundamentals with significant revenue MRP Agro Ltd shows strong fundamentals with significant revenue and profit growth, high ROCE (39.2%) and ROE (30.3%), and is almost debt-free, making it a financially sound company. Technically, the stock has bounced from a support zone with a bullish breakout from a falling wedge pattern, suggesting potential upside. Based on both technical and fundamental analysis, a buy is recommended with a target of ₹160 and a stop loss at ₹120, for a short- to medium-term horizon (3–6 months). However, investors should monitor liquidity and watch for dividend announcements.
for educational purposes only

Google - Fantastic Bullish Break And Retest!Google ( NASDAQ:GOOGL ) just looks amazing:
Click chart above to see the detailed analysis👆🏻
For more than a decade, Google has been trading in a rising channel formation, perfectly respecting all market structure. Now, Google is about to retest the previous all time high once again and with a sharp correction of about -25%, this offers a significant bullish reversal setup.
Levels to watch: $150
Keep your long term vision,
Philip (BasicTrading)

Nasdaq Technical Analysis. What Makes Nasdaq a Trader’s Favorite📊 Nasdaq Technical Analysis – Week 15, 2025
This week’s Nasdaq structure suggests a high probability of sideways movement between 19,500 and 18,700,
despite recent macro-driven volatility.
Key headlines include: – U.S. tariff adjustments & China’s 125% retaliation
– March CPI hitting the lowest level since early 2021
– Bond market instability and capital outflows
From a technical perspective:
🔹 volatility on the weekly is overheated — suggesting reduced volatility ahead
🔹 Fibonacci 0.618 near 20,084 may act as short-term resistance
🔹 Ideal long zone sits between 18,600 and 18,700, with invalidation below 18,500
(by 12H closure)
🔹 Ideal long zone sits between 18,000 and 18,300, with invalidation below 17,900
(Just a touch of 17,900 might invalidate this idea)
This analysis includes trendline setups held since 2023, confirming the value of clean charting.
A full structure review from Yearly to 4H charts is included.
No news-based guesswork. Just structured, chart-driven insight.
📌 If this chart aligns with your bias, feel free to save, comment, or follow.

Ethereum - The Perfect Crypto Trade!Ethereum ( CRYPTO:ETHUSD ) is retesting massive support:
Click chart above to see the detailed analysis👆🏻
For the past four years, Ethereum has overall been trading sideways with significant swings towards the upside and downside. As we are speaking, Ethereum is retesting a significant confluence of support and if the bullrun actually continues, Ethereum will rally parabolically.
Levels to watch: $2.000, $4.000
Keep your long term vision,
Philip (BasicTrading)

Why make it too complicated?!!Find the trend, follow the trend and stay on the trend. If can't find the trend then wait, trading is a marathon and not sprint.

Dow Jones - Value Is The King Of 2025!Dow Jones ( TVC:DJI ) withstands all bearish struggles:
Click chart above to see the detailed analysis👆🏻
All major U.S. indices have been weakening lately but the Dow Jones is clearly the strongest of all. It seems like big institutions are shifting back to value stocks and therefore the Dow Jones remains very strong. Looking at technicals, this trend is rather likely to continue during 2025.
Levels to watch: $40.000, $50.000
Keep your long term vision,
Philip (BasicTrading)

Weekly CLosing is ImportantWeekly Closing above 26.70 would be
very positive. However, 29 - 29.20 is
the Immediate Resistance Level.

XAUUSD Daily Sniper Entry Plan – April 10, 2025 Multi-Timeframe Analysis (D1, H4, H1, M15)
D1: Bullish overall with higher highs and higher lows, price testing resistance near the 3100 area.
H4: Bullish continuation with clear market structure, price still finding support at lower levels.
H1: Structure showing a potential breakout to the upside but also needs confirmation from rejection at supply zones.
M15: Currently in a retracement, testing critical order block zones that could dictate the next big move.
Macroeconomic Context
Fed Rate & NFP: The Fed's dovish stance and recent NFP data support the continuation of bullish sentiment in gold.
CPI & ISM: Inflationary pressures remain, supporting demand for gold, and driving market uncertainty that adds to gold’s safe-haven appeal.
Trend Bias
Bullish Bias: The market is overall bullish, but be cautious around key resistance zones. Look for confirmation of breakouts or pullbacks before entering.
Bearish Bias: If price fails to break above key resistance, a correction could occur, targeting the identified sell zones.
Liquidity Zones & Imbalances
The zones at 3,035-3,040 and 3,066-3,068.50 represent significant demand and order block areas where price has previously reacted. These are prime for buy entries.
Keep an eye on 3,125-3,139 as the potential sell zone, where price has shown previous rejection.
💰 Key Zones
🟩 Buy Zones (Potential Bounce Zones):
🛒 3,066–3,068.50: Sweet spot for a bullish bounce! 📉
🛒 3,035–3,040: Deep value zone! If we get a bounce here, it’s gold! ✨
🟥 Sell Zones (Potential Reversal Zones):
🚫 3,125–3,139: Major resistance, could trap bulls! ⛔
🚫 3,095–3,108: Intraday fade; short potential here! 💥
🎯 Sniper Entries
🟩 Buy Scenario 1 – “Reclaim the Bounce”
📍 Entry: 3,066–3,068.50
💡 SL: Below 3,055
🎯 TP: 3,089 | 3,113.50 | 3,127
🧠 Trigger: Look for CHoCH or Bullish Engulfing on M1/M5 for confirmation.
🟩 Buy Scenario 2 – “Deep Value Pullback”
📍 Entry: 3,035–3,040
💡 SL: Below 3,025
🎯 TP: 3,080 | 3,095 | 3,110
⚡ Tip: Wait for a strong bullish reaction on M5/M15.
🟥 Sell Scenario 1 – “Double Top Trap”
📍 Entry: 3,125–3,139
💡 SL: Above 3,145
🎯 TP: 3,105 | 3,080 | 3,055
⚠️ Tip: Look for a rejection on M5 or M15, with a bearish engulfing.
🟥 Sell Scenario 2 – “Intraday Fade”
📍 Entry: 3,095–3,108
💡 SL: Above 3,110
🎯 TP: 3,080 | 3,060 | 3,040
⚡ Tip: Move SL to breakeven once TP1 hits quickly! 🏃♂️💨
⚠️ Trend Bias
📉 Bearish Short-Term: Watch for rejections at resistance. If the price pushes above 3,139, we may reconsider the bias. 💡
💥 Key Tips & Reminders:
🎯 Patience is Key: Wait for confirmation before entering any trades — no confirmation, no entry! 🕰️
🚀 Risk Management: Keep your SL tight, and only enter when you feel the setup is perfect! 🔥
💡 Be Smart, Trade Smart: Always manage your risk and stick to your plan. 🌟
🔔 Join the Community!
👍 Like this post if you found it useful!
💬 Comment with your thoughts or ask questions below!
🔔 Follow for more precise daily setups!
🔔 Subscribe to stay updated with the latest trading plans!
Stay sharp, stay kind, and let’s trade with precision! 💛
