ETH/USDT 1H Chart: Breakout on the Horizon? Hey Ethereum traders! Let’s dive into this 1-hour ETH/USDT chart.
I didn’t manage to post in time, and ETH has made its move — unfortunately, it’s not the one we hoped for!
We had a classic triangle forming, with ETH consolidating between converging trendlines. The price was sitting around $1,803.65, teasing the daily high resistance at $1,842.89. I thought about a potential breakout toward the weekly high of $1,864.20, but instead, ETH broke below the triangle’s support line!
Now that the breakdown has happened, we’re likely heading toward the weekly low at $1,754.28, or even the breakdown target of $1,691.30.
Key Levels to Watch:
Resistance: $1,842.89 (daily high), $1,864.20 (weekly high)
Support: $1,780.47 (daily low), $1,754.28 (weekly low)
Breakdown Target: $1,691.30
The bears have taken control for now — where do you think ETH is headed next? Let’s discuss below!
Triangle

USDCHF short: Sellers Getting Ready to DominateAfter a strong impulse from buyers, we saw exhaustion near the highs. Price retraced to a major support zone, but instead of a strong bounce, we got a tight, controlled accumulation range.
the higher timeframe, i.e 4H is in a strong downmove
What’s interesting is the structure within that box: the breakout attempts are weak, volatility is contracting, and there’s a noticeable lack of bullish follow-through—just coiling.
Smart money doesn’t chase—they trap. This triangle near key support is exactly where larger players hide intentions behind "indecision." But to me, the silence screams. This doesn’t look like preparation for a markup—it feels like a setup for distribution under the disguise of consolidation.
I’m anticipating a sellers' takeover.
Entry Idea: Short on breakdown of triangle structure or on a faker as shown on the chart
Stop: Above false breakout wick
Target: Near 0.80408 (based on prior imbalance + clean levels below)
Risk-reward speaks for itself.
Let’s see if the tape reveals what I believe it’s been hiding in plain sight.

NEAR/USDT 1H Chart: Breakout or Breakdown?Hey crypto traders! Let’s zoom into this 1-hour chart, because NEAR is serving up some serious action!
We’ve got a massive triangle forming, with the price squeezing tighter and tighter between converging trendlines. NEAR is currently dancing around $2.466, teasing a breakout after bouncing between resistance at $2.729 and support at $2.419. This pattern is a pressure cooker, and a big move is coming — will it soar to new highs or crash back down?
A bullish breakout above the upper trendline could propel NEAR past $2.610, potentially targeting $2.729 or higher! But if it fails to hold support at $2.540, we might see a dip toward $2.419 or even lower.
Key Levels to Watch:
Resistance: $2.610
Support: $2.540
Breakout Target: $2.729+
Breakdown Risk : $2.419
What’s your take — bullish surge or bearish pullback? Let’s hear your predictions below!

GOLD → Consolidation ahead of news. What to expect?FX:XAUUSD is consolidating. Focus on 3370 - 3269. Economic data is expected tomorrow, and gold is likely to trade within the consolidation range for several days.
Optimism about US trade talks with key partners boosted risk appetite and supported the dollar. The US Treasury Secretary reported progress with India, while President Trump softened his rhetoric on China, which also strengthened the dollar. At the same time, traders took a wait-and-see stance ahead of the release of US GDP data for the first quarter. If the figures turn out to be weak, gold could rise sharply as a safe-haven asset. Thus, the gold market remains sensitive to trade news and macro data, especially against the backdrop of rebalancing at the end of April.
At the moment, as part of the current momentum and correction, I expect prices to recover from the 0.5 - 0.7 Fibonacci zone. Gold may test 3323-3325 before resuming its correction within the consolidation.
Resistance levels: 3323, 3352, 3370
Support levels: 3290, 3270
Traders are waiting for a resolution in the tariff dispute as well as economic data due tomorrow. However, while the price is consolidating, I expect a rebound from support. BUT! If the price continues to squeeze towards any boundary, with priority to support, then the chances of a breakout from the consolidation base may increase.
Best regards, R. Linda!

NZDCHF → The global bearish trend may continueFX:NZDCHF has been within a local upward wedge pattern for a long time. A breakout of support could trigger a continuation of the downtrend.
After breaking through the wedge support, the currency pair is one step away from the start of the realization. The focus is on consolidation at 0.4982 - 0.4919. A breakout of support could trigger a decline in the currency pair amid a weakening NZD and a rising dollar index, which overall creates a negative backdrop for the pair.
A retest of the previously broken boundary of the figure or resistance at 0.4953 is possible before the decline continues, but a consolidation of the price below 0.4918 will be a good signal for the start of the movement.
Resistance levels: 0.4953, 0.4981
Support levels: 0.4918, 0.4872
Trend pressure plays an important role, as does the fact that the price is coming out of a wedge consolidation. The breakout is directed towards the main trend, and price consolidation below the key support will only confirm this.
Best regards, R. Linda!

BTC/USDT 1H Chart Analysis: Breakout Incoming?Hey traders! Let’s dive into this juicy BTCUSDT 1-hour chart. Bitcoin is teasing us with some serious action!
We’ve got a textbook symmetrical triangle pattern forming, with price consolidating tightly between converging trendlines. This is a classic setup for a big move — Bitcoin is coiling up like a spring, ready to explode!
The chart shows multiple phases of consolidation , with the latest triangle pushing BTC toward a critical decision point near the weekly high of $95,773.15 and the monthly high of $95,119.06.
The price is currently hovering around $95,000, testing resistance. A breakout above the upper trendline could send BTC soaring past $96,600, potentially targeting $97,200 or higher!
On the flip side, a rejection here might see it dip toward the daily low of $92,839.27 or even the lower trendline for support.
Key Levels to Watch:
Resistance: $95,773.15 (weekly high)
Support: $92,839.27 (daily low)
Breakout Target: $97,200+
Breakdown Target: $92,800
✉ What do you think — bullish breakout or bearish?
Drop your thoughts below!

EURO - Price can bounce up of support level to top part of flatHi guys, this is my overview for EURUSD, feel free to check it and write your feedback in comments👊
Some time ago price traded inside a triangle, where it broke $1.0920 level and then made a correction to this level.
Then price exited from triangle pattern, retesting and then made upward impulse to $1.1310 level, which coincided with support area.
Next, Euro started to traded inside flat, wher it soon broke $1.1310 level, but then it made correction.
After this movement, price in a short time rose to the top part of flat, where it turned around and bounced down to $1.1310 level.
Price tired to grow, but failed and continued to trading near this level, and even recently it bounced.
So, in this moment, I expect that Euro can bounce up from support level to $1.1575 top part of the flat.
If this post is useful to you, you can support me with like/boost and advice in comments❤️

XAUUSD TRIANGLE PATTERN IN 15-MI Created This XAUUSD Chart Analysis In 15M Tf
Entry Point : SELL XAUUSD MADE TRIANGLE PATTERN
Resistance zone : 3315
Target Will Be : 3288
NOTE : THIS CHART IS BASED ON PERSONAL ANALYSIS FOR LEARNING PURPOSES. PLEASE USE PROPER RISK MANAGEMENT

XRP Nears Triangle Apex: Breakout to $2.30 Incoming?XRPUSDT is heating up! Approaching apex of the Triangle!
Will we see a breakout to $2.30? Or possibly to $2.03!
Check the 1H chart & watch the breakout!

EURUSD: Bullish Price Action Confirmed?! 🇪🇺🇺🇸
Here is my latest price action analysis for EURUSD.
The price completed a recent correction movement with
quite an extended consolidation within a horizontal range
and a symmetrical triangle.
The violation of 2 intraday resistances with a bullish imbalance
indicate a highly probable finalization of the accumulation.
Probabilities are high that the pair is returning to a bullish trend now.
Goal - 1.1478
❤️Please, support my work with like, thank you!❤️
I am part of Trade Nation's Influencer program and receive a monthly fee for using their TradingView charts in my analysis.

GBPUSD pays attention to buying opportunities on pullbacksIn the 4-hour chart, GBPUSD broke through the triangle consolidation and bulls are currently in the lead. Currently, we can pay attention to the support around 1.335. If it falls back and stabilizes, we can consider continuing to buy. The upward target is 1.350-1.364.

GOLD → The chances of a further decline are growing...FX:XAUUSD continues to test support at 3270 for a breakout. Any de-escalation of the conflict between the US and China could trigger a price drop. But it's not that simple...
Gold under pressure amid tariff war and ahead of US data
On Monday, gold is testing last week's low of $3260, remaining under pressure from a strengthening dollar and easing trade risks between the US and China.
Investors are preparing for the release of key US GDP and labor market data, which could influence expectations for Fed rates. Against this backdrop, the correction in gold could be replaced by growth if macro statistics turn out to be weak and geopolitical risks remain.
Another retest of support could trigger a breakout. It is necessary to monitor the situation between China and the US. Any de-escalation will trigger a decline.
Resistance levels: 3299, 3326
Support levels: 3268.9, 3245, 3232
Since the opening of the session, the potential for a further decline has been exhausted. Gold may strengthen to the indicated resistance zones. A false breakout of 3300/3326 could trigger a decline, which could bring the price closer to the support breakout of 3270.
With respect, R. Linda!

Short A/JPrice has just retested previous support, where align with the 618% Fib, and also a descending trendline. The over all trend is bearish and the current set up is a triangle on the 1hr timframe. Entry break an retest and target yellow line.

Is this still the ‘Top Trade’ of 2025? (WTI crude oil)It’s not a big secret actually- I’m talking about crude oil!
In the final week of 2024, the team and I highlighted two versions of the WTI crude oil weekly chart and asked ‘is this the top trade of 2024?’
Version 1 has already happened, WTI crude hit $55 per barrel, the downside objective of the smaller triangle pattern on the chart.
Version 2 showed a much larger triangle pattern (which we show again this week) and had a downside target of nearly $30! It would take a lot of conviction to ride the price that far down, but could crude oil still move a lot lower this year?
What’s interesting is that this is still one of the ‘less talked about’ situations in the market today because of the huge volatility seen in both stocks, forex and fixed income.
And I like that nobody’st talking about it - because you don’t want everyone in on it - that means the move could already be over.
Crude oil hit a five-year low. That’s meaningful.
Strong markets don’t hit 5-year lows, weak markets do. And we like to sell weak markets.
Of course, ‘oversold markets’ hit 5-year lows too - and that largely explains the ‘bottom feeders’ who bought WTI crude oil at $55.
Downside volatility got extreme owing to Trump’s tariffs and mean-reversion helped it rebound on news of the 90-day pause, much like stock markets.
I am completely open to the idea that $55 is a multi-year low and essentially marked the bottom. The huge Hammer reversal candlestick pattern adds weight to that idea.
But with the price having hit $65 last week, buying the lows is yesterday’s trade. What do we do today?
We will be looking to do what we said in Week 53 of 2024 in case crude oil turns out to be the ‘top trade of 2025’ as we imagined.
By the way, Brent crude oil has a very similar setup so this is not a ‘US oil’ thing.
There are two parts to trading ‘planning the trade, and trading the plan’.
There isn’t much use in making a plan, and not taking the trade.
There are always reasons not to take a trade- but if it’s a ‘good trade’ that fits the rules of your trading strategy, then those reasons are usually just ‘noise’.
WTI Crude (USO/USD)
Long term chart (weekly)
Trend: Down
Phase: Re-test of breakdown
Resistance = $70
Support = $55
Price action: Price has broken down, rebounded and is now testing the breakdown level, while under the 30-week moving average. Should the price break back over the broken long term rising trendline then we know the idea, or at least the timing on the idea is not right.
View: Bearish while under broken up-sloping long term support

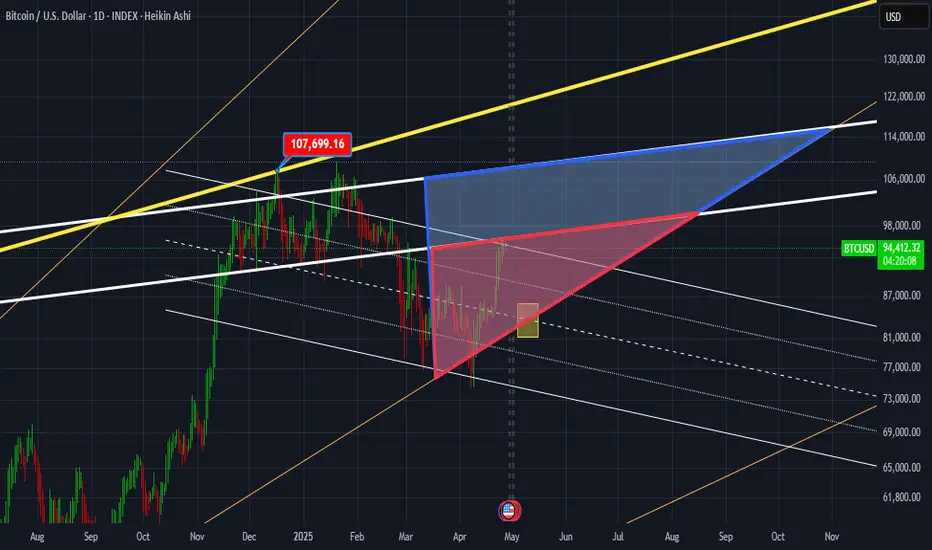
BTC in Bermuda triangle!I love shapes. Shapes have a rich and deep philosophy and give you an idea of what's going on in the mind of market's major players. BTC is no longer an infant, in fact, just like you, it's getting older and older everyday! "Now" the market movements are far beyond simple pump and dumps. No more slides in the park for baby bitcoin! Watch the small red triangle and the big blue one. The lovely yellow rectangle waves hands!

BITCOIN - Price can exit from wedge and rise to $100K levelHi guys, this is my overview for BTCUSDT, feel free to check it and write your feedback in comments👊
Some days ago price reached resistance line of triangle and then, in a short time, declined to $80300 level.
Price broke $92000 level and then some time traded inside triangle, where it reached this level again and then corrected.
Later BTC exited from triangle and entered to wedge, where it first declined below $80300 level, but later turned back.
Then it continued to move up inside wegde, where it later made correction to support line and then rose to $92000 level.
Soon, price broke this level and even reached resistance line of wegde, after which it corrected and continues to rise.
Possibly, price can bounce up from support area to $100K, thereby exiting from wedge pattern.
If this post is useful to you, you can support me with like/boost and advice in comments❤️

GOLD → A false breakdown of support will lead to growthFX:XAUUSD is trading within the range of 3370-3270. Since the opening of the session, the price has lost its potential for further decline. There is no news on Friday, so after retesting the liquidity and support zone of 3283-3270, the price is likely to return to growth.
Gold stabilizes near $3,350, but growth is held back by the dollar
On Friday, gold held its ground after recovering, but further growth is limited by the strengthening dollar and hopes for progress in the tariff war negotiations...
Optimism about corporate earnings in the US and easing recession fears are supporting demand for the dollar. However, ongoing uncertainty in US-China relations is keeping interest in gold alive.
Markets are waiting for new signals from the White House and the Fed, which will determine the further movement of gold prices towards the end of the week.
Focus on supporting the trading range. A false breakdown of 3283-3270 could change the balance of power, leading to a rebound or growth.
Resistance levels: 3314, 3342, 3370
Support levels: 3283, 3270, 3244
There is no news today, except for the unpredictable Trump and the general situation with the tariff war. Any speech or tweet could shake the market. However, after a neutral week, gold remained within the range, and the market is likely to keep the metal within the flat on Friday. Accordingly, I expect a rebound from support and growth to the intermediate resistance lines indicated above.
Best regards, R. Linda!

SOL / USDT Update - Breakout in Play! Check out the 1H chart for SOLUSDT. Solana is showing strength in a rising channel, with a recent breakout from a symmetrical triangle to support at $150.
If we break to $165, we could see a strong move higher. But if rejected, watch for a pullback to $150 or lower.
What’s your take?

Bitcoin Blasts to $95,800: Next Stop $96,500?Bitcoin is on FIRE! Just hit $95,800 & climbing in a perfect rising channel!
Breakout after breakout — next stop $96,500?
Check the 1H chart but beware of potential pullbacks!


Altcoin Market Update – April 24, 2025As of today, the TOTAL3 Index (excluding BTC & ETH) offers key insights into the altcoin market:
⸻
Technical Overview:
• 1D: -1.54% → Minor pullback
• 1W: +6.37% → Bullish momentum
• 1M: -4.14% → Mid-term correction
• 6M: +32.94% → Strong growth
#TOTAL3 remains above $790B, a critical support. Holding this level is vital for future altcoin rally targets like $1.16T and beyond.
Bullish divergence on the TOTAL3/BTC chart hints at altcoins gaining strength over BTC.
⸻
Fundamentals:
• The global crypto market cap is $3.03T
• BTC & ETH dominate, but TOTAL3 reflects altcoin potential
⸻
Summary:
Altcoin market remains optimistic, with solid long-term signals. Keep an eye on support zones and momentum indicators for your trading strategy.

Pull back SPYBought some puts for 04/29 strike 439. Too much resistance above, looks like is going to be a rejection. Tight SL at 550.
