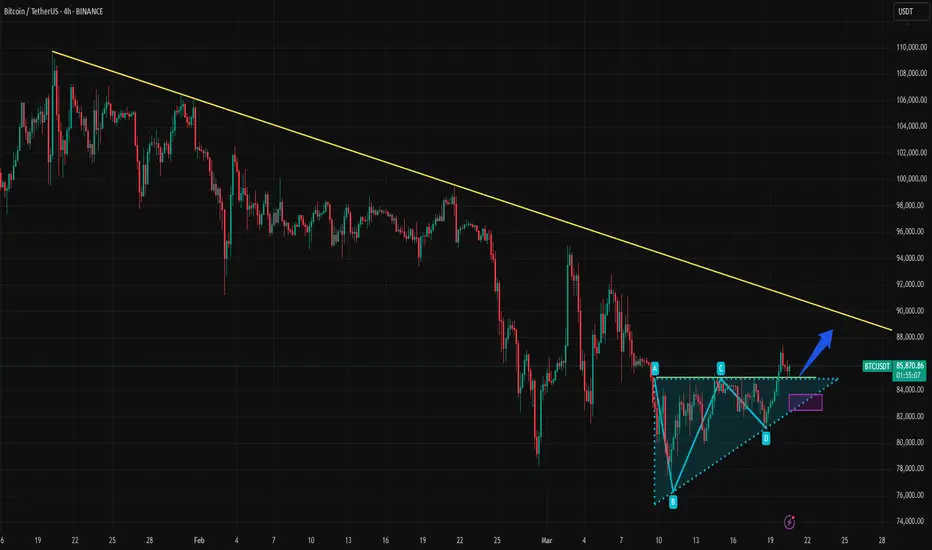
Asymmetrical Triangle (Neutral) or AB=CD (Bullish) for BTC?BINANCE:BTCUSDT has formed bullish divergence on Daily TF and continues its upward momentum. BTC has also formed two trading patterns:
1. Asymmentrical Triangle: This neutral pattern can break out in either direction
2. Bullish AB=CD: This continuation pattern on the weekly tf coupled with bullish divergence on daily tf indicates imminent continuation of the bullish trend.
Buy stop order on break of LH could be a good trading idea!
Triangle

GOLD → Long squeeze (false break of uptrend support) FX:XAUUSD within the liquidation the price is testing the key support at 3004.9 and forms a false break of support. The trend is generally bullish as the geopolitical situation remains tense and carries high risks.
Friday saw a liquidation phase relative to the consolidation at 3024-3045. Reason: the White House is expected to revise tariff policy, easing measures against key trading partners. Negotiations over the conflict in eastern Europe, where the U.S. is a key link, also support the positive sentiment. On Monday, market attention will focus on Russia-US talks, as well as preliminary PMI data that could affect the global economic outlook.
The focus is on the current consolidation and the 3024 level. If the bulls hold their defenses above this level, gold will continue to strengthen.
Resistance levels: 3045 - 3056
Support levels: 3024, 3004
The growth within the bullish trend may continue. The price is forming a consolidation between trend support and resistance at 3024. The emphasis is on 3024, if the bulls hold the defense over this zone, gold may head for a retest of the high (the initial reaction to ATH may trigger a pullback down)
Regards R. Linda!

SOLANA (SOLUSD): Bullish Reversal Confirmed
It looks like Solana is ready to return to a bullish trend.
We see multiple strong price action confirmations after
a test of a significant daily support.
The price formed the ascending triangle on that, and violated
both its neckline and a resistance line of a falling wedge pattern.
Looks like the market can reach 180 level easily soon.
❤️Please, support my work with like, thank you!❤️

IP – Coiled Triangle with a $10 STORY to Tell?COINBASE:IPUSD / COINBASE:IPUSDC
We’ve got a clean symmetrical triangle forming post-initial listing volatility, and price is nearing the apex. Volume’s dropping off, just like you'd expect in the final stages of compression—classic pre-breakout behavior.
What caught my eye here is how this triangle lines up with a Fibonacci extension target up near $10. Yeah, sounds bold, but zoom out on a log chart and it actually looks pretty reasonable. The measured move from the initial impulse, paired with the triangle breakout structure, gives a clear path to that 1.618 extension level. Throw in the fact that the volume profile starts thinning out above $6, and there’s potential for a swift move if it catches a bid.
Triangle Compression and Breakout Setup
We’re in the late innings of this triangle consolidation. Lower highs, higher lows, volume fading—textbook stuff. If price can get through the $6 zone with conviction, the structure says we could see an aggressive breakout. If not, we’re probably looking at one more fakeout or shakeout before direction resolves.
Fibonacci Extension and Log Chart Math
Using Fib extensions on a log scale paints a pretty compelling picture. $10 sits right at the 161.8% extension off the initial run, and log charts smooth out the scale enough to show how that level isn’t just hopium—it’s structured speculation. The triangle adds context: this isn’t about chasing highs, it’s about waiting for the breakout confirmation from a pattern that’s been compressing for weeks.
Volume Profile and Context
VPVR shows strong acceptance around $5 and fading resistance above. If bulls can flip that region into support, the path to higher prices opens up fast. A breakout from this triangle above $6.25 or so, ideally on volume, could be the signal that this thing is ready to move.
Curious if anyone else is watching this chart. We’ve got a clear triangle, confluence with Fib levels, and log-scale structure supporting a much higher target. Could be a breakout worth watching—or just another consolidation that needs more time to cook.
Not financial advice. Just tracking setups, patterns, and potential. Let’s see if the STORY plays out.

Hidden Bullish Setup on AVAX – Just Revealed !Hello Traders 🐺
In this idea, I want to talk about one of the top altcoin projects in the crypto space—AVAX. If you’ve been around, you probably know the name... but here’s why I’m bullish on it right now: 🔥👇
✅ 1. Massive Weekly Triangle Pattern
On the weekly timeframe, AVAX is already inside a huge triangle formation, which—if it breaks out—could push the price to at least its previous ATH (~$165). If you enter now, that’s potentially a 750% profit! 🚀💰
I’ll go deeper into this long-term price target in a future idea, because this move still needs to break the weekly resistance—and there are multiple resistance levels along the way. But for now, we’re focusing on the immediate short-term setup. ⚠️📈
✅ 2. Repeating Price Patterns Inside the Triangle
Inside this gigantic triangle, AVAX price tends to repeat a similar structure each time:
The first pattern was made of converging trendlines → breakout → strong pump to the triangle’s top.
The second setup was a falling wedge → breakout → same explosive move.
👉 And now guess what? We have another bullish channel, and it’s currently breaking out as we speak! ⛓📉➡️📈
So make sure to act accordingly and keep your eyes on the chart! 👀🔥
and always remember :
🐺 Discipline is rarely enjoyable , but almost always profitable 🐺

ETH at a Make-or-Break Level – What’s Next?🚀 Hey Traders!
If you're getting value from this analysis, smash that 👍 & hit Follow for high-accuracy trade setups that actually deliver! 💹🔥
🚨 ETH Update – Critical Level Ahead!
ETH is currently forming a symmetrical triangle on the 2-week timeframe and is now testing the lower trendline. With 4 days left before the candle closes, this level is crucial! 🔥
📌 What’s next?
✅ If ETH bounces from here, we could see a strong bullish move in the coming days.
❌ Invalidation: A close below $1850 could trigger further downside.
📉 Breakdown or Bounce? What’s your take? Drop your thoughts in the comments! 👇💬
🔔 Follow us for real-time updates and winning trade setups! 🚀

Triangle break outMy stoploss feels abit too tight so i might adjust my entry and buy lower and increase my SL by 10 pips

Adyen (ADYEN) – Technical Analysis and 1W OutlookTechnical Analysis
Adyen's stock is forming a symmetrical triangle, indicating a potential breakout. The recent price surge confirmed the pattern's breakout, but a correction toward the 0.618 Fibonacci level (1457.2 EUR) is possible, acting as a key buying zone.
Key Levels:
Resistance: 1720.8 EUR (0.5 Fibonacci), 2311 EUR (0.236 Fibonacci)
Support: 1457.2 EUR (0.618 Fibonacci), 1081.8 EUR (0.786 Fibonacci)
Target: 2838 EUR
Indicators suggest a potential continuation of the uptrend:
MACD is signaling bullish momentum
Stochastic indicates a possible correction before further upside
Fundamental Analysis
Adyen is a leading player in the payment technology sector, serving major companies like Uber, Spotify, and Microsoft.
Key Factors Impacting the Stock:
Financial Performance: Recent earnings reports showed revenue growth driven by increased payment volumes.
Macroeconomics: Lower inflation and potential interest rate cuts could benefit the tech sector.
Competition: Pressure from PayPal and Stripe remains a key risk.
Adyen maintains bullish potential following the triangle breakout. The 1457-1500 EUR zone is crucial for trend confirmation, with a possible long-term target at 2838 EUR. However, a short-term correction remains possible.

HERE IS USDJPY TRIANGLE PATTERNHello Guys Here Is Chart Of USDJPY in 4-H AT
Entry Level: SELL Around 148.800
Resistance: 149.300
Target Will Be : 146.800
This analysis assumes the price respects the Triangle Pattern.

CNERGYTrend is Bulish. with Bulish Ascending triangle beark.
Trade Plan
Buy : 7.98
Stop Loss :5.50
TP: 10.54
RRR 1:1

XAUUSD Weekly Analysis – Bearish Correction ExpectedGold (XAUUSD) has recently broken above a rising wedge resistance on the weekly timeframe but is now showing early signs of potential exhaustion. Price action is currently hovering around the $3,024 level after a strong bullish rally. However, historical patterns and structure suggest a possible bearish correction ahead.
📊 Key Technical Observations:
Rising Wedge Pattern: Price has been following an ascending channel with a sharp parabolic curve. The structure hints at overextension, making it vulnerable to a pullback.
Previous Corrections: Two notable corrections (-8.89% and -8.15%) provide a historical benchmark, reinforcing the possibility of a similar retracement.
Bearish Scenario :
A potential double-top formation and rejection zone is developing around the $3,050 area.
Target Zones:
TP1: $2,935.95 – first major support/resistance flip zone.
TP2: $2,782.94 – deeper retracement aligned with previous corrective structure.
🧠 Trading Bias:
Bearish bias in the short to medium term as gold may seek to correct before any continuation of the bullish trend.

BITCOIN → Flag (consolidation) before falling to 78-73KBINANCE:BTCUSD is consolidating after a short-squeeze relative to 85-87K. A bearish set-up is being formed, the break of which may strengthen further decline to the key target of 73K
A symmetrical triangle is forming within the downtrend on D1, a breakdown of this structure may strengthen the decline. Locally, within the channel a flag - bearish figure is formed (on the local TF false uptrend, the crowd enters to buy from the support or at the break of local resistance, at accumulation of the necessary potential the big player removes the limit order and releases the price, which is dispersed by liquidation of traders), regarding 85K-86.6K the liquidity capture is formed and the price returns to the selling zone. Consolidation below 85K may trigger a breakdown of the figure support and further fall to 80K-78K
Fundamentally: the market sells off any positive news very quickly (negative background is created):
crypto summits, (Trump said nothing new at the second summit)
positive resolutions of problems (for example between SEC and XRP, or removal of restrictions from local exchanges)
crypto reserve
The only nuance, bitcoin's dominance index is still high despite the price drop...
Resistance levels: 85150, 866700, 89400
Support levels: 82K, 80K, 78200
There are no positive signs for growth. The zone where we can consider a trend reversal ( if something supernatural happens ) is 89-91K, but it is very far away.
But now I would consider a breakdown of the flag, or 83.5 - 82.5 and price consolidation below this zone with the purpose of further fall to the local important level 78173. Then another consolidation or correction is possible before a further fall to 73.5K
Regards R. Linda!

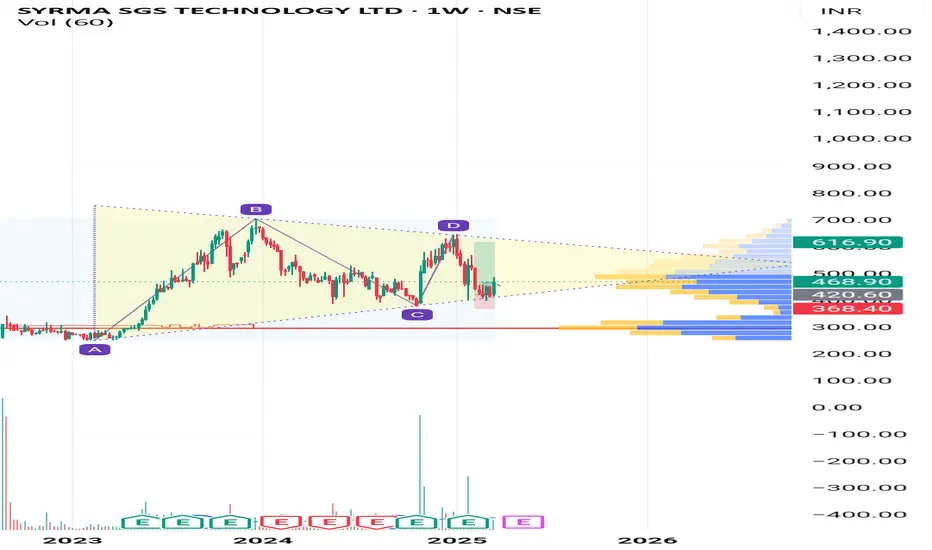
EICHERMOT for Positional TradeEICHERMOT is good for Positional trade setup forming higher high and higher lows. Target is the trend line

GOLD → Consolidation (correction) before growth to $3100FX:XAUUSD is going into consolidation after strong growth on the back of dollar correction. The metal may test deeper support areas before attempting a new high
Gold is correcting, but remains in an uptrend
The decline in quotations may be seen as a buying opportunity, given the economic uncertainty due to Trump's tariffs and expectations of Fed rate cuts.
The Fed reiterated its forecast of two rate cuts in 2025 despite Powell's cautious comments. Gold is further supported by rising inflation risks and geopolitical tensions in the Middle East.
Resistance levels: 3045, 3057
Support levels: 3024, trending, 3004
Reaction to support is weakening, even amid the uptrend. Gold may stay in this consolidation until the middle of next week, or it may try to break out of the consolidation to retest deeper support zones, such as the rising trend line or the 3004 imbalance zone, from which the growth may resume.
Regards R. Linda!

Reliance Ind Weekly Chart In weekly Chart Falling Wedge Chart Pattern formation Lets See Make Or Break

NikePoor results mean Nike has broken out of a triangle pattern which started forming in March 2022.
Clean break down with large sell side volume.

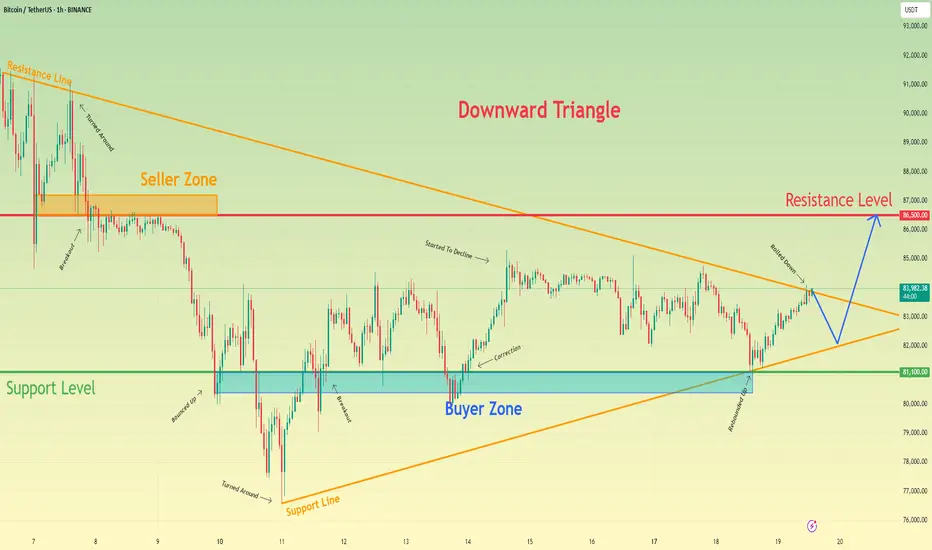
Bitcoin can exit from triangle and rise to resistance levelHello traders, I want share with you my opinion about Bitcoin. On the chart, we can see that the price entered a downward triangle, where it rebounded from the resistance line and dropped to the resistance level. After that, BTC bounced from the 86500 level, climbed back to the resistance line of the triangle, and then started to decline. Soon, it broke through 86,500 and reached the support level, which coincided with the buyer zone. BTC then broke this support and dropped further to the support line of the triangle before reversing and beginning to rise. In a short time, the price reached 81100, broke through it, and made a retest before continuing its upward movement. However, it later corrected back to the buyer zone, then climbed to 85000, and started declining again. Shortly after, the price dropped to the support level and then rebounded to the resistance line of the triangle. Given this price action, I expect BTC to correct toward the support line of the triangle before bouncing back up and breaking out of the pattern. From there, I anticipate further growth toward the 86500 resistance level, which is why I have set my TP at this level. Please share this idea with your friends and click Boost 🚀
Gold can continue to grow inside upward channelHello traders, I want share with you my opinion about Gold. This chart shows how the price initially rebounded from the support level, which aligned with the buyer zone, but soon reversed and dropped back down to the support line. After hovering near this line, the price entered a triangle pattern, where it bounced off the resistance line and fell to the support line, breaking below the support level. Following that move, the price reversed upward and returned to the buyer zone, where it consolidated briefly before declining again to the support line. From there, it bounced and began to climb. Shortly after, the price broke through the 2915 level and eventually exited the triangle pattern. From that point, the price started trending upward within an ascending channel, reaching the current support level, which overlaps with a key support area, before rising to the resistance line of the channel. Recently, the price pulled back to the support zone once again, and I believe there’s a good chance it will decline a little below from this area and continue its upward move within the channel, aiming for the resistance line. For this scenario, my TP is set at 3080. Please share this idea with your friends and click Boost 🚀

EUR/GBP Analysis – Symmetrical Triangle Breakdown & Bearish MoveThis EUR/GBP chart on the 1-hour timeframe showcases a well-defined symmetrical triangle formation, a widely recognized pattern in technical analysis that signals potential breakout opportunities. The price action has respected the converging trendlines, indicating consolidation before a decisive move. Recently, the market has broken below the support zone, confirming a bearish breakdown and providing a strong signal for potential downside movement.
This analysis will cover pattern formation, key technical levels, trading strategy, risk management, and future market outlook to provide a comprehensive professional breakdown of this setup.
1. Chart Pattern Analysis – Symmetrical Triangle Formation
A symmetrical triangle consists of two converging trendlines that squeeze price action into a narrowing range, reflecting market indecision. This pattern is considered a continuation pattern, meaning that the price is likely to continue in the direction of the prevailing trend after the breakout.
Pattern Characteristics in This Chart:
✅ Lower Highs: Price fails to break previous peaks, indicating weakening bullish momentum.
✅ Higher Lows: Buyers step in at higher points, preventing aggressive declines.
✅ Volume Decrease: Typical of consolidation within a symmetrical triangle.
✅ Breakout Confirmation: A strong bearish candle broke below the support level, signaling further downside potential.
2. Key Technical Levels & Zones
📌 Resistance Level + All-Time High (ATH) – 0.8421
This level represents the highest point in the pattern, where price faced repeated rejections.
It aligns with a historical resistance zone, indicating a strong supply area.
A breakout above this level would shift the market to a bullish bias.
📌 Support Level – 0.8379 (Now Acting as Resistance)
Previously a key demand zone where buyers defended the price.
Price has now broken below this level, confirming it as new resistance in a bearish scenario.
A successful retest followed by rejection increases downside confirmation.
📌 Stop-Loss Placement – 0.8421
Located above the upper trendline and recent highs to avoid false breakouts.
If price regains this level, the bearish scenario will be invalidated.
📌 Target Zone – 0.82926 (Major Support Area)
This is the next strong support level, acting as a potential take-profit zone for short positions.
It aligns with a previous price reaction area, making it a logical target for sellers.
3. Trading Setup & Strategy – Bearish Trade Plan
The breakdown from the symmetrical triangle structure presents an opportunity to short the pair with a defined risk-to-reward setup.
📌 Entry Strategy:
Enter short positions after price breaks and retests the 0.8379 support level as resistance.
Confirmation should come from bearish candlestick patterns like engulfing candles or pin bars.
📌 Stop Loss:
Placed above 0.8421, above the last swing high, to protect against potential false breakouts.
📌 Take Profit (TP) Target:
First TP: 0.8325 (Intermediate support)
Final TP: 0.82926 (Major support and key structure level)
Alternative Scenario – Bullish Reversal Possibility
If price reclaims 0.8379 and closes above it consistently, the bearish breakdown might be a false move.
A move above 0.8421 would invalidate the bearish setup, leading to potential bullish momentum.
4. Risk Management & Trade Confirmation
✅ Volume Analysis
A significant increase in volume on the breakdown strengthens the bearish outlook.
Low volume retests may indicate a weak reversal attempt, favoring continuation downward.
✅ Bearish Price Action Confirmation
Lower highs and consistent lower lows reinforce a bearish sentiment.
Rejections from the broken support (now resistance) validate the trade setup.
✅ Risk-to-Reward Ratio (RRR)
The Stop-Loss (SL) is tight, and the profit target is significantly larger, making this a high RRR trade.
Ideally, a RRR of at least 2:1 or 3:1 should be maintained for proper risk control.
5. Market Sentiment & Future Outlook
Bearish Bias Strengths:
Trendline break indicates strong downside pressure.
Failed attempts to break resistance suggest weakening bulls.
Global macroeconomic factors and fundamental catalysts may favor GBP strength over EUR in the near term.
Reversal Risks:
A strong bullish breakout above 0.8421 would shift momentum to the upside.
Fundamental news events (e.g., ECB or BoE statements) can impact market direction unexpectedly.
6. Summary & Conclusion
🔹 The EUR/GBP 1-hour chart has broken below a symmetrical triangle pattern, confirming a bearish breakout.
🔹 Key levels to watch: Resistance at 0.8421, support at 0.82926.
🔹 Trading strategy favors short positions, with a target at 0.82926 and a stop loss at 0.8421.
🔹 Confirmation comes from trendline breaks, volume analysis, and lower highs/lows structure.
📌 Final Verdict:
The setup is bearish unless price reclaims 0.8379 and invalidates the structure.
Traders should monitor price action, volume, and news events for further confirmations.
🔥 Potential Profit Target: 80-90 Pips 📉
⚠️ Risk Management is Crucial – Always Use Stop Loss & Proper Position Sizing

XAUUSD Head And Shoulder pattern breakdownGold update 15m head and shoulder breakdown
Key Levels:
Resistance Levels:
3,040.000 (Immediate Resistance)
3,050.000
3,060.000
3,070.000 (Major Resistance)
Support Levels:
3,022.000 (Immediate Support)
3,014.000
3,006.500
2,999.000
2,991.000 (Major Support)
Price Action Overview:
Gold is currently trading at 3,033.785, showing a slight upward movement of +1.685 (+0.096%).
The price has been consolidating between 3,031.425 (Low) and 3,034.430 (High) in the last 15-minute candle. The market is testing the 3,035.410 level, which could act as a minor resistance.
Technical Indicators:
USB (Ultimate Support/Resistance Band):
Current Value: 38.301 (-1.279)
Indicates potential support/resistance zones around 3,830.4.
TAT & Skullers Indicator:
Current Value: -38.306 (-1.269)
Suggests a potential retest or breakdown level around 3,830.6.
Market Sentiment:
The market is showing slight bullish momentum, but the price remains within a tight range.
A breakout above 3,040.000 could signal a stronger bullish trend, while a breakdown below 3,022.000 may indicate bearish pressure.
Trading Strategy:
Bullish Scenario:
Entry: Consider a long position if the price breaks and sustains above 3,040.000.
Targets:
3,050.000 (First Target)
3,060.000 (Second Target)
3,070.000 (Major Resistance)
Stop Loss: Place below 3,022.000 to manage risk.
Bearish Scenario:
Entry: Consider a short position if the price breaks and sustains below 3,022.000.
Targets:
3,014.000 (First Target)
3,006.500 (Second Target)
2,999.000 (Major Support)
Stop Loss: Place above 3,035.410 to manage risk.
Risk Management:
Always use proper risk management techniques.
Risk no more than 1-2% of your trading capital per trade.
Adjust position sizes according to your risk tolerance and account size.

Bitcoin can rebound from triangle pattern to 90K pointsHello traders, I want share with you my opinion about Bitcoin. Not long ago, the price was trading within a range, where it quickly entered the seller zone and remained near this area for quite some time. BTC attempted to rise but failed, and after nearly reaching the upper boundary of the range, it dropped sharply. The price broke through the 94000 level, exiting the range as well, and then fell to the support level, which aligned with the buyer zone. Shortly after, the price made a strong upward impulse toward the resistance level before starting a decline within a downward triangle. Inside this pattern, BTC initially made a correction, climbed back to the resistance line of the triangle, and then resumed its decline. Eventually, the price dropped to the 78900 support level, where it touched the triangle’s support line and then began to rise. At the moment, BTC continues to climb near this level, and I expect it to rebound from the support line of the triangle and break above the resistance, signaling an exit from the pattern. If this happens, I anticipate further growth, so my target is set at 90000 points. Please share this idea with your friends and click Boost 🚀

Bitcoin Rebounds with Dovish FOMC, Preparing to Test TrendlineBitcoin has broken out of the ascending triangle and is starting to regain some lost ground. While the medium-term trend remains downward, if BTC holds above the upper boundary of the triangle (around 85K), another leg higher with a potential target between 90K and 91K becomes more likely, depending on the pace of the move.
Supporting the bullish case are factors such as the Ripple case drop, a slightly dovish FOMC, and rumors of new crypto-related actions from Trump.
However, if Bitcoin falls back below the 85K level today, the next key support to watch is around 82,500. A move down to this level alone wouldn't completely negate the bullish outlookfor short term. But if Bitcoin also breaks below the lower boundary of the former triangle too, it would significantly increase bearish pressure.