TRON Accumulation Phase Signals Potential for Explosive Growth TRON Accumulation Phase Signals Potential for Explosive Growth as On-Chain Metrics Point to Network Consolidation
The cryptocurrency market, a realm of perpetual motion and often bewildering volatility, occasionally presents moments of deceptive calm. These periods, far from indicating stagnation, can be the breeding grounds for significant future price movements. For TRON (TRX), a prominent blockchain platform known for its high throughput and focus on decentralizing the web, recent on-chain data and market behavior are increasingly pointing towards such a phase: a sustained period of accumulation, potentially heralding a major price surge as the network undergoes a subtle yet profound consolidation.
While the broader market narrative often chases fleeting trends and explosive, short-lived pumps, savvy investors understand the importance of identifying quieter, underlying currents. The concept of an accumulation phase, where smart money and long-term believers strategically build their positions, is a cornerstone of market cycle analysis. For TRON, the convergence of specific on-chain indicators – from whale activity and exchange flows to transaction patterns and staking metrics – suggests that such a phase is not just underway but is maturing, laying a robust foundation for a potential upward revaluation. This isn't about fleeting hype; it's about observing the methodical groundwork being laid for what could be a significant and sustained rally.
Understanding TRON: A Brief Overview of the Ecosystem
Before delving into the intricacies of its current market phase, it's essential to grasp what TRON represents. Launched by Justin Sun, TRON aims to build a decentralized internet. Its blockchain supports smart contracts, various kinds of blockchain systems, and decentralized applications (dApps). With its Delegated Proof-of-Stake (DPoS) consensus mechanism, TRON boasts high transaction speeds (TPS) and low transaction fees, positioning itself as a strong contender in the competitive Layer 1 landscape, particularly for applications requiring scalability, such as decentralized finance (DeFi), non-fungible tokens (NFTs), and GameFi.
The TRON network has cultivated a substantial ecosystem over the years. It hosts a significant volume of stablecoin transactions, particularly USDT, making it a key infrastructure layer for value transfer. Its TRC-20 token standard is widely adopted, and the platform has seen notable activity in dApp development and user engagement. This underlying utility and established presence are crucial, as accumulation phases are often rooted in a fundamental belief in the long-term viability and growth potential of an asset, rather than mere speculative fervor.
The Anatomy of an Accumulation Phase: Setting the Stage for a Breakout
An accumulation phase in financial markets is a period characterized by relatively flat or gradually inclining price action following a significant downtrend or a prolonged consolidation after an uptrend. During this time, informed investors, often referred to as "smart money" – which can include institutional players, large individual holders (whales), and project insiders – begin to quietly buy up the asset. Their strategy is to acquire substantial positions without causing a sharp price spike that would alert the broader market and increase their average entry cost.
Key characteristics of an accumulation phase include:
1. Reduced Volatility: Price swings tend to become less erratic as selling pressure from weaker hands subsides and buying pressure from accumulators absorbs supply.
2. Volume Signatures: While overall volume might appear subdued compared to peak bull market frenzy, there can be spikes in volume on minor price dips (as accumulators buy the lows) or during periods of sideways movement, indicating consistent buying.
3. Price Floor Formation: The price often establishes a strong support level, repeatedly bouncing off it as buyers step in to defend it.
4. Sentiment Shift: Public sentiment may range from bearish or indifferent (a hangover from a previous decline) to cautiously optimistic among those recognizing the underlying value. The rampant euphoria of a bull run is typically absent.
5. Duration: Accumulation phases can last for weeks, months, or even years, depending on the asset and the market cycle. The longer and more robust the accumulation, often the more powerful the subsequent markup phase.
For TRON, the suggestion of an accumulation phase implies that these sophisticated market participants perceive TRX as undervalued at its current levels and anticipate future catalysts or a broader market shift that will drive its price significantly higher.
Decoding TRON's On-Chain Signals: A Network Consolidating for Growth
On-chain data provides a transparent window into the activity occurring directly on a blockchain, offering insights that traditional technical analysis alone cannot capture. For TRON, several on-chain trends are converging to paint a picture of network consolidation and strategic accumulation.
• Whale Watching: The Giants Amass Their Holdings
One of the most telling signs of accumulation is the behavior of large wallet holders, or "whales." An increase in the number of addresses holding substantial amounts of TRX, or an increase in the balances of existing whale addresses, often indicates that those with significant capital are building positions. This can be observed by tracking the distribution of TRX tokens across different wallet tiers. If smaller retail wallets are shedding tokens (perhaps due to impatience or fear) while larger wallets are consistently adding to their stacks, it’s a classic sign of accumulation. These large players often have access to more in-depth research or a longer-term investment horizon, and their actions can be a leading indicator of future price strength. The quiet, steady absorption of TRX by these entities reduces the freely floating supply, making the asset more sensitive to future demand shocks.
• Exchange Dynamics: A Flight to Self-Custody
The flow of tokens to and from cryptocurrency exchanges is another critical on-chain metric. During accumulation phases, it's common to see a net outflow of the asset from exchanges to private wallets. This suggests that investors are acquiring tokens with the intention of holding them for the medium to long term (HODLing), rather than actively trading them. When tokens move off exchanges, it reduces the immediately available supply for sale, creating a supply squeeze that can exacerbate upward price movements when demand picks up. Conversely, large inflows to exchanges often signal intent to sell. If TRON is experiencing sustained periods where outflows significantly outweigh inflows, it strongly supports the accumulation thesis. This movement to self-custody also indicates a growing conviction among holders in the security and long-term prospects of their TRX investment.
• Staking and Supply Squeeze: Locking Up TRX
TRON's DPoS consensus mechanism involves staking, where TRX holders can lock up their tokens to participate in network governance and earn rewards. An increase in the amount of TRX being staked is a bullish indicator for several reasons. Firstly, it signals user confidence and engagement with the network. Secondly, and more directly relevant to price, staking removes tokens from the circulating supply. The more TRX that is staked, the less is available for trading on the open market. This reduction in liquid supply, similar to exchange outflows, can significantly amplify the impact of new buying pressure. If on-chain data shows a steady rise in the percentage of total TRX supply being staked, it contributes directly to the consolidation of supply and the potential for a more volatile upward move when demand surges.
• Transaction Patterns: Quality Over Quantity?
While high transaction volume can sometimes indicate strong network activity, during an accumulation phase, the nature of transactions can be more revealing than the sheer number. For instance, an increase in the average transaction size, even if the total number of transactions is stable or slightly decreasing, might suggest larger players are moving significant amounts of TRX, possibly consolidating them into fewer wallets or moving them to staking contracts. A decrease in "noise" transactions (very small, frequent transfers often associated with retail speculation or bot activity) coupled with an increase in larger, more deliberate transfers can be a sign of network maturation and consolidation by more substantial entities.
• Active Addresses and Network Growth:
While a surge in new active addresses is typically bullish, during a deep accumulation phase, the growth rate of new addresses might temporarily slow down as the market sheds speculative retail participants. However, the activity of existing addresses, particularly those identified as long-term holders or accumulators, becomes more critical. If these cohorts show increased activity in terms of receiving tokens or interacting with staking and DeFi protocols within the TRON ecosystem, it signals underlying strength and commitment, even if the headline number of daily new users isn't explosive. The consolidation here refers to a strengthening of the core user and holder base.
• Development Activity and Ecosystem Health:
Beyond direct token movements, the underlying health and development activity of the TRON ecosystem play a crucial role in attracting long-term accumulators. Consistent updates to the TRON protocol, new partnerships, growth in its DeFi sector (e.g., JustLend, JustStables), expansion of its NFT marketplaces, and successful GameFi projects all contribute to the fundamental value proposition. On-chain data can sometimes reflect this through increased smart contract interactions or growth in Total Value Locked (TVL) within TRON's DeFi applications. Investors accumulating during this phase are often betting on this continued ecosystem growth translating into increased demand for TRX.
The Mechanics of a Price Surge Post-Accumulation: Coiling the Spring
Once an accumulation phase is sufficiently mature, the stage is set for a potential "markup" phase, where prices can rise significantly. This happens because the prolonged period of buying by strong hands has effectively absorbed most of the available sell-side liquidity. The "weak hands" – impatient or fearful sellers – have been flushed out.
With a reduced floating supply, even a moderate increase in demand can have an outsized impact on the price. This demand can come from several sources:
1. Breakout Traders: Technical traders who identify the end of the accumulation range and the beginning of an uptrend often jump in, adding to buying pressure.
2. Retail FOMO (Fear Of Missing Out): As the price starts to move decisively upwards and breaks key resistance levels, it attracts attention from the broader retail market, leading to a fresh wave of buying.
3. Positive News Catalysts: Fundamental developments, such as major partnership announcements, technological breakthroughs, or favorable regulatory news, can act as triggers, igniting the demand that the accumulated supply cannot easily meet.
The price action during a markup phase is often characterized by a series of upward impulses, followed by brief consolidations or pullbacks, before the next leg higher. The strength and duration of this surge are often proportional to the length and thoroughness of the preceding accumulation. A well-established accumulation base acts like a coiled spring, storing potential energy that is released during the markup.
Catalysts Beyond Consolidation: What Could Ignite TRON's Rally?
While the on-chain evidence of accumulation and network consolidation provides a strong foundation, several external and ecosystem-specific catalysts could ignite the anticipated price surge for TRON:
1. Broader Crypto Market Bull Run: TRON, like most altcoins, is significantly influenced by the overall sentiment and price action of Bitcoin and the wider cryptocurrency market. A sustained bull market led by Bitcoin would likely lift all boats, providing a favorable tailwind for TRX to realize the potential built up during its accumulation.
2. Major Ecosystem Developments: Significant advancements within the TRON ecosystem could be powerful catalysts. This could include the launch of a highly anticipated dApp, a major upgrade to the TRON protocol enhancing its scalability or functionality (like advancements in its Layer 2 solutions or cross-chain capabilities), or a surge in adoption of its existing DeFi or NFT platforms.
3. Strategic Partnerships and Integrations: New, high-profile partnerships with established companies or integrations with other popular blockchain networks or traditional finance (TradFi) players could significantly boost TRON's credibility and utility, attracting new users and investors.
4. Increased Stablecoin Dominance: TRON is already a major player in stablecoin transactions. Further growth in this area, particularly if it captures more market share or integrates new, popular stablecoins, would solidify its role as a key financial infrastructure and drive demand for TRX for transaction fees and network participation.
5. Regulatory Clarity: Positive regulatory developments in key jurisdictions that provide greater clarity and legitimacy for cryptocurrencies, including TRON, could unlock institutional investment and broader retail adoption.
6. Justin Sun's Influence: While sometimes controversial, Justin Sun remains a highly influential figure in the crypto space. Strategic announcements or initiatives led by him can often generate significant market interest and speculative buying for TRON.
7. Narrative Shifts: The crypto market is often driven by narratives. If a narrative around high-throughput, low-cost Layer 1s for dApps and stablecoin transfers regains prominence, TRON is well-positioned to benefit.
Navigating the Waters: Considerations and Potential Headwinds
While the signs of accumulation and potential for a price surge are compelling, it's crucial to approach the market with a balanced perspective and acknowledge potential risks:
1. Duration of Accumulation: Accumulation phases can be protracted. There's no guarantee of an immediate breakout, and patience is often required.
2. False Breakouts ("Springs" or "Shakeouts"): Markets can experience false breakouts below the accumulation range to shake out remaining weak hands before the true markup begins. Similarly, initial moves upward can sometimes fail and fall back into the range.
3. Market Manipulation: While on-chain data offers transparency, sophisticated actors can still attempt to manipulate sentiment or price in the short term.
4. Overall Market Conditions: A severe downturn in the broader cryptocurrency market or global macroeconomic headwinds could delay or dampen any potential TRON-specific rally, regardless of its strong accumulation pattern.
5. Competition: The Layer 1 blockchain space is fiercely competitive. TRON faces ongoing competition from numerous other platforms, and its ability to maintain and grow its market share is critical.
6. Regulatory Risks: The regulatory landscape for cryptocurrencies remains uncertain in many parts of the world. Adverse regulatory actions could negatively impact TRON and the broader market.
Conclusion: Is TRON Coiling for a Major Move?
The confluence of on-chain indicators – from the subtle yet persistent buying by large holders and the movement of TRX off exchanges to the increasing amount of staked tokens and the underlying consolidation of network activity – paints a compelling picture. TRON appears to be in a classic accumulation phase, a period where the groundwork is meticulously laid for future growth. This isn't the frenetic energy of a market peak, but rather the quiet confidence of informed capital positioning itself for what it anticipates will be a significant upward revaluation.
The network consolidation suggests a strengthening of TRON's core, a pruning of speculative froth, and a concentration of its native token, TRX, into the hands of those with a longer-term conviction. While no outcome in the cryptocurrency market is guaranteed, and risks always persist, the current on-chain trends for TRON are undeniably bullish from a structural perspective.
If this accumulation phase completes successfully and is met with favorable market conditions or specific catalysts within the TRON ecosystem, the subsequent price surge could be substantial. The "coiled spring" analogy is apt; the longer and deeper the compression during accumulation, the more explosive the release can be. For investors and market observers closely watching TRON, the current period of apparent quietude might very well be the deceptive calm before a significant storm of buying pressure and a powerful move upwards, reaffirming the age-old market wisdom that fortunes are often built not in the frenzy of the bull run, but in the patient, strategic accumulation that precedes it. The signs suggest TRON's engines are being primed; the question is not if, but when, they will fully ignite.
Trxbreakout
TRXUSDTTRX Price Analysis – Key Levels to Watch
🔍 Current Price Action:
TRX is currently trading within a tight range, with key resistance at 0.2431 and support at 0.2275. The recent close near 0.2418 indicates a strong battle near the upper resistance zone. A confirmed breakout above 0.2431 could pave the way for bullish continuation. However, failure to break through may trigger a pullback toward 0.2340 or even retest the 0.2275 support level.
📉 Trend Outlook & Next Moves:
A breakout above resistance may drive TRX toward higher price targets with strong bullish momentum.
Conversely, a breakdown below support could indicate a deeper correction ahead.
👉 Keep an eye on price reactions at these critical levels for confirmation of the next trend direction.

TRXUSDT TRXUSDT Price Action Analysis (1H Timeframe)
🔹 Overall Trend: After a strong rally, the price is in a correction phase, currently trading at 0.2291. The key resistance at 0.2300 must be broken for a bullish continuation.
🔹 Bullish Scenario:
A breakout above 0.2300 with confirmation could push the price towards 0.2345 and 0.2435.
If this happens, the bearish structure will be invalidated, increasing bullish momentum.
🔹 Bearish Scenario:
Failure to break 0.2300 may lead to a pullback towards 0.2250 and 0.2205.
Losing 0.2205 could open the way for a deeper drop to 0.2160, a critical support zone.
🎯 Conclusion: Watch key levels closely; a confirmed breakout above 0.2300 signals a buy opportunity, while losing 0.2250 strengthens the bearish outlook.

TRX - asset Punchingasset Punching a slant on a third touchdown.
the target after the breakthrough is the minimum (marked with a blue unit).
I suspect that bad news about this asset is coming.
if you like the idea, please "Like" it. This is the best "Thanks!" for the author 😊 P.S. Always do your own analysis before a trade. Put a stop loss. Fix profits in installments. Withdraw profits in fiat and please yourself and your friends.

TRX/USDT 1H: Smart Money Accumulation – Breakout Incoming?!TRX/USDT 1H Chart Analysis
🚀 Follow me on TradingView if you respect our charts! 📈
Current Market Structure:
Price at $0.22875 showing equilibrium after recent selloff.
RSI recovering from oversold conditions, currently at 54.77.
Clear bearish breaker zone at $0.24000.
Premium zone identified at $0.25500.
Smart Money Concepts:
Market Makers accumulated in the discount zone ($0.20000-$0.20500).
Hidden bullish divergence forming on RSI, suggesting momentum shift.
Liquidity pools likely targeted above $0.24000.
Key Levels:
Entry Zone: $0.22800-$0.22900
Targets:
T1: $0.24000 (Breaker Zone)
T2: $0.25500 (Premium Zone)
Stop Loss: Below $0.21500 (structural invalidation).
Risk Score:
7/10 – Moderate risk with favorable risk-reward ratio.
Market Maker Intent:
Accumulation phase at discount zone nearly complete.
Expecting upward continuation toward premium zone at $0.25500.
Watch for strong reactions at $0.24000 as first liquidity target.
Recommendation:
Long positions favorable in the $0.22800-$0.22900 range.
Monitor volume confirmation above $0.24000 to strengthen bullish bias.
Maintain tight stops below structural invalidation.
Confidence Level:
8/10 for bullish continuation toward premium zones.
🚀 Follow me on TradingView if you respect our charts! 📈

TRX/USDT 1H: Bulls Eyeing $0.2700 After Breaking Key LevelsTRX/USDT 1H Chart Analysis (SMC Principles)
🚀 Follow me on Tradingview if you respect our charts 📈
Current Price: $0.2588
Market Structure:
Bullish momentum after breaking above the POI at $0.2500.
RSI: 63, indicating moderate bullish momentum without overbought conditions.
Key Levels:
Support: $0.2500 (flipped from resistance).
Resistance:
T1: $0.2650 (Premium zone).
T2: $0.2700 (Weekly high).
Equilibrium: $0.2550.
Trade Setup (Confidence Level: 8/10):
Entry Zone: Current price ($0.2588) or pullback to $0.2550.
Targets:
T1: $0.2650
T2: $0.2700
Stop Loss: Below $0.2480 (recent POI).
Risk Score: 7/10 (moderate risk due to extended move).
Market Maker (MM) Analysis:
Heavy accumulation visible at $0.2450-$0.2500.
Current phase shows distribution with sustained buying pressure.
No significant divergences on RSI, supporting continued bullish movement.
Recommendation:
Long position recommended at current levels or on pullback to $0.2550.
Monitor consolidation near $0.2600 for breakout confirmation.
Maintain tight risk management to protect against potential pullback.
Confidence Level: 8/10 for bullish continuation.
🚀 Follow me on Tradingview if you respect our charts 📈

#TRX/USDT Ready to go higher#TRX
The price is moving in a descending channel on the 1-hour frame and sticking to it well
We have a bounce from the lower limit of the descending channel, this support is at 0.2500
We have a downtrend on the RSI indicator that is about to be broken, which supports the rise
We have a trend to stabilize above the moving average 100
Entry price 0.2530
First target 0.2572
Second target 0.2607
Third target 0.2647

TRXUSDT %150 DAILY VOLUME SPIKE | BE CAREFUL NO BUYERS YET1. Volume Spike Context
A 150% volume increase is significant, but without buyers stepping in, this can mean:
Absorption: Large orders are filling on the sell side, suppressing upward movement.
Liquidity Sweep: Price is testing a key zone to trigger liquidity (e.g., stop-losses or limit orders).
2. Blue Box Zones
When price approaches your predefined blue boxes:
Observe how price reacts in those zones on lower timeframes (e.g., 1-minute or 5-minute):
Is price consolidating (building a base)?
Are there sharp rejections (wicks, tight ranges)?
Is price forming higher lows (signs of buyers stepping in)?
3. Upward Breakout Triggers
To evaluate upward breakouts:
Focus on price structure:
A clear break above recent highs on lower timeframes.
Watch for a clean candle close above the range to confirm buyers have control.
Ensure the breakout is not a fakeout:
Price should not immediately drop back into the range after breaking above.
Look for a retest of the breakout level that holds as support.
4.Volume Behavior at Blue Boxes
Even without indicators, you can observe volume visually:
If large volume candles appear near the blue boxes and price holds → buyers may be absorbing supply.
If price starts moving up with minimal retracement → potential for continuation.
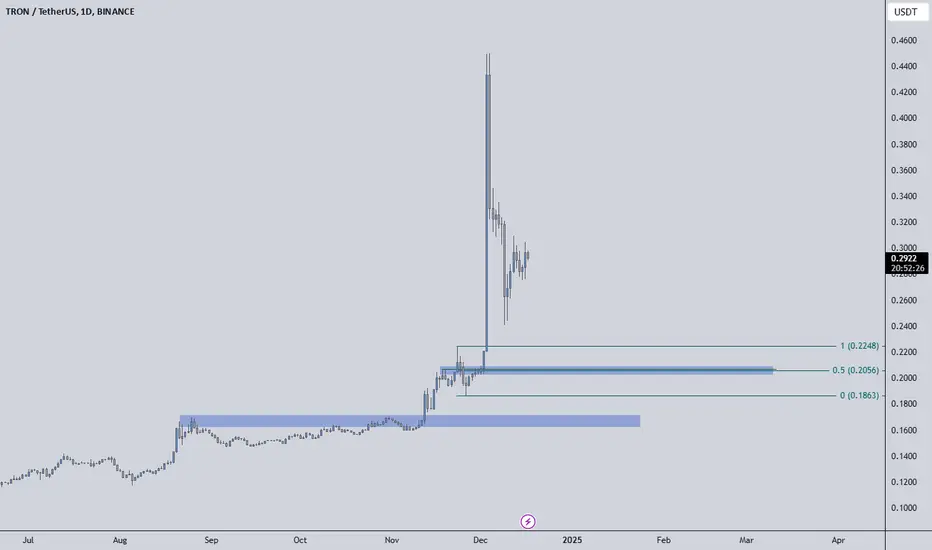
$0.268: Tron TRX Last Stand?Tron is currently trading below the resistance at $0.297, the area characterised by slow and choppy price action.
1. A bounce from the nearby support level at $0.268 could suggest renewed buying interest, setting the stage for a potential move toward $0.297 (Dashed Green Projection).
2. A break and close above this level would indicate bullish strength, opening the path toward the next resistance at $0.339, followed by $0.377, providing room for a broader recovery (Solid Green Projection).
3. Conversely, if TRX fails to hold $0.268, it would indicate increasing bearish momentum, likely triggering a decline toward the key support zone at $0.226 (Red Projection).

Market Outlook: Positive Trends in TRX/USDT Suggest Bullish!Hello Traders,
Just Breaked The Resistance Zone And Taking Support And There is A Potiential Chance To Go Upside!
We have one Resistance Zone, and 2 Supply Zones. The Price Breaked The Resistance Zone, And Becames The Support Zone, Take Entry While Retesting OR Pullback of The Move.
Please Note That The Only Purpose of The Information On This Page is Purely Educational.
I Would Welcome Your Participation And Support in the Form of Likes, Comments, And Follow us to Offer Some Encouragement.
Thank You.

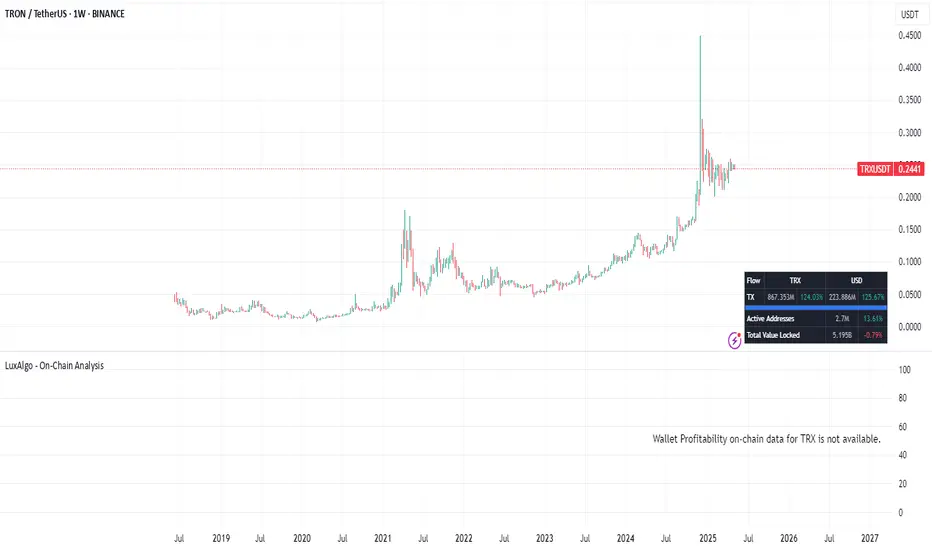
TRXUSDT Approaching Key ResistanceTRX has shown impressive strength, gradually increasing by approximately 260% over the past two years. The price has steadily climbed from its lows, forming a strong uptrend, and is now nearing a critical resistance zone at its previous all-time high (ATH).
If TRX manages to break above this key resistance, it could signal a bullish continuation, opening the path for further upward momentum. A successful breakout would likely attract additional buying interest, potentially leading TRX to explore new highs.
Regards
Hexa

Tron (TRX) completed a setup for upto 20.50% pumpHi dear friends, hope you are well and welcome to the new trade setup of Tron (TRX).
Previously we caught 10% pump of TRX as below:
Now on a daily time frame, TRX with Bitcoin pair has formed a bullish Cypher move for the next pump.
Note: Above idea is for educational purpose only. It is advised to diversify and strictly follow the stop loss, and don't get stuck with trade.

TRX signal#TRON :small_red_triangle_down: moves in an ascending channel in the daily time frame and is in correction mode in the 4-hour time frame.
The price is close to the $0.11120-$0.10520 support area, which is a strong demand area.
Its long-term trend is upward, and the short-term trend is downward. To stabilize the upward trend in the 4-hour time frame, the price must break the dynamic resistance.

TRX Tron Technical Analysis and Trade Idea PLUS My Trading Plan In this video, we delve into a comprehensive technical analysis and trading concept for TRX (Tron). Our assessment reveals a potential trade opportunity. We meticulously analyze the current price action, closely scrutinize market structure, and incorporate market dynamics. Based on favorable conditions, we identify a potential entry point. However, it is crucial to underscore the significance of implementing robust risk management strategies. Please note that this video is purely educational and should not be construed as financial advice.

Cryptolean Tron TRX UpdateTron is having a bearish pullback and trading in the daily range zone where we will continue to see a slow and choppy price action.
A bullish reversal from the current price location reclaiming $0.132 will result in a slow upward move to $0.138.
A confirmation of a break-out of $0.132 will push TRX price towards $0.126.
Intraday Chart
The TRXUSDT 4-Hour chart is bearish and re-testing $0.132, an intraday resistance.
A bearish rejection of $0.132 will result in a bearish dip of Tron price towards the key intraday support zone of $0.128-$0.13which, in turn, could lead to a strong bullish rejection of this support zone.
A bullish break-out of $0.132 will push price higher to $0.134.
Like once read!
Thank you.

TRXUSD Support Channel UpAMEX:TRX perform a good bullish wave, and reach channel up support.
This is a good moment to enter and follow bullish market at TRX.
we can buy now around 0.13620 or wait after bullish confirmation trendline broken up.
I will update this analysis if I found a new key level.
Don't forget to support this analysis to get a quick notification.
Happy trading, Good luck

TRX Has a very healthy Chart.Hi Everyone;
today we have one of the best risk to reward Investment opportunity
it is more than 46 times the risk and the chart is look very promising.
I expect breaking the previous bear market key point will clear the way to the final target

Tron (TRX) completed setup for upto 16% pumpHi dear friends, hope you are well and welcome to the new trade setup of Tron (TRX) with BTC pair.
Previously we caught more than 10% pump of TRX as below:
Now on a daily time frame, TRX formed a bullish AB=CD move for the next pump.
Note: Above idea is for educational purpose only. It is advised to diversify and strictly follow the stop loss, and don't get stuck with trade.

Tron, 5 days consolidationAMEX:TRX inside ascending triangle and already touch fibonacci support 0.10212
this coin already enter accumuation with 5 days and 12 hours consolidation,
you can see I also draw bullish trendline,
in the next hours (not more than 12 hour), this coin will rally to reach triangle resistance,
maybe with little a pump, that indicate the consolidation time already over.
The worst case is fibonacci support at 0.10212 break down, if this happen, I still have ascending triangle support trendline.
My entry :
.10310 current price
.10212 fibonacci support
.10018 Higher low
Target : .11017 Ascending triangle resistance
Risk every entry : .00100
Risk reward ratio : 6.54
Actual profit percentage : 654%
Good luck, happy trading.

TRX fall out of the bullish triangle ?"Over the past days, the TRX cryptocurrency has been steadily constructing what appeared to be a promising bullish triangle pattern. This technical formation, characterized by its converging trendlines and diminishing price volatility, had ignited anticipation among traders for a potential upward surge in value.
However, recent market developments have shifted this optimistic sentiment. The TRX token seems to have broken free from the confines of the bullish triangle. This breach marks a pivotal moment, suggesting a potential change in the prevailing market dynamics. The breakout from the triangle indicates a shift in the balance between buyers and sellers, and it's crucial to assess the implications of this movement.
As the breakout unfolded, the TRX price underwent a testing phase, revisiting the ascending trendline that had previously guided its upward trajectory. This retest of the trendline can serve as a critical confirmation of the triangle's breakdown, potentially signaling a shift towards a downward trend. Traders and analysts are now closely watching whether the price manages to sustain itself above this level, which could indicate a potential recovery, or whether it succumbs to the pressure, implying a further decline in value.

TRX TRONUSD UPWARDS POWERFULL BULL TRENDWhat is TRON?
TRON’s tagline is to “decentralize the web,” and its ecosystem consists of several decentralized applications, some of which are quite well known. However, its primary purpose is to decentralize the content creation and distribution industry, which has received criticism for its censorship and unfair revenue distribution. To this end, TRON provides several tools alongside its protocol to ensure more democratic content creation processes.
Some examples of centralized platforms that have censored videos and held a particularly strong revenue distribution control include YouTube. Indeed, the latter has censored several videos related to the cryptocurrency industry. Monetization is also a commonly discussed pain point related to YouTube. For many whose income depends largely on content, this can have a serious impact on their lives.
The TRON network actually features a number of cryptocurrencies, including BitTorrent Token (BTT), JST, and a TRC-20 based version of the Tether (USDT) stablecoin. TRON has outlined a set of Dapps that work with these tokens, and with BTT at least, that includes BitTorrent Speed, BitTorrent File System, and DLive.
Just (JST) is TRON’s DeFi-focused asset that powers a suite of related services. Within its remit is a stablecoin called JustStable (USDJ); JustLend, a lending platform; and JustSwap, a means to exchange to TRC-20 tokens.
What makes TRON stand out?
On the face of it, there isn’t much that separates TRON from its competitors. After all, all of them could just as well build Dapps that support the same goal as that of TRON. Indeed, many of them already do.
However, with a more focused approach on this matter, TRON perhaps stands a chance to gain ground in this specific niche. With interoperability becoming a focal point of general blockchain development, this could perhaps further cement TRON’s position as a content-focused network.
The unique selling point of TRON is that content on the network can be accessed by anyone, anywhere, with the prerequisite of an internet connection. This helps transcend censorship measures imposed by governments or companies. Several countries with totalitarian governments restrict websites and platforms, and TRON can help in this battle against censorship.
Technical Analysis:
Price has memory. That is a key concept in technical analysis.
One of the basic tenets of the study of price history is “support broken, tends to act as resistance.” The opposite is also a technical analysis maxim, “resistance broken, tends to act as support.” Have you ever considered why you see this play out on a chart so often?
It is simple, it is because of the “anchoring bias.” Briefly, the anchoring bias is the human tendency to rely heavily on the first piece of information encountered when making decisions and then use that initial piece of information to make future decisions.
Think of the price you may have personally paid for a stock. You tend to base your future decisions about that stock based on your purchase price. We calculate risk from that level and we measure our return based on that entry price. For better or worse, we are “anchored” to the price we paid.
Price charts are used in an attempt to understand the collective reasoning and psychology of the participants so we can objectively prepare our trading plan. In the case of traditional (horizontal) support being broken and then acting as subsequent resistance, the more participants who are “anchored” to a price level, the greater a move will become when there is a break of that price point. When price breaks a major level of support, the “trapped longs” will have a propensity to look to get out at “breakeven” the supply from these participants helps to form resistance.
In a trending market, the classic horizontal support and resistance levels are not always obvious. If we want to measure price memory from an “event” the Anchored Volume Weighted Average Price tool is the most effective means to accomplish this task.
First, let’s define an “event.” In the markets, I consider a significant event to be any date from which price movement began or reversed. A short list of such events could be: earnings dates, week to date, month to date, year to date, FDA announcements, Fed announcements or just simple swing highs and lows.
YELLOW ARROWS: These VWAPS were anchored off of significant pullback lows, notice how buyers emerged to defend these levels on subsequent pullbacks. Notice that the longer the anchor point is on the chart, the less sensitive to current price action it will become.
The AVWAP is not just useful on longer term timeframes, it can also reveal some key insights about market behavior on intermediate and shorter-term timeframes
After gapping lower, buyers took control of the TRX and the AVWAP from that swing low provided intraday support on a panic selloff
As buyers became more aggressive on the gap higher, this AVWAP was briefly violated in early December, but then proved to be a good support level as prices stabilized near 0.59
Because of its moving property, the AVWAP can be analyzed in ways like a traditional moving average. Some considerations when using this indicator include; direction and slope of the AVWAP, how far above or below price action is in relation to the AVWAP, etc.
A robust indicator such as AVWAP can be implemented into any trading analysis or strategy. Experiment with various anchor points in you targeted markets and stocks and you will immediately recognize its value. As a stand-alone study or when viewed with other oscillators and indicators, the AVWAP is likely to become one of your favorite analysis tools.
S1 0.61
S2 0.54
S3 0.48
On May 9th 2023 the Donchian Channel breakout has been confirmed by high volatility and volume, RSI +68,a strong sign that the breakout is valid and promissing to start the uptrend

Trx scraping the bottom of the barrel Tron is still rock bottom and as you can see still moving up dragging itself along the bottom of this channel.
So what to expect is constant gains in large percentages to break free from the uptrend line for Tron to have room for a healthy trade environment.
Therefore Tron is way undervalued. Expect the bullrun to begin, and I believe Xrp has started it.

#TRX/USDT on the verge of a Breakout in Weekly.This coin has been trading sideways since June 2022.
A breakout is likely.
Zooming in on the Daily Chart A clear Breakout is visible.
The upcoming weekly close will clear more doubts eventually.
A weekly close above the .07 level will trigger a Bullish rally.
Recommended Entry:- .061 to .066
Targets:- 0.088, 0.097, 0.114, 0.126, 0.1412
Stop loss:- 0.05272
Please observe the chart for more details.
Let me know what you think in the comments.
DO HIT THE LIKE BUTTON IF YOU WANT TO SUPPORT MY CONTENT.
Thank you so much for your support.
#PEACE
