Tesla (TSLA) Shares Among the Biggest Losers AgainTesla (TSLA) Shares Among the Biggest Losers Again
As the chart shows, Tesla (TSLA) shares opened yesterday’s trading session with a bearish gap and closed more than 5% lower than the previous day’s close. Meanwhile, the S&P 500 index (US SPX 500 mini on FXOpen) also declined, but by only around 1%.
Why Tesla (TSLA) Shares Fell
The recent two-day decline may be part of a broader downtrend. As we noted earlier in March, one of the key bearish factors could be Elon Musk’s political involvement in the Trump administration. For investors, this may imply that:
→ A significant number of potential Tesla customers may be put off by Musk’s political stance, slowing sales.
→ The CEO may not be paying enough attention to the company at a time of intense competition. Notably, Chinese EV manufacturer BYD Co. (CN:002594) has announced the launch of its Super e-Platform, which can charge a vehicle with a 400-kilometre range in just five minutes.
This sentiment is reflected in analysts’ decisions, as they continue to lower their target prices for TSLA shares, further fuelling negative sentiment.
TSLA Price Forecast
According to MarketWatch, RBC Capital Markets has cut Tesla’s target price from $440 to $320 due to a worsening outlook for the company’s robotaxi programme and autonomous driving software.
However, RBC analyst Tom Narayan maintained a “Buy” rating on Tesla (TSLA) shares, stating that concerns over a sharp sales drop in Europe and China are “overblown.”
Technical Analysis of Tesla (TSLA) Chart
The previously identified downward channel (marked in red) remains relevant. However, price action suggests that selling pressure may be easing:
→ The decline on 10 March (marked by arrow One) was much more aggressive, but the downward momentum has since slowed (also marked by arrow One).
→ During yesterday’s session, the price closed only slightly below the opening level, suggesting that bears are hesitating near the yearly low.
This could potentially lead to a bullish Double Bottom pattern, increasing the likelihood of an attempt to break above the current resistance around the psychological level of $250.
This article represents the opinion of the Companies operating under the FXOpen brand only. It is not to be construed as an offer, solicitation, or recommendation with respect to products and services provided by the Companies operating under the FXOpen brand, nor is it to be considered financial advice.
Tslaanalysis

Tesla What Next? TSLA Buy Bargain OR Bust?✅️Now you guys know my thoughts on this and although TESLA has been beaten ⚫️black⚫️ and 🔵blue🔵 recently somehow there may be an opportunity on the horizon.🚀
ℹ️ The way I look at it is unless you think TSLA is dead forever and to be cast to the dustbin 🟢SeekingPips🟢 would be looking for a buying opportunity.
👌I don't know who coined the phrase first however it's one that 🟢SeekingPips🟢 loves and uses often it's
⭐️"BUY WHEN THERES BLOOD IN THE STREETS"⭐️
⚠️Now don't get me wrong it doesn't mean I will be loading up gun ho RIGHT AT THIS MOMENT but it certainly DOES MEAN I'M NOT A SELLER AND STALKING BUYING OPPORTUNITIES✅️
❓️What's you thoughts on Tesla❓️
Share your thoughts with 🟢SeekingPips🟢
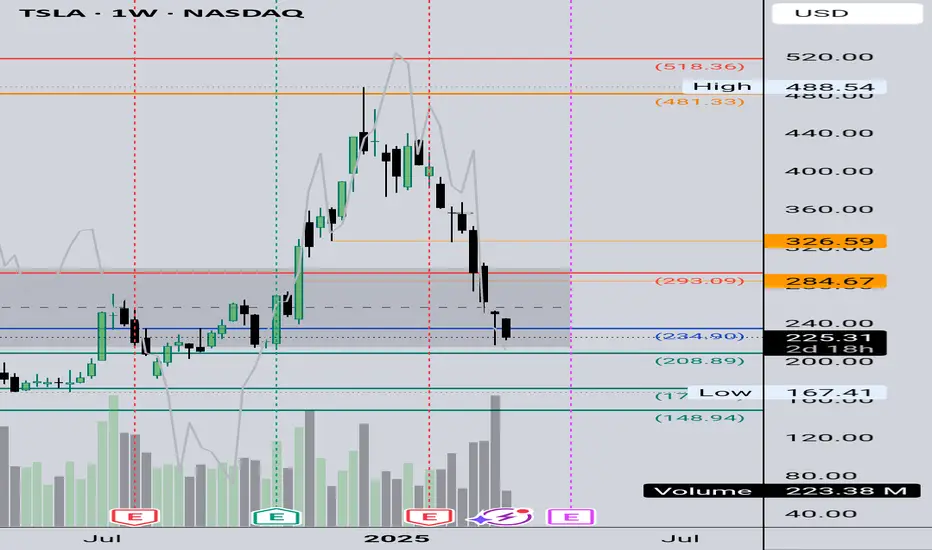
TESLATesla needs some upside against this drop, next reaction level is 290 above.
Disclosure: We are part of Trade Nation's Influencer program and receive a monthly fee for using their TradingView charts in our analysis.

TSLA Trade Outlook – Watching Key LevelsTSLA is currently trading around market price levels, with notable entry points at 222, 199, and 165. Given the recent volatility and broader market sentiment, these levels could serve as potential accumulation zones if momentum aligns.
On the upside, profit targets are eyed at 235, 275, and 295, contingent on sustained buying pressure and macroeconomic factors supporting growth stocks. However, given the unpredictable nature of the market, adjustments may be necessary.
For now, keeping an eye on volume trends and overall market sentiment will be key in confirming potential movements. Flexibility remains essential.
Trade cautiously. 🚀⚠️ Disclaimer: This is not financial advice. Always do your own research and trade responsibly! 💡

TSLA PRICE ACTION 14 MARCH 2024This is the price action of TESLA. Everything is discussed in depth in this analysis. If you have any questions, feel free to leave a comment.
Understand the price action & then trade

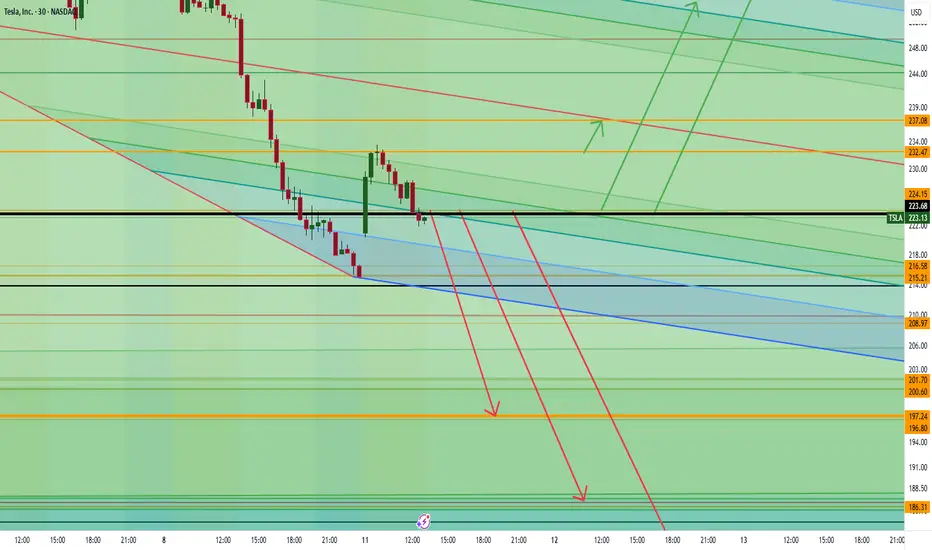
Tesla is About to Collapse… or Skyrocket—Are You In?Tesla is all over the news with boycotts, drama, and market chaos, but the real action is on the charts. If we break below 222, things could get ugly fast with a drop toward 197, 186, and even 176. But if we hold above 223, momentum could send us flying past 232, 237, and potentially 256 or even 264.
Big money is watching, and the next move could be massive. The question is—are you trading this or just watching from the sidelines?
Kris/ Mindbloome Exchange
Trade Smarter Live Better
TSLA (Tesla) long set up Entry 1 $220.00
Entry 2 $200.00
Stop loss $180.00
Take profit 1- $250.00
(Close 33%)
Take profit 2- $290.00
(Close 66%)
Take profit 3-$330
(Close 100%)

Tesla (TSLA) Shares Drop Over 15%Tesla (TSLA) Shares Drop Over 15%
Among the biggest decliners in the technology stock index (we covered the reasons behind the Nasdaq 100’s drop earlier this morning) are Tesla (TSLA) shares, which have plummeted by more than 15% in a single day—their worst performance in five years.
Why Tesla (TSLA) Shares Fell
One of the key bearish drivers behind Tesla’s stock decline appears to be Elon Musk’s political involvement in the Trump administration. For investors, this could signal concerns that:
→ The CEO is not devoting enough attention to the automaker’s operations.
→ Discontent among those who oppose Musk’s political stance could slow Tesla’s sales.
And what about Musk himself? He has:
→ Acknowledged that business is “tough,” particularly following a cyberattack on his social media platform, X, but stated he intends to focus on politics for at least another year.
→ Reassured investors that, in the long run, “everything will be fine.”
Technical Analysis of Tesla (TSLA) Stock Chart
In our previous analysis, we identified a descending channel (marked in red) and suggested that if the psychological support level of $300 per share failed to hold, further declines could follow.
With updated chart data, we can see that:
→ The downward channel remains valid, reinforced by a test of its median line (marked by an arrow).
→ The $260 level (previous support) and $300 may act as resistance going forward, with the orange descending trendline also potentially serving as resistance.
Since the price has now fallen below the lower boundary of the red channel, there is a possibility that bulls may attempt to recover some losses, banking on a long-term rebound.
Tesla (TSLA) Stock Price Forecast
Analysts remain cautiously optimistic, possibly hoping that Musk’s close ties with Trump will accelerate Tesla’s rollout of its robotaxi service. Another potential positive catalyst is Tesla’s market entry into India.
According to TipRanks:
→ 13 out of 36 analysts recommend buying TSLA shares.
→ The average 12-month price target for TSLA is $340.
This article represents the opinion of the Companies operating under the FXOpen brand only. It is not to be construed as an offer, solicitation, or recommendation with respect to products and services provided by the Companies operating under the FXOpen brand, nor is it to be considered financial advice.

TSLA (Tesla) long set upEntry 1 $255.00
Entry 2 $225.00
Stop loss $200.00
Take profit 1- $275.00
(Close 33%)
Take profit 2- $300.00
(Close 66%)
Take profit 3-$325
(Close 100%)

TESLA HAS BOTTOMED! 100% UpsideI believe that NASDAQ:TSLA is getting very close to bottoming out for a multitude of reasons.
In this video we will go over those reasons and what I'm seeing on the charts...ENJOY Friends!
Not financial advice

Tesla to $350: Unleashing the the C wave?"In this video, I break down MARKETSCOM:TESLA ’s short-term bullish potential. If we break above the $350 area, we could see a C-wave completion targeting the descending trendline near $380 by the end of the week. Don’t miss this trade setup

$TSLA Technical Analysis... 2/28/2025!
After reaching the expected target for wave (c), which was predicted to match wave (a), the current decline likely represents wave (d). This decline could continue to 61.8% of wave (a) at $262. If a rebound occurs at this level, it may signal the beginning of a new upward trend, with wave (e) potentially equaling wave (a) at $539
Let's see how it plays out!
NASDAQ:TSLA #TSLA

TSLA’s Next Big Move: Collapse or Skyrocket? Key Levels to WatchTesla (TSLA) is approaching key price levels that will determine its next move.
Potential Downside:
-If TSLA drops below $297, the next level to watch is $292.
-A break below $292 could lead to $283.
-If $283 fails, the price may drop significantly toward $222.
Potential Upside:
-If TSLA reverses, it could rise back to $384.
-A breakout above $384 could push it to $431 and beyond.
If this analysis added value to you, please like and share!
Kris/Mindbloome Exchange
Trade Smarter Live Better

Weekly & Monthly Closing on a Positive Note is Important.Immediate Support is around 355 - 357,
if this level is Sustained on Monthly basis,
we may witness further upside around 400.
However, the monthly candle is not yet closed.
Weekly candle closing above 357 - 360 may confirm
a Morning Star Formation which will be a Positive Sign.
Strong Resistance is around 400 - 415.
Crossing & Sustaining 490, may lead it towards 600.

$Tesla at a Crossroads: $330 Recovery or $259 Drop?Following MARKETSCOM:TESLA 's recent drop to $300, this analysis examines the critical support level that has recently formed and highlights $312.50 that could determine whether the stock recovers toward $330 or continues its downward trend to $259.

Tesla (TSLA) Share Price Drops by Over 8%Tesla (TSLA) Share Price Drops by Over 8%
The Tesla stock chart today paints a grim picture for investors, as TSLA's price during trading on 25 February:
→ fell by more than 8% in a single day;
→ dropped below the psychologically significant $300 per share mark for the first time since early November 2024 (despite nearing $500 in late December 2024).
Why Tesla (TSLA) Shares Have Fallen
Tesla’s sales in Europe fell by 45% in January compared to the same period last year, even as overall EV sales in Europe grew by 37%.
This sharp drop in European sales has heightened concerns that CEO Elon Musk’s political activities are negatively affecting the company’s business.
Technical Analysis of Tesla (TSLA) Stock Chart
Price movements in 2024 formed a key upward trend channel (marked by blue lines), but yesterday’s decline led to a bearish break below the lower boundary of this trend. Specifically:
→ The $330 level, where the lower blue boundary was breached, now appears to be a significant resistance level.
→ The B→C retracement is approximately 50% of the A→B decline – a bearish signal.
→ Price movements in 2025 outline a descending trend channel (marked in red), which is becoming increasingly relevant.
If the psychological support level of $300 per TSLA share fails to hold, the price may continue to decline towards the key $270 level. This level acted as resistance to growth in the second half of 2024 but was broken after news of Trump’s victory.
Tesla (TSLA) Share Price Forecast
Analysts remain cautiously optimistic, possibly hoping that Musk’s close ties with Trump will help accelerate the launch of Tesla’s robotaxi service.
Another potential positive driver could be Tesla’s entry into the Indian market.
According to TipRanks:
→ 13 out of 35 surveyed analysts recommend buying TSLA shares;
→ The average 12-month price target for TSLA is $357.
Trade on TradingView with FXOpen. Consider opening an account and access over 700 markets with tight spreads from 0.0 pips and low commissions from $1.50 per lot.
This article represents the opinion of the Companies operating under the FXOpen brand only. It is not to be construed as an offer, solicitation, or recommendation with respect to products and services provided by the Companies operating under the FXOpen brand, nor is it to be considered financial advice.

Are you a TESLA bull? If so check this out!NASDAQ:TSLA
and just like that Tesla has most likely bottomed...
- Bull Flag
- Volume shelf with GAP
- Wr% downtrend breakout
A bullish cross and green H5 indicator means we will more than likely breakout and head higher!
Short term we retest $400 🎯
Breakout = 🎯$488 🎯 $581
Not financial advice

Stalking TSLA! TESLA is still on SeekingPips RADAR🌍SeekingPips is still a long time holder of TESLA.🌎
⚠️ The secret here is to identify key levels on the HIGHER TIMEFRAME CHARTS.✅️
ℹ️ ALWAYS REMEMBER this, without a TRIGGER there is NO TRADE ✅️

TSLA around a confluence zone : Technical Analysis and ForecastTSLA Technical Analysis and Forecast
Tesla (TSLA) is currently positioned at a critical confluence zone, where both horizontal and ascending trendlines intersect. Should the selling pressure persist and the stock breaks below the $325 level, there is a potential for further downside movement toward a psychological support zone at $300.
It is important to note that TSLA has experienced a significant decline of approximately 33% from its peak on December 18, 2024, which could indicate potential for a rebound at these levels.
Given the stock's current discount, I believe it may present a compelling opportunity for long-term investors. I intend to continue building my position through a disciplined Dollar-Cost Averaging (DCA) strategy, gradually accumulating shares as the price moves lower.
Should TSLA reach the $300 mark, I consider it a strong buying opportunity.
As always, please trade with caution and consider your risk tolerance before making any decisions.


Weakness in $TSLA when $QQQ and $SPY are strongAfter hitting an ATH NASDAQ:TSLA has lost the momentum. The NASDAQ:TSLA stock has lost the 50 Day SMA and the next stops are the 100-Day @ 330 $ and then the next stop is the 200-Day @ 280 $ . For all the Fib Retracement fans check out for the levels 0.786 @ 345 $ and 0.618 @ 293 $.
In contrast S&P 500 and NASADAQ100 are making new ATH and holding on to the gains. So, we might see NASDAQ:TSLA underperforming the NASDAQ:QQQ over the next few weeks. But long NASDAQ:TSLA when it reaches 200-Day SMA.

TESLA PRICE ACTION 6TH FEB 2025This is the price action of TESLA at its very best & exclusively for viewers on trading view.
I have discussed in depth price action of TESLA and if you have any doubts feel free to leave a message or your comments below.

TSLA to the NORTHThis asset started buying after kicking me out of my last trade with just a few dollars. This was because my SL was not below my support level
The market did obeyed the support for that zone.
For today, I will buy TSLA at $399 and $400 as my entry.
My entry and SL are on my chart with TP
This is a Risk Reward of 1:2
