#Ufo reaching a pennant target strong momentum being shown.
will see what it does as it approaches the ATH
and what kind of structure it builds
or if it is to go right through
I see it is now listed on Bitmart and Gate.io
so strides are being made by the team obviously.
Uniswap

#UNI Uniswap 1D - Big Move ComingHello friends, today I am reviewing the 1D chart for Uniswap (UNI) on a linear scale.
In the chart I noted:
1) The price has been in a long term triangle with a breakdown since May 2021.
2) Currently, the price hit the bottom of the long term trendline since January 2021 and bounced off of it.
3) The price has the potential to move up about 20% to around $25.41.
3) The RSI came out of the oversold region and has potential to bounce towards the top trendline.
4) The Ichimoku Cloud is above the price and at the top of the cloud is where the resistance is.
5) The Volume is currently very low. If volume comes in, we may be able to break out of this long term triangle.
What are your opinions on this?
If you enjoy my ideas, feel free to like it and drop in a comment. I love reading your comments below.
Disclosure: This is just my opinion and not any type of financial advice. I enjoy charting and discussing technical analysis. Don't trade based on my advice. Do your own research! #cryptopickk

🆓Uniswap (UNI) Nov-19 #UNI $UNIUNI dropped quite strongly after failing to conquer the $28 zone. The $18 and $20 zone is a good support zone where we can start accumulating UNI for our targets at $24, $28, $32 and $36 in the near term. But if it loses the $18 zone, it will continue to plummet to the $14 zone
📈RED PLAN
♻️Condition : If 1-Day closes ABOVE 18$ zone
🔴Buy : 20 - 18
🔴Sell : 24 - 28 - 32 - 36
📉BLUE PLAN
♻️Condition : If 1-Day closes BELOW 18$ zone
🔵Sell : 18
🔵Buy : 14
❓Details
🚫Stoploss for Long : 10%
🚫Stoploss for Short : 5%
📈Red Arrow : Main Direction as RED PLAN
📉Blue Arrow : Back-Up Direction as BLUE PLAN
🟩Green zone : Support zone as BUY section
🟥Red zone : Resistance zone as SELL section

UNI bullish scenarioUNI has a bullish structure with low volatility about to breakout and an easy trade since stop can be placed below 50% of the channel.
Targets are in the chart,
Good Luck

uni/usdt for midtermit seems uniswap will go up to 31$ in midterm view after breaking the down trend line.

Uni is ready to take move to 25.03$BTC shaked since last few hours, it is a decision moment of all coins either to move up or down... in my opinion BTC will consolidate between 60-63K for 2 days then there will be a dump again which will be heavy one.... I wish uni will go up now to at least 25.03$.
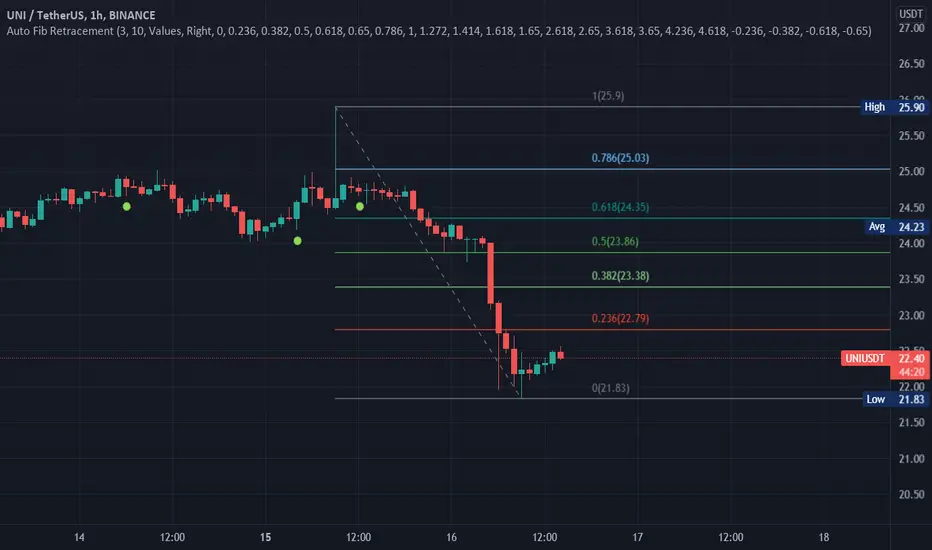
uniusdt long stoploss at: 24,012
when the price reached the first target take the stoploss to the entry price

MATE - New kid on the blockSimple chart on this new promising project called MATE
Why I'm posting this?
Bottom looks to be in.
Nice volume candle on the daily.
Recently added roadmap and as I know by now, MATE devs always deliver.
This is a mid to long term hold and could be very profitable, it's a must-have at this price for every portfolio.
SOME FACTS
What is MATE?
Mate is a DEX, you can compare it to Uniswap and Pancakeswap but with one very big advantage - YOU CAN SET LIMIT ORDERS!
Also has a high (but sustainable) yield on farming and staking has been released. Total decentralization by governance release is coming to.
How is MATE distributed?
MATE is a fair launch token that can be earned by adding liquidity and adding it to the MATE farm. (APR at the moment is 373%)
Some tokenomics (to date 13-11-2021)
Max supply: 100.000.000
Current circulating supply: 5.983.297
Marketcap atm: $ 925.085
Roadmap to end 2021
GOVERNANCE
Contribute your ideas using xMATE governance token
WEBSITE V2
Showcasing the features, use cases and upcoming developments
DEX AGGREGATION
More powerful limit order filled at best price across AMMs
MULTICHAIN
Partnership with a new L1
Enjoy the moment to get in before the marketing starts.

UNISWAP BREAKOUT and LAUNCH coming soon!UNISWAP has broken out of large pennant flag with retest of the Trendline and bounce above last candle high. Rising MACD with cross Above ZERO Line. Similar chart to LINK, ALGO, and so many other crypto charts. RISK 1% of my account.
Entry = $ 26.70
SL = $21.82
TP = $53
R = 5.4

Conservative Estimate of Uni Price 2023UNI has been following this uptrend on the day chart for some time now. It appears that if it continues increasing in value at this rate we could see - on the low end - UNI at $43 by Jan 2023.


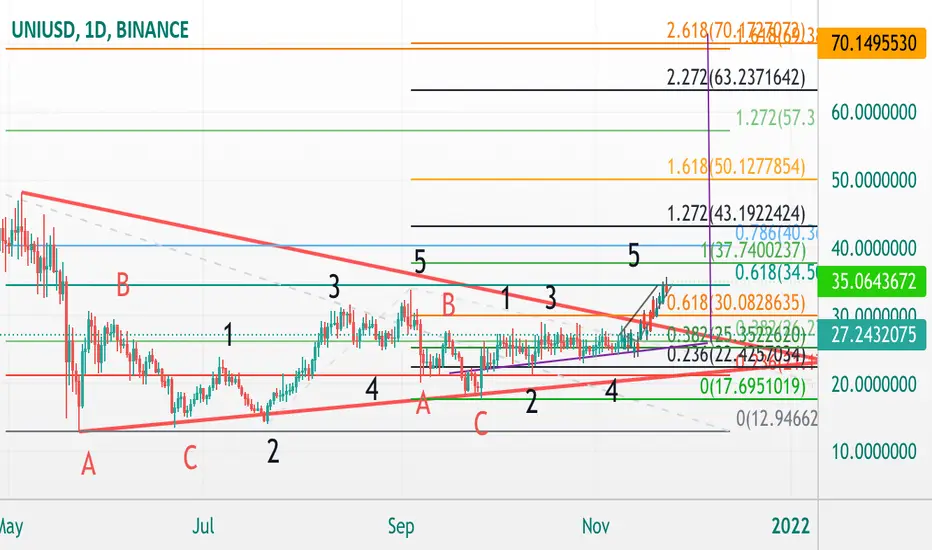
$Uni time to wake upHello cryptofolks
Uniswap roadmap in chart
I expect 2 targets for now
$35 and $70
-Goodluck
Breakout imminent! UNI$uni #uniswap making a move to break out of symettrical triangle and horizontal resistance on LTF.

UNI finds support above $25 and tests the $26 price levelUniswap price analysis is bullish today.
UNI/USD set a higher low at $24.5 over the weekend.
Uniswap currently tests the $26 mark.
The Uniswap price is rising today, as we saw a significant recovery after a drop to $24.5 over the weekend. As a result, we anticipate UNI/USD to rise further, with the next significant barrier at $27.5

UNI/USDT looking good UNI is really looking good and it is ready for the breakout.
support and resistance are marked.
Tp 1 31.5
TP 2 45
after TP 1 move sl to entry

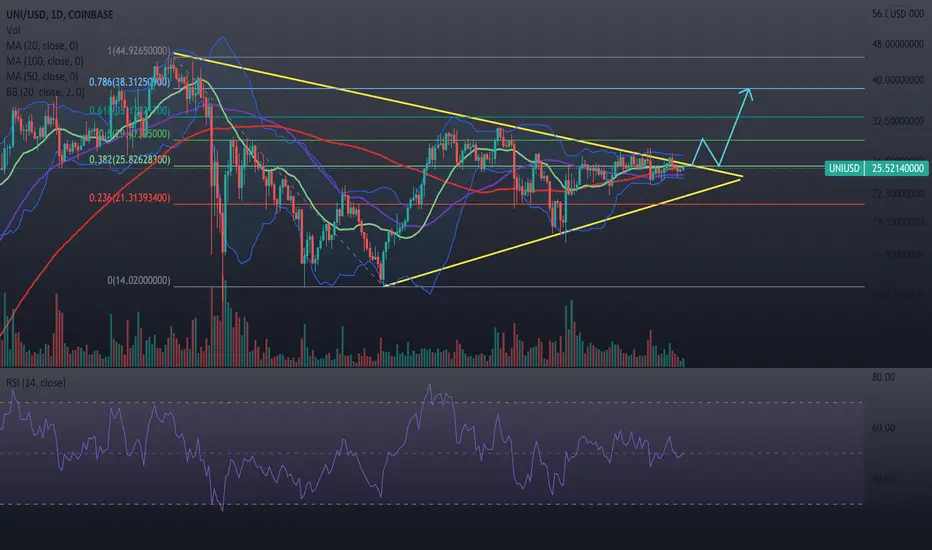
Uniswap is getting ready to have a massive breakout.All of the symptoms are there. The Bollinger bands are narrowly contracted on the daily. The RSI is consolidating around the 50% level. Volume is trending lower as we get closer to the apex of the symmetrical triangle. We're in a strong bull run for BTC. What else can you ask for folks. Trades don't get easier than this.
UNI returns above $25, further recovery to follow?Uniswap price analysis is bullish today.
UNI/USD set a higher low at $24.5 over the weekend.
Uniswap currently tests the $26 mark.
Uniswap price analysis is bullish today as we saw a strong recovery after a spike lower to $24.5 over the weekend. Therefore, we expect UNI/USD to continue higher with the next major resistance at $27.5

$UNI Uniswap climbing higher and higher$UNI Uniswap
Swap, earn, and build on the leading decentralized crypto trading protocol.
Slowly climbing higher and higher. In a symmetrical triangle right now, break out in the coming days.
Volume is low if that will change Uniswap will make you a profit trade.
Take profits on the road up and down ;)
DYOR and let me know what you think. Thanks!


UNIUSDT Breakout?UNIUSDT along with LINKUSDT is reaching the bull market support band. DeFi projects have been slowly bleeding against ETH for nearly half a year. is this the time for DeFi to break-out to new valuations?

Uniusdt Attractive to buyHello friends, attractive shopping areas have been identified. I hope you can make enough profit from this currency codeHello friends, attractive shopping areas have been identified. I hope you can make enough profit from this currency code

Uniswap (UNI)Hi everyone,
This is my description:
Purple Lines: Support & Resistance (for a week) “VERY IMPORTANT”
Blue Lines: Support & Resistance (for a day) “IMPORTANT”
Orange Lines: Support & Resistance (for a 4H)
Thanks for your attention.
**IF YOU WANT ME TO ANALLYSIS ANY OTHER CRYPTOS, PLEASE COMMENT THE NAME OF IT FOR ME**

UNI FLY NEXT NEW ATH 50UNI SWAP , NEW LOUNCH COMMING, EVENT, VALUE AND , Now Ready to move new level 1 by 1 touch 50 USD
