NAS100 Testing Lows: Will a Bounce Offer a Sell Opportunity?NAS100 Technical & Fundamental Analysis 🧐
Overall Sentiment: The current market sentiment surrounding tech stocks and the broader indices like the NASDAQ 100 appears cautious, leaning bearish. Factors like persistent inflation concerns, uncertainty around the Federal Reserve's future interest rate path 🏦, and ongoing geopolitical tensions can weigh heavily on growth-sensitive assets like tech stocks. Keep an eye on upcoming economic data releases (CPI, PPI, FOMC minutes) as they could significantly sway sentiment.
1. Daily Timeframe (D1): The Bigger Picture 🗺️
The NAS100 is exhibiting clear bearish characteristics on the daily chart, forming lower highs and lower lows.
Price is currently approaching or testing a significant area of previous daily equal lows. This is a critical zone ⚠️. Why? Because significant buy-side liquidity often rests below such lows (in the form of stop-loss orders from long positions) and sell-side orders may trigger if these levels break decisively.
A strong break and close below these daily lows could signal a continuation of the major downtrend, potentially accelerating selling pressure. Conversely, this area could act as temporary support, prompting the pullback you're anticipating.
2. 4-Hour Timeframe (H4): The Setup Structure 🏗️
My H4 chart clearly illustrates the recent sharp decline. Price is currently testing the support zone highlighted (around 17,800 - 18,000), which corresponds to the 0.00% Fibonacci level (17,973.8) drawn from the recent swing high (~19,117.4).
This support zone aligns with the concept of hitting the daily lows/liquidity area.
Anticipated Scenario:
I am expecting a reaction (a bounce/pullback) from this current zone. The projected path suggests a retracement towards the 50% Fibonacci level (Equilibrium) at approximately 18,547.3. This level often acts as significant resistance after a strong impulse move. The 61.8% level (~18,682.6) is also a key area to watch just above it.
Point of Interest (POI):
The zone between the 50% and 61.8% Fib levels (roughly 18,550 - 18,700) is your key decision area for a potential short entry. 👍
3. 15-Minute Timeframe (M15):
Entry Confirmation Trigger 🔫
The M15 timeframe will be crucial if price reaches your H4 POI (around the 50% Fib level).
What to Look For: During the potential pullback towards ~18,550, the M15 will likely show a temporary bullish structure (higher highs and higher lows).
Confirmation Signal:
For your short setup, you'd want to see this M15 bullish structure fail upon reaching the H4 resistance zone. Look for:
A break of market structure (BOS) to the downside on M15 (price making a lower low after failing to make a higher high).
Formation of clear M15 lower highs and lower lows.
Bearish candlestick patterns (e.g., engulfing candles, pin bars/shooting stars) rejecting the H4 resistance/Fib level.
Potential divergence on indicators like RSI or MACD (though price action is primary).
Synthesized Outlook & Strategy:
The NAS100 is undeniably in a bearish phase across multiple timeframes. The current test of daily lows / H4 support (~17,973) is a critical juncture. A bounce from here seems plausible, aligning with your expectation of a pullback.
The Strategy:
Patience: Wait for price to potentially rally towards the H4 50%-61.8% Fibonacci retracement zone (~18,547 - ~18,682). 🧘♀️
Confirmation:
Monitor the M15 timeframe closely as price approaches this zone. Look for a clear shift in market structure from bullish (pullback) to bearish (resumption of trend). 📉
Entry: If bearish confirmation occurs (M15 BOS), consider a short entry.
Targets:
Initial targets could be the recent lows (~17,973), followed by the Fibonacci extension levels shown on your chart (e.g., -50% at ~17,400.4) or the area below the daily equal lows. 🎯
Risk Management: Crucially, define your stop-loss level (e.g., above the swing high formed during the M15 structure break or above the 61.8%/78.6% Fib level) to manage risk effectively. 🛡️
Fundamental Check:
cross-reference this technical setup with any major news releases or shifts in market sentiment that could invalidate the pattern. 📰
Us100

A Tolled BellThe first bell has rung. A bridge is being paved across the $6000 range.
IF it blows up, it likely won't happen until the bridge is constructed and sentiment improves. Expect a few heartfelt endeavors to shoot above $6,660. Base case is long term crab market.

US100 Will Grow !
HI,Traders !
US100 is trading in an
Uptrend and the price is
Now consolidating above
The horizontal support
Of 18178.2 and as we are
Bullish biased we will be
Expecting a further bullish
Move up !
Comment and subscribe to help us grow !

NASDAQ: Stop the noise. Long term investors are buying here.Nasdaq may be recovering on its 1D technical outlook but remains bearish on the 1W (RSI = 37.616, MACD = -451.790, ADX = 38.564) as the timeframe is still under the dramatic effect of the 3 month correction. The market however appears to be finding support a little over the 1W MA200 and may turn out to be the new long term technical bottom as the 1W RSI rebounded from oversold grounds.
The last three times that happened, the index rose aggressively. The 15 year pattern is a Bullish Megaphone and every rally inside it obviously gets stronger. As long as the market is holding the 1W MA200, the trend will be bullish and this is the right opportunity to buy for the long term, aiming at another +113.90% bullish wave (TP = 36,000) to get hit towards the end of 2027.
## If you like our free content follow our profile to get more daily ideas. ##
## Comments and likes are greatly appreciated. ##

US 100 - At a Critical Crossroads The US 100 index shows intriguing price action as it navigates key technical levels. Currently trading at 18,967.2 , the market has formed a clear double top pattern at the resistance zone, suggesting potential exhaustion in the uptrend.
Key Technical Observations:
The chart reveals strong resistance near recent highs around 19,024.3 , with price struggling to break through this ceiling. Below current levels, we spot a double bottom formation that previously provided support, creating an interesting tension between these patterns.
Notable price levels include:
- Resistance: 19,024.3 (double top confirmation)
- Support: 18,961.7 (recent swing low)
- Critical zone: The weakened gap that remains to be filled below current prices
Market Dynamics:
The minimal +0.02% change indicates indecision at these levels. The presence of liquidity pools both above and below suggests potential for volatility when either side gives way.
Trading Considerations:
A break above the double top resistance could signal continuation of the uptrend, while failure to hold current levels may see price test lower supports to fill the gap. The tight range between 18,961.7 and 19,024.3 suggests an impending volatility expansion.
The market appears to be at an inflection point where the next directional move could be significant. Traders should watch for either a confirmed breakout above resistance or breakdown below support before committing to positions.
Final Note: This technical setup presents clear risk/reward opportunities, but requires confirmation before acting. The double top pattern would only be validated by a break below the interim support levels.
Disclaimer: Market conditions can change rapidly. This analysis represents one interpretation of current price action and should be verified with additional indicators. Always use proper risk management.

US100 - Lots of opportunities unfoldingChart Overview:
This analysis focuses on the US 100 (NAS100) index, sourced from CAPITAL.COM . The chart highlights critical price levels, Fair Value Gaps (FVGs) , and a Buy side liquidity (BSL) , offering actionable insights for traders.
Key Observations:
1. Price Action & Structure:
- The index has shown significant volatility, with a clear Break of Structure (BSL) indicating a potential shift in market sentiment.
- The price is currently navigating between key support and resistance zones , marked by horizontal levels.
2. Fair Value Gaps (FVGs):
- Two prominent FVGs are visible on the chart, representing areas where price may revisit to fill imbalances. These zones often act as magnet levels for price retracements.
- Traders should monitor these FVGs for potential entry or exit opportunities , depending on price reaction.
3. Critical Price Levels:
- Resistance Zones:
- 20,250.0 : A major psychological barrier.
- 19,750.0 - 20,000.0 : Intermediate resistance cluster.
- Support Zones:
- 17,000.0 - 17,250.0 : Strong historical support.
- 16,000.0 : A pivotal level for long-term bias.
Trading Strategy:
- Bullish Scenario: A break above 20,250.0 could signal further upside, targeting 20,500.0 and beyond.
- Bearish Scenario: A drop below 17,000.0 may confirm a deeper correction, with 16,250.0 - 16,000.0 as the next target.
- FVGs as Confluences: Use the identified FVGs alongside volume and momentum indicators to refine entries.
Timeframe & Validity:
This analysis is based on the daily timeframe (Apr 19, 2025) and remains valid until key levels are breached or new structures form.
Final Notes:
Always pair this analysis with risk management (stop-loss, position sizing) and confirm with additional indicators (RSI, MACD, volume). The market may fill FVGs before continuing its trend.
Like, follow, and comment if you found this useful! Happy trading!

Nasdaq insights: 16-APRIL-2025Good morning, traders! As a seasoned price action trader, I'll share my Nasdaq insights to help you improve your trading skills.

Nasdaq analysis: 15-APRIL-2025Good morning, trading community! Today's Nasdaq analysis is for you. Share your thoughts, ask questions, and let me help you grow.

NASDAQ Trump's 2 TRADE WARS are identical! What you need to knowNASDAQ (NDX) had a massive bullish reversal 1W candle last week as, despite a Lower Low opening, the intra-week rebound surpassed the opening of the previous week. The sell-off reached almost as low as the 1W MA200 (orange trend-line) , which has been the Support level of the late 2022 Inflation Crisis bottom and has been untouched for more than 2 year.
This is not the first time we see this pattern. In an interesting twist of events, we saw the exact same formation during Trump's 1st Trade War, which bottomed on the week of December 24 2018, near the 1W MA200 as well and exactly on the 0.382 Fibonacci retracement level from the Top.
The similarities don't stop there as both Trade War periods were manifested within Megaphone patterns. Their sell-off/ Bearish Leg was -25% (now) and -23% (2018) respectively, while the set-up leading to those Megaphones was a +103.50% and +113.50% Bull Cycle respectively. Also both sell-offs got an oversold (30.00 or lower) 1W RSI bottom.
So, since NDX has currently completed a -25% correction near the 1W MA200 and the 0.382 Fib with the 1W RSI bouncing off the oversold barrier, it is very likely that we've formed the pattern's bottom, especially if the global fundamentals point towards trade deals.
If this Low remains intact, we expect a similar +35% short-term Top at 22500 within a 3-4 month period and then long-term rally near the -0.382 Fibonacci extension at 29000.
-------------------------------------------------------------------------------
** Please LIKE 👍, FOLLOW ✅, SHARE 🙌 and COMMENT ✍ if you enjoy this idea! Also share your ideas and charts in the comments section below! This is best way to keep it relevant, support us, keep the content here free and allow the idea to reach as many people as possible. **
-------------------------------------------------------------------------------
💸💸💸💸💸💸
👇 👇 👇 👇 👇 👇

Nasdaq market analysis: 14-APRIL-2025Good morning! Happy New Week! Here's your daily Nasdaq market analysis. Learn, grow, and trade wisely.

Trade the Structure: NAS100 Possible Retrace & Buy OpportunityThe NAS 100 recently broke its market structure after a twist in trade policy—with Donald Trump delaying tariffs by 90 days—which sparked a robust rally. On the 4‑hour chart, we're looking for a bullish setup where the initial surge might be followed by a pullback into a sideways accumulation zone. This consolidation is expected to form a "spring" pattern—a brief retest that could trap sellers—followed by a clear break of market structure that signals a renewed upward move. The entry is ideally on the breakout, backed by supportive volume, while risk management is maintained with a stop-loss positioned just below the range if/when price retraces into support. 🚀📈💰

Tactical US100 Trading: Converting 1W Trend into 30m Opportunity📈 The US100 index is currently exhibiting a bearish trend pattern on the weekly timeframe. We can observe a notable rally followed by a retracement into equilibrium when analyzed against the previous price wing range.
🔎 Currently, the index is positioned at a premium level, creating an environment where short sellers might be building positions in anticipation of further downward movement. However, market dynamics remain highly sensitive to external influences, particularly unexpected statements and social media announcements from influential figures like Donald Trump.
🌊 With such market unpredictability in play, focusing on shorter timeframes provides more actionable intelligence. Price action signals offer clearer guidance in this volatile environment.
⚡ Trade Opportunity: The 30-minute chart reveals a defined trading range worth monitoring. A definitive break above this range could present an opportunity to enter long positions, while a breakdown below support might signal a favorable short entry point.
🎯 This breakout strategy enables traders to respond to actual market movements rather than attempting to forecast the broader market direction—a particularly valuable approach given the current unpredictable market landscape.
⚠️ DISCLAIMER: This analysis is provided for informational purposes only and does not constitute financial advice. Trading carries significant risk of capital loss and may not be appropriate for all investors. Historical performance does not guarantee future outcomes. Always perform independent research and consider your personal financial circumstances before executing any trades. Market conditions are subject to rapid changes, and no trading methodology ensures profits. The information presented should be used as one of many inputs in your decision-making process.

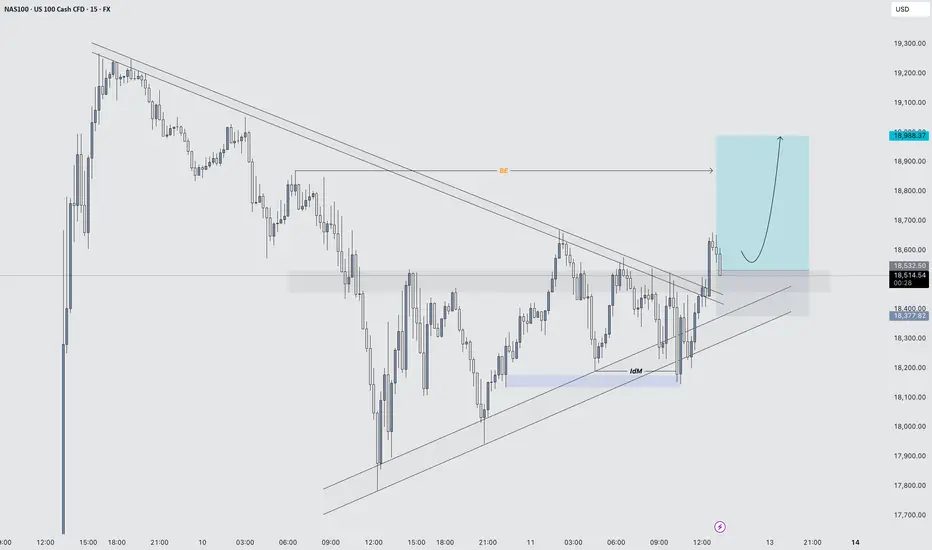
NAS100 (15min) – Bullish Entry Activated1. Symmetrical Triangle Formation
Price was compressing inside a symmetrical triangle, with a series of lower highs and higher lows, indicating indecision and buildup of pressure.
2. Downside Fake-out (False Breakout)
Price briefly broke below the lower trendline, suggesting a potential bearish breakout.
However, there was no strong follow-through; instead, price quickly reclaimed the trendline and pushed back inside the structure.
This is a classic fake-out, often trapping late sellers and providing liquidity for buyers.
The rejection from the lows resulted in a long wick, signalling strong buying interest and failure to break down.
3. Aggressive Bullish Reaction
After reclaiming the triangle support, price moved rapidly back to the top of the triangle.
The next key move was a strong breakout above the upper trendline, confirming bullish intent.
4. Break and Retest
Price action followed through with a clean breakout above resistance, followed by a minor pullback and retest of the broken trendline, which held as support.
This retest offered a textbook entry point based on price action principles.
5. Bullish Structure Confirmation
Post breakout, price formed a higher low and continued to make a higher high, confirming a trend shift.
This structural change strengthens the bullish outlook.
Inversion Fair Value Gaps (IFVGs) - A Deep Dive Trading GuideIntroduction
Inversion Fair Value Gaps (IFVGs) are an advanced price action concept rooted in Smart Money theory. Unlike standard Fair Value Gaps (FVGs), IFVGs consider the idea of price revisiting inefficiencies from an inverse perspective. When price "respects" a previously violated gap from the opposite side, it creates a powerful confluence for entries or exits.
This guide will cover:
- What an IFVG is
- How it differs from traditional FVGs
- Market context for IFVG setups
- How to trade them effectively
- Real chart examples for clarity
---
What is an IFVG?
An Inversion Fair Value Gap (IFVG) occurs when price trades through a traditional Fair Value Gap and later returns to that area, but instead of continuing in the original direction, it uses the gap as a support or resistance from the other side.
Standard FVG vs. IFVG:
- FVG: Price creates a gap (imbalance), and we expect a return to the gap for mitigation.
- IFVG: Price violates the FVG, but instead of invalidation, it respects it from the other side.
Example Logic: A bullish FVG is formed -> price trades through it -> later, price revisits the FVG from below and uses it as resistance.
---
Structure and Market Context
Understanding structure is key when trading IFVGs. Price must break structure convincingly through a Fair Value Gap. The gap then acts as an inversion zone for future reactions.
Ideal Market Conditions for IFVGs:
1. Market is trending or has recently had a strong impulsive move.
2. A Fair Value Gap is created and violated with displacement .
3. Price retraces back to the FVG from the opposite side .
4. The gap holds as support/resistance, indicating smart money has respected the zone.
---
Types of IFVGs
1. Bullish IFVG: Price trades up through a bearish FVG and later uses it as support.
2. Bearish IFVG: Price trades down through a bullish FVG and later uses it as resistance.
Note: The best IFVGs are often aligned with Order Blocks, liquidity levels, or SMT divergences.
---
How to Trade IFVGs
1. Identify a clear Fair Value Gap in a trending market.
2. Wait for price to break through the FVG with momentum .
3. Mark the original FVG zone on your chart.
4. Monitor for price to revisit the zone from the other side.
5. Look for reaction + market structure shift on lower timeframes.
6. Enter trade with a clear stop loss just beyond the IFVG.
Entry Confluences:
- SMT divergence
- Order Block inside or near the IFVG
- Breaker Blocks
- Time of day (e.g., NY open)
---
Refined Entries & Risk Management
Once the IFVG is identified and price begins to react, refine entries using:
- Lower timeframe market structure shift
- Liquidity sweeps just before tapping the zone
- Candle closures showing rejection
Risk Management Tips:
- Set stop loss just beyond the IFVG opposite wick
- Use partials at 1:2 RR and scale out based on structure
- Don’t chase missed entries—wait for clean setups
---
Common Mistakes to Avoid
- Confusing IFVG with invalidated FVGs
- Trading them in low volume or choppy conditions
- Ignoring market context or structure shifts
- Blindly entering on first touch without confirmation
Tip: Let price prove the level—wait for reaction, not prediction.
---
Final Thoughts
IFVGs are an advanced but powerful tool when used with precision. They highlight how Smart Money uses inefficiencies in both directions, and when combined with other concepts, they can form sniper-like entries.
Practice finding IFVGs on historical charts. Combine them with SMT divergences, OBs, and market structure, and soon you’ll start seeing the market through Smart Money eyes.
Happy Trading!

Gold TA 25.4.5Hello everyone, I hope you're doing well. In the 1-hour timeframe, the price of gold has taken a downward trend and has formed two lower lows. There is a very strong order block visible on the chart, and I expect that after the price retraces to this order block, it will react and continue to move down. We will wait for the price to reach this order block, then in the 5-minute timeframe, we will take the right trades and enter a short position. Keep in mind that in higher timeframes, the market is moving upwards, so short positions carry higher risk.
⚠️ This Analysis will be updated ...
👤 Sadegh Ahmadi: GPTradersHub
📅 25.Apr.5
⚠️(DYOR)
❤️ If you apperciate my work , Please like and comment , It Keeps me motivated to do better

Bitcoin TA 25.4.12Bitcoin is currently correcting towards the range of 87 to 90 thousand dollars, and after that, we will enter a short position if we see a valid setup. The target levels are 74 thousand dollars, 70 thousand dollars, and lower targets can also be observed in this view. We will wait for the valid setup before entering the short position.
⚠️ This Analysis will be updated ...
👤 Sadegh Ahmadi: @GPTradersHub
📅 25.Apr.12
⚠️(DYOR)
❤️ If you apperciate my work , Please like and comment , It Keeps me motivated to do better

NAS100 Triangle Apex – Breakout or Breakdown ImminentBullish View:
• Price is forming higher lows and holding above the lower ascending trendline.
• A breakout above the upper descending trendline near 18,500 would confirm bullish
momentum.
• If the breakout is sustained, potential upside targets include 18,650 and 18,800.
Bearish View:
• Price has tested the lower support trendline and shown weakness near the apex of the
triangle.
• A breakdown below 18,100 would indicate bearish momentum and invalidate the ascending
structure.
• If the breakdown is sustained, potential downside targets include 17,950 and 17,700.

Actionable Nasdaq insights: 11-APRIL-2025Rise and shine, traders! Start your day with actionable Nasdaq insights. Let's grow your skills together, one chart at a time.

Nasdaq is not done yet, dont be fooled! On Wednesday, April 9, 2025, the Nasdaq experienced a significant 15% surge, driven by news catalysts. This upward movement aligned with the price reaching the daily Fair Value Gap (FVG), effectively absorbing all internal liquidity at that level. The critical juncture now lies in how the Nasdaq (NQ) performs over the next few days. Should we see a retest and breach of the recent highs from this news-driven rally, it could signal a strong potential for the index to achieve new all-time highs (ATH). Conversely, if the momentum falters and fails to sustain these levels, a swift decline toward 16,000 could materialize, with a further potential downside target of 14,000.

DOW JONES INDEX (US30): Bearish More From Resistance
It looks like US30 is returning to a bearish trend again.
I see a strong bearish sentiment after a test of a key daily resistance.
The price formed an inverted cup and handle pattern and we see
a strong bearish imbalance with London session opening.
Goal - 39.685
❤️Please, support my work with like, thank you!❤️
I am part of Trade Nation's Influencer program and receive a monthly fee for using their TradingView charts in my analysis.

Nasdaq insights: 10-APRIL-2025Rise and shine, traders! Start your day with actionable Nasdaq insights. Let's grow your skills together, one chart at a time.

Nasdaq market analysis: 09-APRIL-2025Good morning, traders! Welcome to today's Nasdaq market analysis. Compare my price action insights with your own charts and enhance your trading skills.

NASDAQ: Cyclical correction most likely completed. ATH by June?Nasdaq remains oversold both on its 1D (RSI = 25.630) and 1W (RSI = 28.851, MACD = -442.980, ADX = 36.399) technical outlook as yesterday's rally is being corrected today on strong technical selling. Long term it looks like this was a cyclical correction, reached -25%, hit the 3W MA50/1W MA200 zone (which has been the best buy entry in the past 10 years) that has most likely been completed. In addition, the 1W RSI is on the same oversold levels as May 16th 2022, the lowest it has been since 2008. According to the Fibonacci Channel Up, the market can hit 22,300 as early as June.
## If you like our free content follow our profile to get more daily ideas. ##
## Comments and likes are greatly appreciated. ##
