Will the stock market turn positive again?!The index is trading below the EMA200 and EMA50 on the four-hour timeframe and is trading in its descending channel. If the index moves down towards the specified demand zone, we can look for further buying opportunities in Nasdaq. A break of the resistance range and the channel ceiling will also cause the Nasdaq to continue its short-term upward trend.
In February 2025, the U.S. labor market grew at a slower pace than anticipated. According to published data, non-farm employment increased by 151,000 jobs in January, while expectations were set at 160,000.This indicates that while job growth continues, its momentum has been weaker than projected.
The unemployment rate rose to 4.1% in February, slightly above the expected 4%. Meanwhile, labor force participation declined by 0.2 percentage points to 62.4%. Average hourly earnings increased by 0.3% during the month, aligning with forecasts. On an annual basis, wage growth reached 4%, slightly below the estimated 4.1%.
Among various sectors, the highest job gains were recorded in healthcare (52,000 jobs), finance (21,000 jobs), and local government (20,000 jobs). Employment also rose in construction, transportation, social assistance, and manufacturing.
Conversely, some industries experienced job losses. The hospitality sector shed 16,000 jobs, retail lost 6,000, and the federal government reduced employment by 10,000 positions. Additionally, temporary jobs declined by 12,000, signaling a potential slowdown in economic growth.
Overall, the report suggests that while the U.S. labor market remains stable, certain indicators, such as rising unemployment and a decline in full-time jobs, may point to a deceleration in economic expansion. Following the report’s release, the U.S. dollar weakened slightly, but the market reaction was muted due to prior concerns over a more significant decline.
Hassett, the White House economic advisor, stated that future reports are likely to show further reductions in government employment. He emphasized the administration’s plan to cut government jobs and spending while boosting employment in the manufacturing sector. He also confirmed that tariffs are inevitable, arguing that such measures will support the expected 3% to 4% economic growth. Hassett expressed doubt that President Trump would grant exemptions for steel tariffs.
As investors try to adjust to Trump’s evolving trade policies, the U.S. Consumer Price Index (CPI) report for February is set to be released on Wednesday. Given the recent Personal Consumption Expenditures (PCE) index data from January, it is possible that CPI could be entering a new downward trend.
The Federal Reserve’s battle against inflation remains challenging, and the recent rise in price pressures has undoubtedly been frustrating for policymakers. However, signs indicate that U.S. inflation may be shifting course, with expectations of a decline in the coming months.
One major uncertainty remains: tariffs. Trump’s decision to impose a 25% tariff on Canadian and Mexican imports and a 20% increase on Chinese goods, along with additional sector-specific and retaliatory tariffs still under discussion, could undermine the Fed’s efforts to bring inflation down to 2%.
In January, the overall CPI climbed to 3%, marking its highest level since June 2024. Core inflation also reached 3.3%. However, February’s data is expected to ease months of concern about inflationary resurgence, with projections indicating a decline in overall CPI to 2.9% and core inflation to 3.1%. Monthly estimates for both indices stand at 0.3%.
Later in the week, Thursday’s Producer Price Index (PPI) for February will provide further insights into inflationary pressures, while on Friday, investors will closely monitor the University of Michigan’s preliminary consumer sentiment survey for March. Last month’s survey raised alarms, as consumer inflation expectations climbed to their highest level in 30 years.
Us100


NASDAQ Potential Bullish Retracement (After Major Correction)NASDAQ price seems to exhibit signs of a major correction as the price action has broken out of it's range.
During the pandemic (Covid-19), NASDAQ experienced two major corrections (worth drops of approx. 18.35% and approx. 24%). Counting these two massive corrections as anomalies, the NASDAQ on average retraces maximum around approx. 17% - 18.5% from a historical perspective.
Once the selling subsides we may potentially see the formation of a credible Higher Low on the Longer Timeframes with multiple confluences from key Fibonacci and Support levels.
The current Trade Plan caters to a drop of approx. 22.5% (to be on the safer side and potentially accounts for a major correction excluding massive systematic failure).
Trade Plan :
Entry @ 19250
Stop Loss @ 17140
TP 1 @ 21360 (Before All Time High)
TP 2 @ 23470 (After All Time High)
Note: Move Stop Loss to Break Even if TP 1 hits.

Nasdaq market analysis: 07-MAR-2025Let’s dive into today's Nasdaq market analysis. Share insights, and potentially spot opportunities for good pips.

NASDAQ Ultimate Support test on the 1week MA50.Nasdaq / US100 is trading inside a Channel Up since the start of this Bull Cycle after the late 2022 bottom.
The price is about to test the 1week MA50, which is the ultimate Support of this bullish trend and has been holding since March 13 2023 (almost 2 years).
It is important for the index to keep a weekly closing over it. If it does we will have the most optimal buy entry case.
The previous two bullish waves interestingly enough both increased by +49.55%.
Buy and target 25500.
Follow us, like the idea and leave a comment below!!

Nasdaq analysis: 06-MAR-2025Good morning, everyone! Today's Nasdaq analysis is designed to educate and empower. Use these insights to refine your price action trading strategy.

NASDAQ: 4H Death Cross always signals a rally.Nasdaq in bearish on its 1D technical outlook (RSI = 38.073, MACD = -289.260, ADX = 41.209) as the mid February bearish wave hit the bottom of the September Channel Up. The formation of a Death Cross on the 4H timeframe has favored buying inside this pattern. In the meantime, the 4H RSI has been rising while the price was correcting, indicating the presence of a Bullish Divergence. Buy and aim for another +16% rise (TP = 23,200).
## If you like our free content follow our profile to get more daily ideas. ##
## Comments and likes are greatly appreciated. ##

Actionable Nasdaq insights: 05-Mar-2025Rise and shine, traders! Start your day with actionable Nasdaq insights. Let's grow your skills together, one chart at a time.

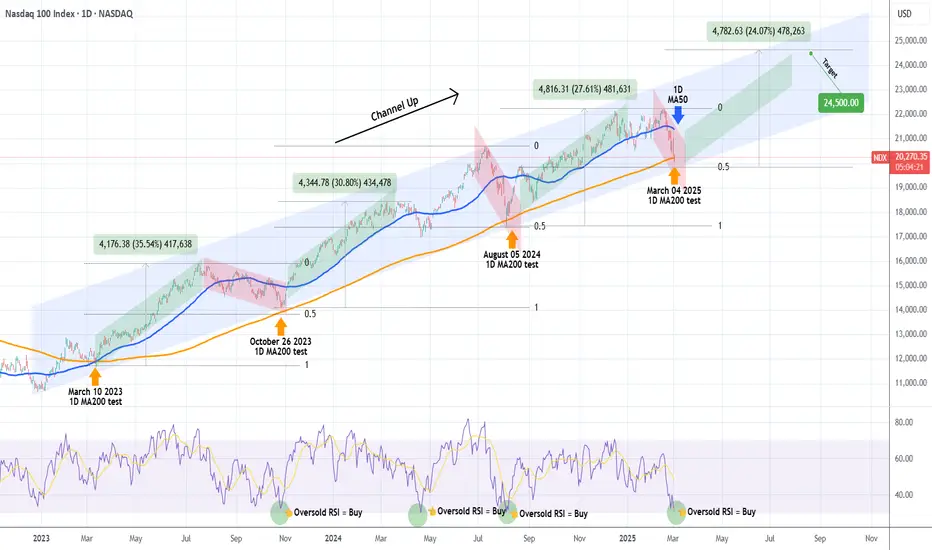
NASDAQ hit its 1D MA200. Strongest buy signal in 2 years!Nasdaq (NDX) hit today its 1D MA200 (orange trend-line) for the first time in 7 months (since the August 05 2024 Low) with its 1D RSI almost oversold (below 30.00). In the past 2 years (since the March 10 2023 test), the 1D MA200 has been tested another 3 times, all of which have been the absolute technical buy entries, kick-starting enormous rallies.
On top of that, the price is close to the bottom (Higher Lows trend-line) of the long-term Channel Up that started on the December 2022 market bottom. Every rally that followed after a 1D MA200 test has been marginally weaker than the previous but all three have been around +30% on average. The last one has been +27.61%, which is -3% weaker than the previous.
As a result, we are expecting a new rally to start now as all buy conditions within a 2-year span have been met (1D MA200, oversold 1D RSI) that can target 24500, which represents a +24.00% rally (-3% shorter rise than the previous).
-------------------------------------------------------------------------------
** Please LIKE 👍, FOLLOW ✅, SHARE 🙌 and COMMENT ✍ if you enjoy this idea! Also share your ideas and charts in the comments section below! This is best way to keep it relevant, support us, keep the content here free and allow the idea to reach as many people as possible. **
-------------------------------------------------------------------------------
💸💸💸💸💸💸
👇 👇 👇 👇 👇 👇
Nasdaq market analysis: 04-Mar-2025Good morning, traders! Welcome to today's Nasdaq market analysis. Compare my price action insights with your own charts and enhance your trading skills.

NAS100 - Nasdaq, won't it go below 20k?!The index is below the EMA200 and EMA50 on the four-hour timeframe and is trading in its medium-term ascending channel. If the index rises towards the suggested zones, we can look for the next Nasdaq sell-off.
The composition of investors’ financial assets from 1990 to 2025 reveals shifts in the allocation of equities, bonds, and cash. Currently, the share of equities in investment portfolios has reached an all-time high of 54%, indicating a growing preference for the stock market among investors.
Conversely, the share of bonds and cash has declined to 18% and 13%, respectively, suggesting reduced interest in holding fixed-income assets and liquidity. At present, more than half of investors’ financial assets are concentrated in equities, which could reflect optimism about the market’s future growth.
This situation calls for increased caution from the Federal Reserve and the Trump administration, as a significant portion of American households’ surplus income is now directed toward stocks. As a result, any downturn in the U.S. stock market could have more severe consequences for the public than before.
Scott Bassett, the U.S. Treasury Secretary, responded to a recent survey indicating that Americans want President Donald Trump to focus more on reducing inflation. He stated that he is confident consumer price inflation in the United States will decline throughout the year.
In an interview with CBS and Face the Nation, Bassett defended Trump’s economic policies, emphasizing that the president is pursuing a comprehensive approach that includes tariffs, deregulation, and a gradual reduction in energy costs.
Meanwhile, following weaker-than-expected preliminary Purchasing Managers’ Index (PMI) data for February and a decline in the University of Michigan’s Consumer Sentiment Index, investors are now pricing in approximately 60 basis points of rate cuts by the Federal Reserve for this year. This projection is 10 basis points higher than the forecasts from the December dot plot.
Market pricing indicates that traders still expect the Federal Reserve to cut interest rates in June, particularly after the release of Personal Consumption Expenditures (PCE) data. However, with Trump ramping up tariff threats against key U.S. trading partners such as China, Canada, and Mexico, outlining a clear economic roadmap has become more challenging. Tariff impositions pose a serious risk of reigniting inflation, prompting many Federal Reserve officials who have recently expressed their views to adopt a “wait and see” approach.
This week, market attention will once again turn to employment data, as investors eagerly anticipate the release of the February Non-Farm Payrolls (NFP) report. Other key events include the preliminary Consumer Price Index (CPI) estimates for the Eurozone and the ISM U.S. Manufacturing PMI on Monday, the ADP Employment Report and ISM Services PMI on Wednesday, and the weekly jobless claims data on Thursday. Additionally, the European Central Bank’s monetary policy decision on Thursday will be closely watched, with economists expecting another interest rate cut.

Is NASDAQ Losing Steam? A Reality Check for TradersHey Realistic Traders, Is CAPITALCOM:US100 Out of Steam? Let’s Dive Into the Analysis…
On the daily timeframe, the Nasdaq remains above the EMA-100, which has served as strong support through multiple successful rebounds. Simultaneously, the price has moved above the bullish trendline, reinforcing the ongoing uptrend.
Within wave 4, the price formed a falling wedge pattern, followed by a breakout. This signals the initiation of wave 5, which could potentially extend beyond the length of wave 1, given that wave 3 did not exceed the 1.618 Fibonacci ratio. Meanwhile, the MACD indicator has already formed a bullish crossover, adding further confirmation of a positive outlook for the Nasdaq.
Considering these strong technical signals, the price is likely to move upward toward the first target at 23,538 , or potentially the second target at 24,356.
However, this bullish scenario depends on the price staying above the critical stop-loss level at 20,833.
Support the channel by engaging with the content, using the rocket button, and sharing your opinions in the comments below.
Disclaimer: "Please note that this analysis is solely for educational purposes and should not be considered a recommendation to take a long or short position on Nasdaq."

"NASDAQ 100 (US 100) Bearish Outlook: Will Supply Zones Hold?"🔹Technical Analysis: US 100 Index (15-Minute Chart)
▪️Key Observations:
1. Downtrend Continuation:
- The US 100 Index is currently in a bearish trend, forming lower highs and lower lows.
- The price is trading below key resistance zones, indicating further downside potential.
2.Supply Zones Identified:
- Two significant supply zones are marked on the chart where selling pressure is expected.
- The first supply zone is around 21,450 – 21,520.
- The second, stronger supply zone is near 21,600 – 21,700, where a previous sell-off occurred.
3. Bearish Rejection Expected:
- The price is likely to retest the lower supply zone before continuing downward.
- A rejection from this zone could lead to further declines.
4. Target Area:
- The projected target area is marked around 20,914, suggesting a possible continuation of the downtrend.
- If the price breaks below this level, further downside momentum could follow.
▪️Conclusion:
- The market structure remains bearish, and traders should watch for a potential rejection at the supply zone.
- A confirmation of resistance could provide shorting opportunities toward the 20,914 target area.
- However, a breakout above the supply zone could invalidate the bearish outlook.
▪️Trade Idea:
Bearish Bias – Wait for confirmation at the supply zone before considering short positions.
😊Don't Forget To Hit The Like Button & Share Your Thoughts In Comments.

NAS100 at Key Support – Bullish Rebound Ahead?PEPPERSTONE:NAS100 is currently testing a major demand zone, which has previously acted as strong support. The recent bearish move has brought price into this key area, increasing the probability of a potential bullish reversal.
If buyers step in and defend this zone, we could see a bounce toward the 21,655 level, aligning with a short-term recovery from the current dip. However, a break and close below this support zone would invalidate the bullish bias and could lead to further declines.
Traders should look for bullish confirmation signals such as rejection wicks, bullish engulfing candles, or a shift in momentum before considering long positions.
Do you agree with this analysis? Drop your thoughts below!

Nasdaq trading insights: 27-Feb-2025Nasdaq trading insights: Not signals, but informative zones to aid your decision-making. Please note: These zones are not trading advice. Use them as a starting point for your own analysis.

NASDAQ: Broke into the 2 year Support Zone.Nasdaq has turned bearish on its 1D technical outlook (RSI = 41/199, MACD = -42.030, ADX = 30.270) as the correction that started last Thursday hit the 1D MA100. The region between the 1D MA100 and 1D MA200 is the index's 2year Support Zone and has been a buy opportunity since February 2023. With the 1D RSI also on 6month lows, the current level is low enough to be a HL on the long term Channel Up, after which rallies to the 3.5 Fibonacci extension have started. Go long, TP = 24,000.
## If you like our free content follow our profile to get more daily ideas. ##
## Comments and likes are greatly appreciated. ##

Nasdaq market analysis: 26-Feb-2025Good morning! Here's your daily Nasdaq market analysis. Learn, grow, and trade wisely.

NASDAQ Three conditions met for strong BUYNasdaq is trading inside a Channel Up in 2025 and today the price reached its bottom.
At the same time it marginally crossed under the MA100 (1d), making today's low the best technical buy opportunity since January 27th.
Trading Plan:
1. Buy on the current market price.
Targets:
1. 22370 (+6.92% rise like the previous two bullish waves).
Tips:
1. The RSI (4h) got oversold on the same level as the Jan 27th low. Overall, an oversold RSI on Nasdaq's last 6 month price action, has been a great buy opportunity.
Please like, follow and comment!!

Nasdaq market analysis: 25-Feb-2025Let’s dive into today's Nasdaq market analysis. Share insights, and potentially spot opportunities for good pips.

NAS100 Analysis: Key Levels & Bearish Trade Setup📊 NAS100 Analysis and Trade Idea | Key Levels & Bearish Bias Explained 📉
Dive into a detailed analysis of the NAS100 (NZ 100) with a focus on key support zones, retracement levels, and a bearish trading bias. Learn how to identify overextended price movements, imbalances, and potential short setups using the daily and 4-hour timeframes. Perfect for traders looking to refine their strategies in indices trading! 💡 💬 Share your thoughts and trading ideas in the comments below!

NASDAQ 4 more months before next correction.Nasdaq (NDX) has been rising non-stop with the 1W MA50 (blue trend-line) as its Support since it first broke above it in March 13 2023, following the 2022 Inflation Crisis Bear Cycle.
This continuous period of growth has been built on a prolonger Bearish Divergence based on the 1W RSI, which has been on Lower Highs since June 05 2023. It is not the first time in recent history that the index has seen this pattern, as in the last 10 years we have had 2 periods of similar growth.
The 2014 - 2015 phase came to a sudden end in the first week of January 2016 after having marginally topped above the 4.0 Fibonacci extension. The 1W RSI Bearish Divergence eventually kicked in and the price dipped below the 1W MA100 (green trend-line), while an RSI below 40.00 formed the bottom.
Similarly, the 2018 - 2019 phase got hammered in early February 2020 after topping very close to the 4.0 Fib ext, again sharply declining below the 1W MA100, finding support exactly on the 1W MA200 (orange trend-line). We need to point out that this was a (technically) exaggerated price collapse though due to the COVID lockdowns.
As mentioned above, we are facing again an RSI Bearish Divergence and if the price action follows the previous two periods that both, amazingly enough, lasted for 742 days (106 weeks) from the first RSI High, we should be expecting a technical peak around June 23 2025 (exactly 4 months from now) near a 4.0 Fibonacci extension at 23500.
-------------------------------------------------------------------------------
** Please LIKE 👍, FOLLOW ✅, SHARE 🙌 and COMMENT ✍ if you enjoy this idea! Also share your ideas and charts in the comments section below! This is best way to keep it relevant, support us, keep the content here free and allow the idea to reach as many people as possible. **
-------------------------------------------------------------------------------
Disclosure: I am part of Trade Nation's Influencer program and receive a monthly fee for using their TradingView charts in my analysis.
💸💸💸💸💸💸
👇 👇 👇 👇 👇 👇

Nasdaq market analysis: 24-Feb-2025Let’s dive into today's Nasdaq market analysis. Share insights, and potentially spot opportunities for good pips.

US100 Is Bullish! Long!
Here is our detailed technical review for US100.
Time Frame: 12h
Current Trend: Bullish
Sentiment: Oversold (based on 7-period RSI)
Forecast: Bullish
The market is trading around a solid horizontal structure 21,588.3.
The above observations make me that the market will inevitably achieve 22,205.6 level.
P.S
The term oversold refers to a condition where an asset has traded lower in price and has the potential for a price bounce.
Overbought refers to market scenarios where the instrument is traded considerably higher than its fair value. Overvaluation is caused by market sentiments when there is positive news.
Like and subscribe and comment my ideas if you enjoy them!
