Trade Idea: US30 Long (BUY LIMIT)Technical Overview
Daily Chart (Macro View):
• Trend: Recent bounce from major support near ~37,600 after a sharp selloff.
• MACD: Still bearish but showing early signs of momentum reversal (histogram rising).
• RSI: Neutral (~53.8), coming up from oversold territory—indicative of potential recovery.
• Price: Holding above 41,000, a key psychological level and previous consolidation zone.
15-Minute Chart (Swing/Short-Term View):
• Price: Forming higher lows after a significant bounce.
• MACD: Nearing a bullish crossover.
• RSI: Moderately bullish at ~56.87.
3-Minute Chart (Entry Precision):
• Price: Recently broke above short-term moving average.
• MACD: Bullish with strong histogram momentum.
• RSI: Slightly overbought (~52.90), but not extreme.
⸻
Fundamental Context (as of May 2025):
• Market sentiment is cautiously bullish after Fed pause hints and solid tech earnings.
• Inflation pressures are easing slightly, supporting risk-on sentiment.
• Recent volatility due to rate expectations and macro data; however, markets are recovering from sharp selloffs.
⸻
Bias: Long Position
US30 shows a strong recovery setup with macro support, bullish lower-timeframe confirmation, and neutral-to-bullish momentum indicators.
Entry (Buy Limit):
40,960 – small retracement near the short-term EMA and previous breakout on the 3-min chart.
Stop Loss (SL):
40,700 – below the recent swing low and psychological round level.
Take Profit (TP):
41,560 – retest of minor resistance from earlier consolidation area, offering a solid risk-reward.
FUSIONMARKETS:US30
Us30predictions

Trade Idea: US30 Long ( BUY LIMIT )Technical Justification:
1. Daily Chart:
• Price has recently bounced strongly from a significant support zone around 37,675, confirming a bullish rejection.
• RSI is rising from oversold levels (currently around 48), showing momentum is shifting upwards.
• MACD is still negative but starting to converge, signaling a potential reversal in the mid-term.
2. 15-Minute Chart:
• Strong bullish move, breaking through previous structure highs.
• MACD and RSI are both in bullish territory, RSI ~63, not yet overbought.
• Price consolidating around 40,090, suggesting possible continuation.
3. 3-Minute Chart:
• Micro trend is clearly bullish.
• Minor consolidation after a push upward — ideal for breakout or pullback entry.
• RSI at ~49, healthy for continuation, MACD slightly bullish.
⸻
Fundamental Backdrop (as of now):
• Earnings season in the US is ongoing with strong reports from major companies.
• Rate cut expectations later in the year are improving market sentiment.
• Recent data suggests soft landing scenario, supporting risk-on assets like equities.
⸻
Trade Setup:
• Direction: Long (Buy)
• Entry: 40,050 (pullback entry)
• Stop Loss (SL): 39,750 (below recent breakout base)
• Take Profit (TP): 40,650
FUSIONMARKETS:US30

Trade Idea: US30 Long ( BUY LIMIT )Technical Analysis Summary:
Daily Chart:
• The US30 is bouncing off a recent sharp correction with a bullish engulfing candle forming at support (around 37,675).
• RSI is recovering from oversold territory, now at 46.14 – momentum is shifting.
• MACD still bearish but histogram is shrinking, indicating weakening downward momentum.
15-Minute Chart:
• Strong recovery after a double-bottom near 38,200.
• RSI at 74.55 shows near overbought but still trending up – strong momentum.
• MACD showing a strong bullish crossover and rising histogram – confirmation of intraday trend.
3-Minute Chart:
• Strong breakout to the upside with consolidation at highs.
• RSI around 58 – room to move higher.
• MACD bullish, histogram expanding – short-term continuation likely.
⸻
Fundamental Context (as of April 2025):
• Recent correction in US indices is likely a pullback within a broader bull market (based on Q1 earnings optimism and easing inflation expectations).
• No major Fed tightening signals – bullish for equities.
• Dow Jones (US30) often rebounds strongly after panic drops, especially when technicals align with macro calm.
⸻
Trade Setup (Buy):
• Entry: 39,700 (current consolidation after breakout)
• Stop Loss (SL): 39,150 (below last minor pullback structure and below 3M EMA support)
• Take Profit (TP): 40,800 (near previous structure on the Daily and round number psychological level) FUSIONMARKETS:US30

Trade Idea: US30 Long ( MARKET )Technical Justification:
Daily Chart:
• Oversold Conditions: RSI is at 35.90, approaching oversold.
• MACD is deeply negative (-905.428 / -831.781), signaling extended downside and a potential for a mean reversion bounce.
• Price recently bounced sharply off a support area around 37,800–38,000, forming a possible bullish rejection wick.
15-Min Chart:
• Bullish Divergence visible in RSI and MACD.
• RSI rebounded from sub-30 to 52.10, signaling strengthening momentum.
• MACD histogram has reduced in negativity, suggesting decreasing bearish pressure.
3-Min Chart:
• Clear short-term uptrend forming after a strong intraday drop.
• RSI 62.56 and MACD turning positive show bullish momentum building.
• Price just reclaimed a key intraday level (~38139) with follow-through.
⸻
Fundamental Bias:
Recent oversold market conditions, combined with potential short-term relief rally due to earnings optimism, Fed rate pause speculation, or geopolitical cooling, support a tactical long bias.
⸻
Trade Setup:
• Entry (Buy): 38,150
• Above the minor resistance turned support zone and confirmation of bullish momentum.
• Stop Loss (SL): 37,800
• Below the recent strong support zone from Daily and intraday.
• Take Profit (TP): 38,750
• Just below the next major resistance zone on the 15-min/1H chart. FUSIONMARKETS:US30

Trade Idea: US30 Short ( MARKET ) Daily Chart (Macro View):
• Bearish divergence: RSI is at 47.38 and turning down — no strong bullish momentum.
• Recent bounce is sharp but came after a massive drop, suggesting a dead cat bounce or retracement.
• MACD remains heavily bearish (-836), showing underlying weakness despite the current bounce.
• Price recently rejected a key resistance near 40,850, aligning with previous support-turned-resistance levels.
15-Min Chart (Medium-Term):
• RSI is at 78.76 — overbought territory.
• Price surged parabolically, forming potential exhaustion.
• MACD shows very high positive values (672.341), usually precedes a correction.
• Potential bearish divergence between price and MACD.
3-Min Chart (Entry Timing):
• Price has stalled at the top, consolidating after an extreme spike.
• MACD and RSI are curling down.
• Ideal for timing a short entry.
⸻
Trade Idea: SHORT US30
• Entry: 40,850 (current resistance zone + psychological level)
• Stop Loss: 41,200 (above key recent highs / invalidation of setup)
• Take Profit: 39,450 (near broken structure & moving average support on lower timeframes)
Risk-to-Reward Ratio (RRR):
• Risk: 350 points
• Reward: 1,400 points
• RRR: 4:1 (excellent)
⸻
Fundamental Context (Supporting the Short Bias):
• Dow is rebounding amid broader market uncertainty (e.g., Fed rate trajectory, inflation prints).
• No strong economic catalyst justifying a sustained breakout to new highs — suggests technical bounce rather than trend reversal.
• Rising yields or a hawkish Fed outlook could reintroduce selling pressure.
FUSIONMARKETS:US30

Trade Idea : US30 Short ( MARKET )Technical Analysis Overview:
1. Daily Chart:
• The index is in a clear downtrend, with price action breaking below the moving average.
• MACD is deeply negative, with a bearish divergence and downward momentum.
• RSI at 37.28, indicating approaching oversold territory, but not yet reversing.
2. 15-Minute Chart:
• Strong downward momentum with sharp drop visible.
• MACD is heavily negative, confirming bearish momentum.
• RSI is at 32.71, indicating oversold conditions, but no clear sign of reversal yet.
3. 3-Minute Chart:
• Sharp sell-off followed by consolidation.
• MACD is negative but appears to be flattening, suggesting potential for a short-term bounce or continued consolidation before the next move.
• RSI at 44.38, showing mild recovery from previous lows but still below the midpoint (50).
Trade Idea:
• Position: Short (Sell)
• Entry Level: 41,250 (near minor resistance or after a weak bullish retracement)
• Stop Loss (SL): 41,800 (Above recent consolidation zone or resistance)
• Take Profit (TP): 40,400 (Previous support area with good potential for price to test)
FUSIONMARKETS:US30

Trade Idea : US30 Short ( SELL LIMIT )Technical Analysis
1. Daily Chart:
• Trend: The price has been in an uptrend but is showing signs of exhaustion.
• MACD: Deep in negative territory (-311.308 & -377.356), confirming bearish momentum.
• RSI: 44.24, indicating weak momentum and room for further downside.
• Key Resistance: 42,890
• Key Support: 41,000
2. 15-Minute Chart:
• Trend: The price has broken below a consolidation zone.
• MACD: Bullish but fading, suggesting exhaustion of upward movement.
• RSI: 48.21, showing indecision but no strong bullish strength.
• Structure: Lower highs and lower lows forming, indicating a potential breakdown.
3. 3-Minute Chart:
• Price Action: Weak bounces and inability to sustain higher prices.
• MACD: Negative and declining, confirming short-term bearish momentum.
• RSI: 41.77, approaching oversold but not yet at extreme levels.
Fundamental Analysis
• Macro Risks:
• Potential market correction after extended bullish trends.
• Economic uncertainty and possible rate hike expectations could pressure equities.
• US Market Conditions:
• Upcoming data releases or Fed commentary could increase volatility and favor bearish moves.
Trade Execution
• Entry: 41,950
• Stop Loss (SL): 42,250 (300-point stop)
• Take Profit (TP): 41,350 (600-point target)
• Risk-to-Reward Ratio (RRR): 2:1 FUSIONMARKETS:US30

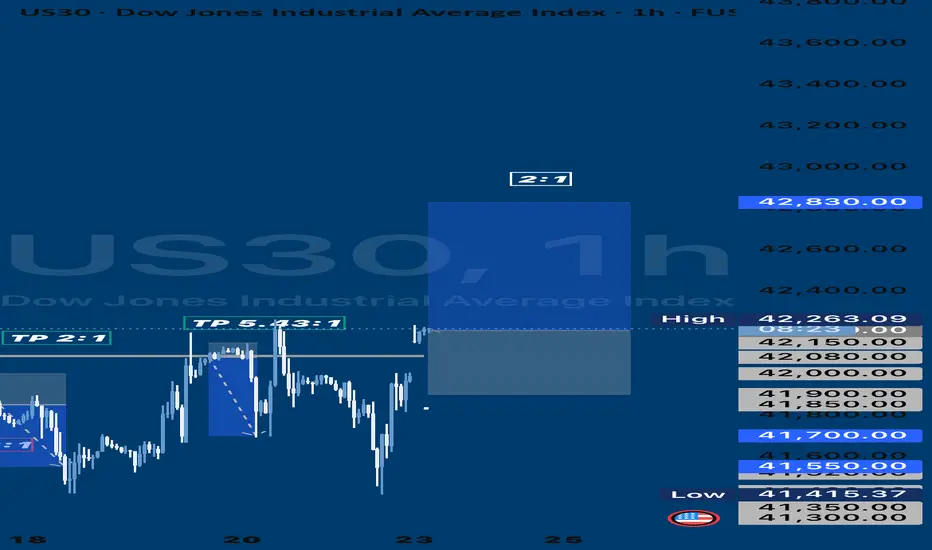
Trade Idea: US30 Long ( BUY LIMIT )1. Technical Analysis Breakdown:
Daily Chart:
• Trend: Bullish overall, but showing signs of pullback.
• MACD: Bearish, indicating weakening momentum.
• RSI: At 45.23 — neutral but leaning toward oversold territory.
• Support level: Around 41,500.
• Resistance level: Recent high near 42,890.
15-Min Chart:
• Trend: Strong intraday upward momentum.
• MACD: Bullish crossover with momentum building.
• RSI: 69.09 — nearing overbought but still has room.
• Support: Around 41,760.
• Resistance: 42,208 (current price), next major level at 42,500.
3-Min Chart:
• Trend: Short-term bullish with a slight consolidation.
• MACD: Flat, showing a pause but no reversal yet.
• RSI: 53.19 — mid-range, suggesting more upside potential.
⸻
2. Fundamental Analysis:
• US economy shows resilience (strong job data, improved GDP).
• Fed’s stance on rates remains balanced, leaning dovish, supporting equities.
• Geopolitical tensions slightly cooling, risk appetite growing.
⸻
3. Trade Plan — Long Position (Buy)
• Entry: 42,210 (after a clean break above consolidation).
• Stop Loss (SL): 41,900 (below recent intraday support).
• Take Profit (TP): 42,830 (previous daily high). FUSIONMARKETS:US30